
 Open Access Article
 This Open Access Article is licensed under a Creative Commons Attribution-Non Commercial 3.0 Unported Licence
Iron-containing N-doped carbon electrocatalysts for the cogeneration of hydroxylamine and electricity in a H2–NO fuel cell†
Nick
Daems‡
a,
Xia
Sheng‡
ab,
Yolanda
Alvarez-Gallego
*c,
Ivo F. J.
Vankelecom
a and
Paolo P.
Pescarmona
*ad
aCentre for Surface Chemistry and Catalysis, KU Leuven, Celestijnenlaan 200 F, 3001 Heverlee, Belgium
bThe School of Chemistry and Chemical Engineering, Henan University of Technology, Lianhua street 100, P.R. China
cSeparation and Conversion Technology, VITO-Flemish Institute for Technological Research, Boeretang 200, 2400 Mol, Belgium. E-mail: yolanda.alvarezgallego@vito.be
dChemical Engineering Department, University of Groningen, Nijenborgh 4, 9747 AG Groningen, The Netherlands. E-mail: p.p.pescarmona@rug.nl
First published on 28th October 2015
Abstract
Iron-containing N-doped carbon materials were investigated as electrocatalysts for the cogeneration of hydroxylamine (NH2OH) and electricity in a H2–NO fuel cell. This electrochemical route for the production of hydroxylamine is a greener alternative to the present industrial synthesis, because it allows converting the energy released during the reaction into electricity. The studied electrocatalysts were prepared by pyrolysis of composites of activated carbon and polyaniline (PANI) incorporating Fe sites (Fe-PANI-AC). Characterisation with a combination of techniques (FT-IR and Raman spectroscopy, XRD, N2-physisorption, XPS and ToF-SIMS) showed that the materials exhibit promising features as electrocatalysts for the NO reduction reaction, as they contain the desired isolated FeNxCy sites and have a relatively high degree of graphitisation, which grants good electrical conductivity. The performance of the Fe-PANI-AC electrocatalysts was investigated by means of linear sweep voltammetry (LSV) in a half cell setup and by chronoamperometry in a H2–NO fuel cell setup and compared to that of a reference electrocatalyst consisting of iron phthalocyanine supported on activated carbon (FePc/AC). The Fe-PANI-AC electrocatalysts led to higher current density than FePc/AC under all studied conditions. At low NO concentration in the feed, FePc/AC displayed higher selectivity towards hydroxylamine, whereas the Fe-PANI-AC electrocatalysts were superior at higher NO concentration (i.e. at the industrially more relevant conditions), both in terms of production rate and of selectivity towards hydroxylamine. Moreover, the Fe-PANI-AC electrocatalysts exhibited high stability under the fuel cell operating conditions. In summary, Fe-PANI-ACs displayed very promising electrocatalytic performance in the reduction of NO to hydroxylamine and offered the additional advantage of being less expensive compared to the reference FePc/AC electrocatalyst or to a benchmark noble-metal-based electrocatalyst as Pt/AC.
Introduction
The depletion of raw materials reserves used for supplying chemicals and fuels is stimulating the chemical industry to pursue alternative technologies for increasing the efficiency of their production processes in terms of conversion, product selectivity and energy demands.1,2 Currently, many industrial products are obtained through thermodynamically favourable reactions. For such exergonic reactions (ΔrG < 0), the process is accompanied by liberation of energy, generally in the form of heat. This energy is often not utilised efficiently and in some processes it can be problematic to remove it safely. A possible, greener alternative to conventional chemical processes is provided by electrochemical processes in which the energy released during the reaction is converted into electricity.1,3–8 This approach is conceptually very attractive as it allows the cogeneration of electricity and useful chemical products in a fuel cell setup. All reagents that can be oxidised or reduced in an electrochemical way qualify for being produced in this type of electrochemical cells. Another advantage of an electrochemical production is the possibility of controlling the reaction rate and selectivity by means of the electrical potential.9 In this work, this electrochemical cogeneration approach is applied to the reduction of nitric oxide (NO) to hydroxylamine, which is widely used in industry for the synthesis of cyclohexanone oxime. In turn, this is used to produce caprolactam, the main application of which is in the production of Nylon 6.3,4,9–11 The annual worldwide hydroxylamine production for caprolactam synthesis amounts to about 0.9 million metric tons.12 In industry, hydroxylamine is generally produced through the hydrogenation of high oxidation-state compounds of nitrogen, like nitric oxide or nitric acid, in a sulphuric acid solution with platinum supported on activated carbon as catalyst.3,4,9–11 The as-synthesised hydroxylamine reacts immediately with sulphuric acid to produce the more stable and easier to handle hydroxylamine sulphate salt [(NH3OH)2SO4]. This transformation is required since the hydroxylamine free base can decompose violently at temperatures above 50 °C.9 Substituting the current technology with an electrochemical production process would have the advantage of the cogeneration of electricity, and could also allow lowering the costs related to the catalyst if different active species than platinum are employed. The possibility of cogenerating NH2OH and electricity in a H2–NO fuel cell was first investigated by Langer et al.13 and has been further developed since then.3,4,9,11 The electrochemical cell typically consists of a porous anode and cathode placed in two compartments that are separated by a proton exchange membrane (PEM). Hydrogen is oxidised at the anode generating protons, which pass to the cathodic compartment through the PEM, and liberating electrons that flow to the cathode by means of the external circuit. Nitrogen monoxide is reduced at the cathode by means of the protons and electrons coming from the anode. The overall reactions are:Anode:
| H2 → 2H+ + 2e− E° = 0 V | (1) |
Cathode:
| 2NO + 2H+ + 2e− → N2O + H2O E° = 1.59 V | (2) |
| 2NO + 4H+ + 4e− → N2 + 2H2O E° = 1.68 V | (3) |
| NO + 3H+ + 3e− → NH2OH E° = 0.38 V | (4) |
| NO + 5H+ + 5e− → NH3 + H2O E° = 0.73 V | (5) |
Based on the above standard reduction potentials, it is clear that all these reduction reactions can lead to the cogeneration of electricity and nitrogen compounds. An important observation made during previous experimental studies, is that the selectivity depends strongly on the electrode potential. At low potentials (Ecell < 0.5 V vs. SHE), hydroxylamine and ammonia are the dominant products while at high potentials nitrous oxide is the main product. Nitrogen is mainly observed at intermediate potentials.9,13–15 The most investigated electrocatalysts for the reduction of NO are based on noble metals like platinum, palladium and ruthenium supported on activated carbon.4,5 These noble metal electrocatalysts lead to high conversions of NO but they lack a sufficiently high selectivity towards hydroxylamine.3,4,9,10,13–16 This is mainly related to two side-reactions: (1) the further reduction of NH2OH to NH3; (2) the formation of N2O through the reaction of two NHO species adsorbed on neighbouring sites on the Pt surface, with the elimination of a H2O molecule. It was discovered that the selectivity of Pt electrocatalysts towards hydroxylamine could be significantly increased by covering it with sulphur. It was proposed that the presence of sulphur prevents breaking of the nitrogen–oxygen bonds during the reduction process, thus increasing the selectivity towards hydroxylamine by preventing N2 and NH3 formation.9,13 A promising alternative class of electrocatalysts for the reduction of NO in a fuel cell is represented by transition metal complexes.3 Iron-phthalocyanine, cobalt–phthalocyanine, vitamin B12, Prussian blue and cobalt–porphyrin have been investigated for this purpose.11 Among them, iron phthalocyanine on activated carbon (FePc/AC) or on graphite (FePc/Gr) showed the most promising results with a selectivity up to 90% for NH2OH.3 Although the mechanism of the NO reduction on this kind of electrocatalysts is not yet fully understood, it was proposed that NO is reduced on FePc/Gr by means of three consecutive reduction steps, each adding one electron and one proton to the intermediate until finally hydroxylamine is released into the solution (Scheme 1). The observed high selectivity was ascribed to the relatively high distance between neighbouring iron sites, which are separated through phthalocyanine rings. This distance prevents the interaction of two NHO species adsorbed on adjacent sites, and thus limits the formation of the N2O side-product. Furthermore, it was suggested that two neighbouring metal sites are needed in order to split the N–O bond, which is a requirement for the further reduction of NH2OH to NH3, making this reaction nearly impossible on this type of electrocatalysts. However, this hypothesis has not been proven so far.3
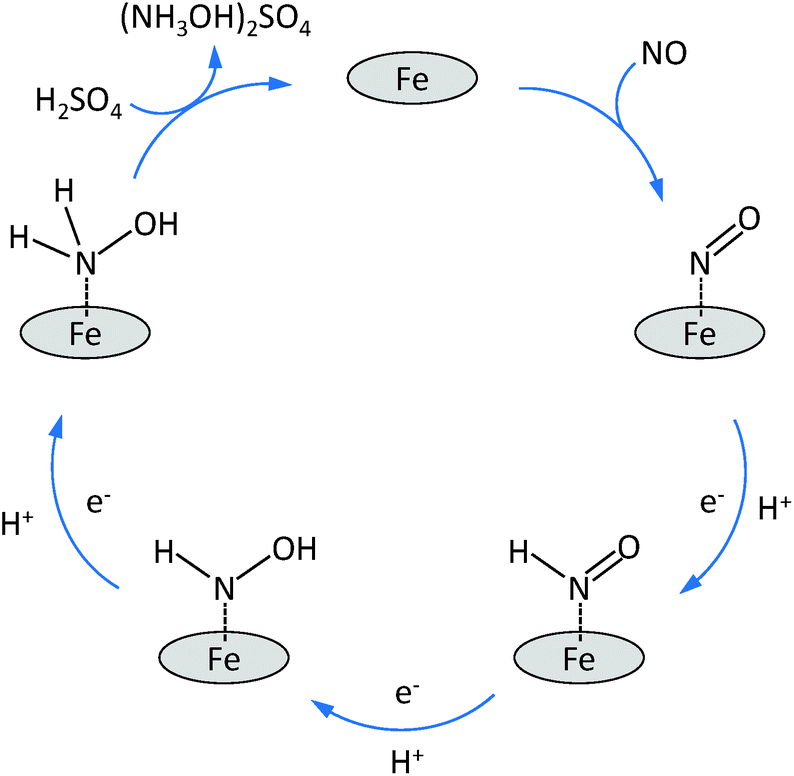 | ||
| Scheme 1 Proposed mechanism for the reduction of NO to NH2OH over isolated Fe sites. | ||
Based on the above discussion of the state of the art, it is possible to define the desirable features of electrocatalysts for the selective reduction of NO to NH2OH. First of all, the presence of isolated metal centres as active sites is most likely an important requisite to selectively obtain hydroxylamine. Secondly, in order to successfully adsorb NO and initiate its reduction, it is important that the metal has at least two accessible oxidation states [e.g. Fe(II)/Fe(III)]. Finally, an extended delocalised π-system in the electrocatalyst will grant high electrical conductivity, which is an asset for a good electrocatalytic performance. In this work, we report polyaniline-derived Fe-containing N-doped carbon materials as electrocatalysts for the reduction of NO in half cell and fuel cell setups. These electrocatalysts were prepared by pyrolysing composite materials consisting of activated carbon and polyaniline (PANI), in which the N-atoms originating from PANI can coordinate Fe sites (Fe-PANI-AC, see Scheme 2). This class of materials has been recently reported as a very promising type of electrocatalysts for the oxygen reduction reaction,17,18 but also displays the above mentioned desirable features for the selective reduction of NO to NH2OH. Moreover, Fe-PANI-ACs offer several advantages compared to FePc supported on carbon materials: (1) the synthesis is straightforward and easily up-scalable; (2) compared to the expensive phthalocyanine, the synthesis of Fe-PANI-ACs makes use of inexpensive, available chemicals; and (3) several parameters (pyrolysis temperature, metal content and type) can be easily modified in order to optimise the activity and selectivity of the electrocatalyst. Polyaniline was preferred over other N-containing polymers such as polypyrrole because it contains phenyl groups, which are expected to generate more readily a graphitic structure, thus leading to a material with the desired high electrical conductivity.
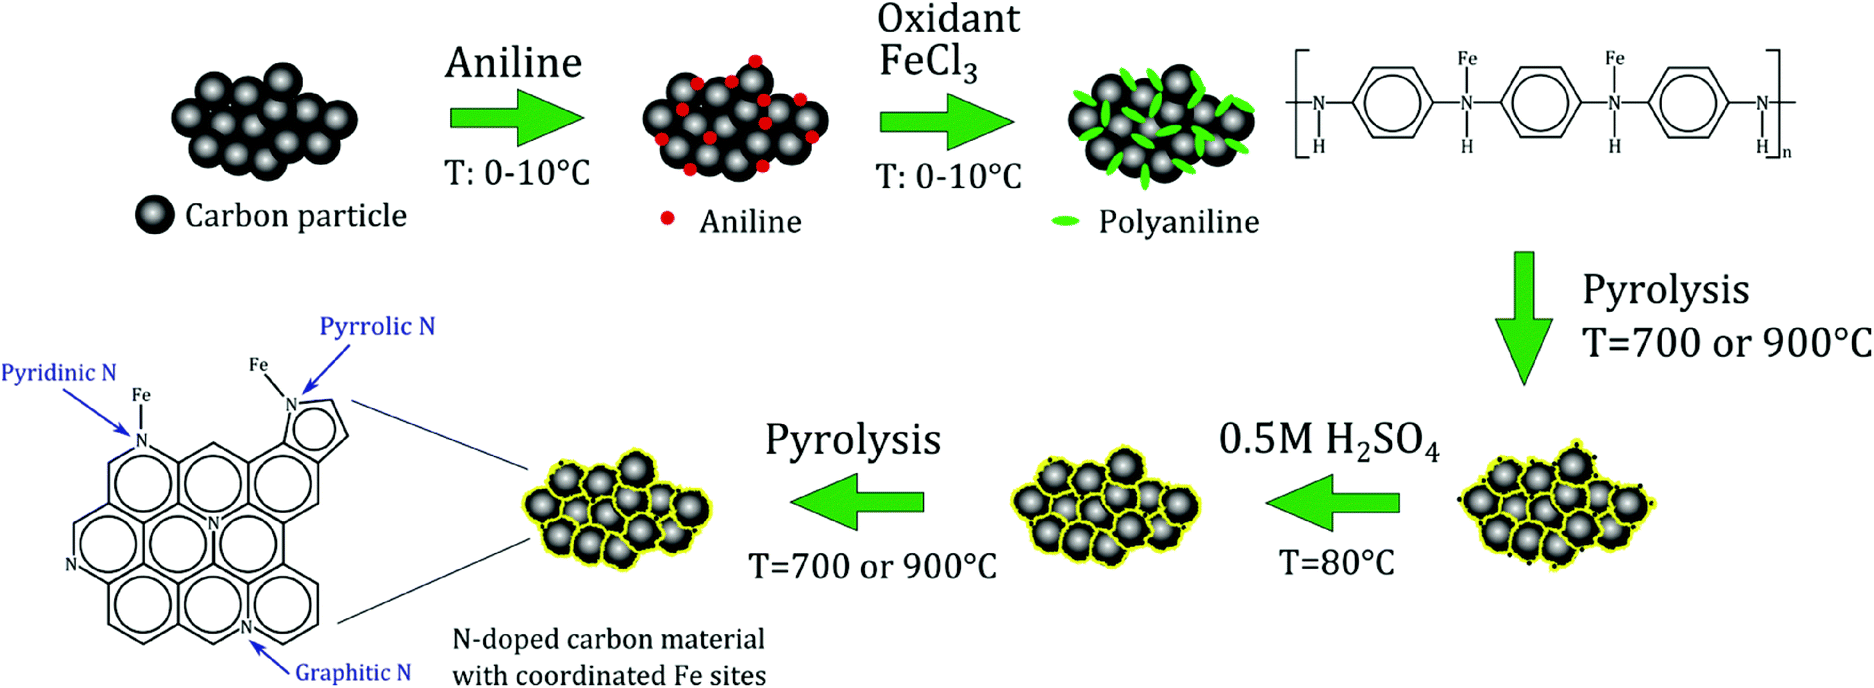 | ||
| Scheme 2 Synthesis of the Fe-PANI-AC electrocatalysts. | ||
Experimental
Materials
Aniline (99.8%, pure, Acros organics), activated carbon Norit® SX1G (878 m2 g−1, Norit Americas inc., further referred to as AC(N)), activated carbon from Sigma-Aldrich (1300 m2 g−1, further referred to as AC(S)), iron(III) chloride (97%, reagent grade, Sigma Aldrich), ammonium peroxydisulphate (98%, Acros Organics), sulphuric acid (>95%, Fisher Chemical), hydrochloric acid (≈37%, Fisher Chemical), iron(II) phthalocyanine (FePc, >95%, TCI Europe), 10% (wt/wt) Pt on charcoal type 18 (Johnson Matthey), polytetrafluoroethylene (Teflon® PTFE 6N, Dupont), fluorinated ethylene propylene resin (Teflon® FEP 8000, Dupont), were used as received from commercial sources.Synthesis of the electrocatalysts
Iron-containing N-doped graphitic carbon materials were synthesised according to a procedure described in the literature.17 In the first step, activated carbon (AC(S)) was treated with a 6 M HCl aqueous solution for 24 h at room temperature to remove impurities. Next, 2.5 mL aniline was mixed with 0.5 g of the purified activated carbon and 0.5 M HCl at a temperature between 0 and 10 °C. After 20 min, ammonium peroxydisulphate ((NH4)2S2O8, as oxidant) and iron chloride (1![[thin space (1/6-em)]](https://www.rsc.org/images/entities/char_2009.gif) :1 or 1:4 molar ratio relative to aniline), were added to the reaction mixture. This suspension was stirred for 24 h. Next, the solvent was evaporated and the remaining solid was completely dried in a vacuum oven at 80 °C overnight. In the next step, the material was subjected to a first pyrolysis under N2 at 700 or 900 °C for 1 h at a heating rate of 3.3 °C min−1. Afterwards, unstable species were mostly removed from the materials by means of a treatment in 0.5 M H2SO4 at 80 °C for 8 h, followed by filtration, washing with deionised water and drying in a vacuum oven. Finally, the materials were subjected to a second pyrolysis for 3 h at the same temperature used in the first treatment. Two different electrocatalysts were prepared: (1) Fe-PANI-AC-1 at a pyrolysis temperature of 700 °C and a metal-to-aniline ratio of 1:1 and (2) Fe-PANI-AC-2 at a pyrolysis temperature of 900 °C and a metal-to-aniline ratio of 1:4.
:1 or 1:4 molar ratio relative to aniline), were added to the reaction mixture. This suspension was stirred for 24 h. Next, the solvent was evaporated and the remaining solid was completely dried in a vacuum oven at 80 °C overnight. In the next step, the material was subjected to a first pyrolysis under N2 at 700 or 900 °C for 1 h at a heating rate of 3.3 °C min−1. Afterwards, unstable species were mostly removed from the materials by means of a treatment in 0.5 M H2SO4 at 80 °C for 8 h, followed by filtration, washing with deionised water and drying in a vacuum oven. Finally, the materials were subjected to a second pyrolysis for 3 h at the same temperature used in the first treatment. Two different electrocatalysts were prepared: (1) Fe-PANI-AC-1 at a pyrolysis temperature of 700 °C and a metal-to-aniline ratio of 1:1 and (2) Fe-PANI-AC-2 at a pyrolysis temperature of 900 °C and a metal-to-aniline ratio of 1:4.
As a reference, an iron phthalocyanine (FePc) electrocatalyst was prepared by dispersing a selected amount of FePc (0.3 wt% of iron) onto the activated carbon support (Norit SX1G) according to a literature procedure.19 First, FePc was dissolved in concentrated H2SO4 and sonicated for 30 min. Next, AC(N) was added and the suspension was homogenised by ultrasonication to obtain a good dispersion of FePc on the carbon supports. Then the suspension was poured in deionised water, filtered, washed with deionised water until the pH was 7 and dried overnight at 70 °C in an oven under air.
Physicochemical characterisation
FT-IR spectra were recorded on a Bruker IFS 66/v/S FT-IR spectrometer on KBr pellets in the range 400–4000 cm−1. The spectrometer was controlled by OPUS version 4 software from Bruker. A STOE Stadi P Combi instrument was used in transmission mode to measure the X-ray diffraction (XRD) patterns. The instrument was used in high-throughput mode and was equipped with a Cu-Kα radiation source (λ = 1.54 Å) and a Kα1 Germanium Johann-type monochromator. A high-throughput image plate position detector (IP-PSD) from STOE was used as detector. The XRD instrument was controlled by the WinXPOW software (version 2.20) from STOE and all measurements were performed in a 2θ range from 0 to 75°. Nitrogen adsorption-desorption isotherms were measured at 77 K on a Micromeritics Tristar 3000. The pore size distributions were determined using the Barrett–Joyner–Halenda (BJH) method, whereas the Brunauer–Emmett–Teller (BET) method was used to calculate the surface area of the samples. Thermogravimetric analysis (TGA) was performed to determine the iron content. The measurements were carried out under O2 flow on a TGA Q500 from TA instruments. The temperature was ramped with a heating rate of 5 °C min−1 until 1000 °C was reached, and then it was held constant until the mass change was smaller than 0.05% per min., after which the system was cooled down to room temperature. Previous reports showed by XRD that the residual red-orange powder is Fe2O3.18 The residual weight can thus be used to determine the overall iron content of the sample. X-ray photoelectron spectroscopy (XPS) measurements were performed by a Physical Electronics PHI 1600 multi-technique system using an Al Kα (1486.6 eV) monochromatic X-ray source, which was operated at 15 kV and 150 W at a base pressure of 2 × 10⁻⁹ Torr. The graphitic C 1s band at 284.6 eV was taken as internal standard, in order to correct possible deviations caused by electric charging of the samples. The multipack software was used for the deconvolution and integration of the XPS spectra. Room-temperature Raman spectra were recorded on a Dilor XY spectrometer from HORIBA Jobin Yvon Inc. The spectroscope was equipped with an Olympus BH 2 microscope, a monochromator, a filter and charge-coupled detector with liquid nitrogen cooling (CCD3000 with a resolution of 2 cm−1). A beam originating from an argon/krypton mixed gas laser at a wavelength of 514 nm (Coherent Innova 70C) was sent to the sample. Deconvolution and peak integration was performed by using the Igor pro software. Time of Flight Secondary Ion Mass Spectroscopy (ToF-SIMS) was carried out on an IONTOF V instrument (IONTOF, GmbH, Münster, Germany). Sample powders were manually pressed with a spatula onto the adhesive part of Post-it® papers. A pulsed Bi5+ metal ion source was used to produce a primary beam using an acceleration voltage of 30 kV. An AC target current of 0.06 pA with a bunched pulse width lower than 1.5 ns was used. The analysis was conducted on the positive and negative secondary ion species. For the spectra, a raster of 128 × 128 data points over an area of 150 × 150 μm2 was used. The total primary ion beam dose for each analysed area was always kept below 1011 ions per cm2, ensuring static conditions. Lateral resolution of ∼3 μm and mass resolution m/Δm > 5000 at 29 m/z were maintained for positive and negative spectra acquisition. Charge compensation was done by interlaced electron flood gun (Ek = 20 eV). All data analyses were carried out using the software supplied by the instrument manufacturer, SurfaceLab (version 6.5). It is important to note here that ToF-SIMS is a semi-quantitative technique and, therefore, can be used to identify the different species present in the material and their relative abundancies, but not for an absolute quantification of their amounts (for which purpose XPS is employed in this work). This also accounts for the differences in the relative abundances of the species that can be detected in the spectra of the negative and the positive secondary ions.20Electrochemical characterisation
Characterisation of electrodes as cathodes for NO-reduction was carried out in an electrochemical half cell and in a single cell. The half cell and the single cell setups used for the electrochemical experiments have been described in detail elsewhere.9The working electrodes (VITO CoRE®) consisted of a current collector (stainless steel gauze), an active layer (i.e. the electrocatalyst embedded in a porous PTFE matrix) and a hydrophobic gas diffusion outer layer (porous PTFE). Cold rolling was used to manufacture the VITO CoRE® gas diffusion electrodes.9,21 The composition of the active layer was 10% PTFE and 90% electrocatalyst powder for the cathode, and 15% PTFE and 85% of 10% Pt on activated charcoal for the anode. An ion-permeable membrane (Zirfon® separator22) was cast onto the current collector side of the anode.
The half cell consisted of a cathode (working electrode), a reference electrode and a counter electrode. Ag/Ag2SO4 (+0.69 V vs. standard hydrogen electrode (SHE)) was used as reference electrode (Koslow Scientific) and a Pt disc welded to a titanium (Ti) plate was used as counter electrode. The cathode and the counter electrode were separated by a liquid electrolyte (3 M sulphuric acid) and a separator membrane.
The single cell consisted of two working electrodes, anode (oxidation of H2) and cathode (reduction of NO), separated by a liquid electrolyte (3 M sulphuric acid) and an ion-permeable membrane. Besides functioning as a medium for the charge transport, the electrolyte in this case served also to react with the hydroxylamine free base, yielding its sulphate salt.
The cells had a projected electrode surface area of 10 cm2. Reactant gases (6% or 18% NO in N2 (air products) for the cathode and 100% H2 (air products) for the anode) were fed to the respective compartments at a flow rate of 10 mL min−1 by means of mass flow controllers (In-Flow, Bronkhorst), with an overpressure of 5 mbarg (5 cm water column) at the exhaust. The liquid electrolyte was saturated with N2 and circulated through the cell with a peristaltic pump (Watson–Marlow).
All the electrochemical measurements were performed at room temperature (18 °C) using VersaSTAT 3F potentiostat (Princeton Applied Research) and the VersaStudio software for data acquisition. IR compensation was enabled for the acquisition of the voltammograms. Typical values for internal resistance were 0.15–0.20 and 0.6–0.7 Ohm for the half cell and the single cell, respectively.
The different electrocatalysts were evaluated by means of linear sweep voltammetry (LSV) in the cathode half cell. The voltammograms were recorded by varying the potential of the working electrode (cathode) from the open circuit potential (OCP) to the hydrogen evolution potential (−0.69 V vs. Ag/Ag2SO4) at a scan rate of 1 mV s−1. Prior to recording an LSV under NO flow, the cell was saturated with N2 for at least 12 h and a blank measurement was performed under nitrogen flow at 5 mbarg.
The performance of the electrocatalysts in the production of hydroxylamine in a fuel cell reactor was assessed by means of chronoamperometry. These experiments were carried out in the single cell setup keeping the cell potential constant. In order to achieve a product concentration that would be high enough for detection by potentiometric titration, the current was collected until the total charge that passed through the electrode was at least 8000 C, while continuously recirculating the electrolyte. Afterwards, the electrolyte solution was analysed by potentiometric titration. Hydroxylamine, which is present as hydroxylammonium sulphate in the 3 M sulphuric acid solutions [2NH2OH + H2SO4 → (NH3OH)2SO4], was determined by potentiometric titration (DL77 Titrator, Mettler Toledo) with 1 M NaOH (Titripac®, Merck), in the potential range from 325 mV to −280 mV. LabX software was used for data acquisition and analysis. The deviation of the measured values with respect to the theoretical concentration of control solutions was ≤2.2%. More details about this procedure can be found elsewhere.9 Gaseous products (N2O and N2) were not analysed.
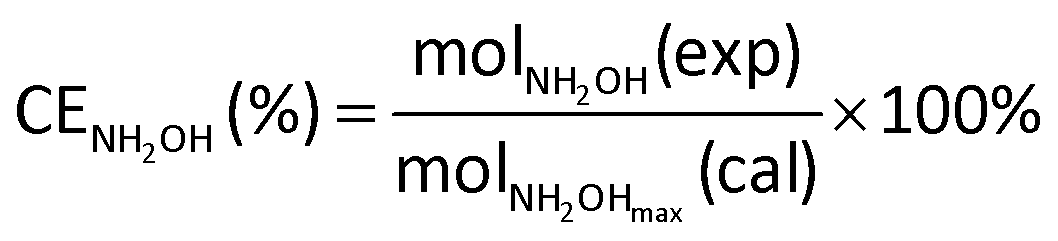
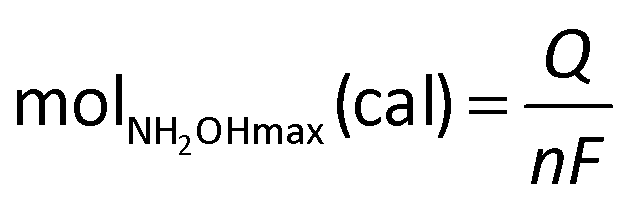
The current efficiency towards NH2OH [CENH2OH (%)] and the yield of NH2OH [YNH2OH (%)] were calculated based on the following formulas:
 | (6) |
 | (7) |
 | (8) |
The power generated in the fuel cell at steady state (in W m−2) was calculated by multiplying the measured value of the cell potential at steady state (ΔEcell, in V) by the measured value of the current density at steady state (j, in A m−2).
The stability of the different electrocatalysts was evaluated by determining the decay in the current density over time measured by chronoamperometry at a constant potential of −0.1 V vs. Ag/Ag2SO4 over the time interval 5000–40000 s. The initial part of the measurement (0–5000 s) was not included because the decay in current in this period is caused by non-faradaic processes (i.e. the formation of the double layer, which involves a capacitive current).
Results and discussion
Fe-containing N-doped carbon electrocatalysts were prepared by pyrolysing composite materials consisting of activated carbon and polyaniline (PANI) and incorporating Fe sites (Fe-PANI-AC). The electrocatalysts were tested for the reduction of NO, with NH2OH as target product. FePc/AC, which has been reported to be a very good electrocatalyst for this application,3 was used as a reference.The main parameters that are expected to influence the electrocatalytic performance of the Fe-PANI-AC materials in the reduction of NO to NH2OH are (1) the Fe loading and configuration, (2) the N loading and configuration, (3) the degree of graphitisation and (4) the surface area.3,23 In order to correlate the physicochemical properties of the Fe-PANI-AC materials with their electrocatalytic performance, the materials were characterised using a combination of techniques.
Physicochemical characterisation of the Fe-PANI-AC materials
Since Fe centres have been proposed to be the active sites on which the electrocatalytic reduction of NO occurs,3 the influence of the metal loading on the performance of the electrocatalysts in the reduction of NO to hydroxylamine was investigated by employing different amounts of Fe in the synthesis of the Fe-PANI-AC materials (theoretical Fe content: 38 and 11 wt%, corresponding to a metal-to-aniline molar ratio of 1:1 and 1:4, respectively). The final composition of the two Fe-containing N-doped carbon electrocatalysts was determined by means of TGA (metal content) and XPS (carbon, nitrogen, oxygen and metal content). The results are summarised in Table 1. The TGA analysis shows that a similar amount of iron is present in the final structure of both electrocatalysts, regardless the large difference in the amount of iron used during the synthesis in the two cases. This suggests that the maximum amount of iron (∼5 wt%) that can be retained in the structure is limited by the initial amount of aniline, which was the same for both electrocatalysts. A significant fraction of the iron present in the Fe-PANI-AC materials is expected to be coordinated to N-atoms originating from aniline (Scheme 2).18 Other iron species having a weaker interaction with the N-doped carbon structure, should get largely removed during the acid and thermal treatments. The removal of these iron species is expected to be more efficient from the surface region of the material. Indeed, analysis with a surface technique as XPS (having an analysis depth of only few nm) shows a significantly lower iron content in both samples (Table 1). Although the total metal loading is similar in the two materials, the surface content of iron measured by XPS is more than double in Fe-PANI-AC-1 than in Fe-PANI-AC-2. This can significantly affect the electrocatalytic activity of the materials (vide infra), because the reduction of NO is expected to occur at the catalyst surface. Also the N-content of Fe-PANI-AC-2 determined by XPS is lower than that of Fe-PANI-AC-1 (Table 1). These results can be rationalised on the basis of the pyrolysis temperature, which was 700 °C for Fe-PANI-AC-1 and 900 °C for Fe-PANI-AC-2. Several reports on N-doped carbon materials demonstrated that at increasingly high temperatures above 650 °C less nitrogen is incorporated in carbon materials, because at these temperatures the formation of C–C and N–N bonds becomes more favourable than that of C–N bonds.23,24 The fact that iron chloride can act as an oxidant for the polymerisation of aniline might also have contributed to the higher N content in Fe-PANI-AC-1 since a higher amount of iron precursor was present in its synthesis. The N-containing part of these materials is expected to be located at or close to the surface, with the core consisting of activated carbon (Scheme 2). Therefore, the lower N content in Fe-PANI-AC-2 also implies less surface sites for coordinating Fe, and can thus account for the lower surface metal content in this sample.
| Theoretical Fe wt% | Fe wt% (XPS) | Fe wt% (TGA) | Theoretical N wt% | N wt% (XPS) | Theoretical C wt% | C wt% (XPS) | O wt% (XPS) | |
|---|---|---|---|---|---|---|---|---|
| Fe-PANI-AC-1 | 38.3 | 3.0 | 4.2 | 7.9 | 12.0 | 50.5 | 75.4 | 7.9 |
| Fe-PANI-AC-2 | 11.2 | 1.3 | 4.9 | 11.1 | 6.4 | 72.1 | 81.6 | 7.6 |
The preparation of the Fe-containing N-doped carbon materials has been reported to lead to a significant decrease in surface area compared to the parent activated carbon.18 The same trend is observed in this work: the surface area measured by N2-physisorption is 206 m2 g−1 for Fe-PANI-AC-1 and 197 m2 g−1 for Fe-PANI-AC-2 (see Fig. S1† for the isotherm of Fe-PANI-AC-2). These values are slightly lower compared to similar materials reported earlier in the literature (270–315 m2 g−1).18
XRD was used to investigate the influence of the thermal and acid treatments on the crystalline phases present in the Fe-PANI-AC samples (Fig. 1). The XRD patterns of the as-synthesised materials indicate the presence of unreacted oxidant, ammonium persulphate (APS, peaks labelled with △ in Fig. 1), of polyaniline (20.4° and 24.6°, labelled with ○) and of ammonium chloride (peaks labelled with ◊).18 The relatively higher intensity of the APS peaks in the diffractogram of Fe-PANI-AC-2 is due to the higher APS-to-Fe ratio used in this sample. After the acid treatment and the pyrolysis steps, all the peaks in the diffractogram of the as-synthesised materials (Fig. 1) disappear. In the case of Fe-PANI-AC-1, the diffractogram after the second pyrolysis only displays a broad peak around 2θ = 24° (Fig. 1A), which is characteristic for the (002) graphitic plane. Since this peak is rather broad, the graphitic carbon structure of the material has a relatively low degree of crystallinity.23,25 The absence of any other signals suggests that the acid and thermal treatments efficiently removed the unreacted APS and ammonium chloride. On the other hand, the diffractogram of Fe-PANI-AC-2 displays XRD peaks ascribed to FeS and Fe3S4 (□ and ● in Fig. 1), together with the broad signal of graphitic carbon at around 24°. These sulphides were generated by the degradation of APS in the presence of iron species. The fact that iron sulphides were found only in Fe-PANI-AC-2 is likely to have been caused by the higher initial APS-to-Fe ratio that was used in this sample. An additional explanation for this behaviour is that a lower amount of N remained in Fe-PANI-AC-2 due to its higher pyrolysis temperature (see Table 1). This in turn means that this sample contains fewer sites available to bind Fe, thus favouring the formation of the iron sulphides. In agreement with these results, XPS shows an S content of ∼3 wt% for Fe-PANI-AC-2, whereas the very low S content (<0.1 wt%) in Fe-PANI-AC-1 confirms the absence of iron sulphides.
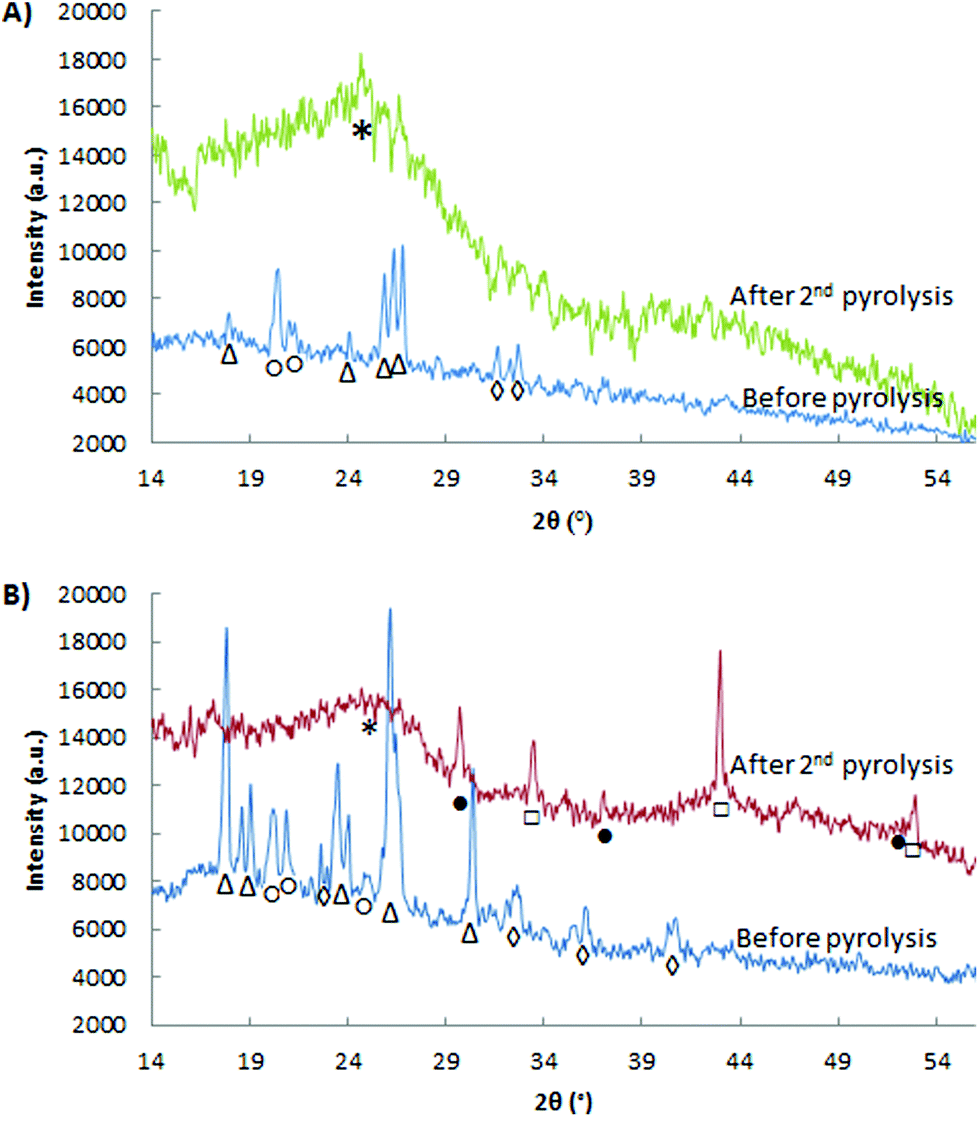 | ||
| Fig. 1 X-ray diffractograms of: (A) Fe-PANI-AC-1 and (B) Fe-PANI-AC-2. The peaks in the XRD pattern are identified as follows: △ is (NH4)2S2O8, ◊ is NH4Cl, ○ is polyaniline, □ is FeS, ● is Fe3S4 and * is graphitic carbon. | ||
Raman spectroscopy provides useful information on the degree of graphitisation of the synthesised electrocatalysts (Fig. 2).23 Two characteristic bands can be distinguished in the Raman spectra of both materials: the D band at 1350 cm−1 and the G band at 1590 cm−1. The G band is generally ascribed to the planar vibration of sp2 C atoms in ideal graphitic layers and thus provides a measure of the amount of graphitic structure in the two materials. As for other carbon materials doped with N, the G band is found at lower wavenumbers than in undoped carbons and this down-shift is caused by an alteration in the electronic structure of the graphitic carbon lattice caused by the electron-donating capability of N atoms.23,26 The D band is associated with disordered structures at the border of the sp2 domains. The graphitisation degree can be estimated based on the ratio between the areas of the D and G bands (ID/IG).23 For Fe-PANI-AC-1 and -2, the ID/IG values are 1.1 and 1.0, respectively. The slightly lower graphitic degree for Fe-PANI-AC-1 originates from its lower pyrolysis temperature (700 °C, compared to 900 °C for Fe-PANI-AC-2). These ID/IG values are also similar to those reported for graphite (ID/IG of 1.0),27 proving that the prepared materials have a relatively high degree of graphitisation. The apparent discrepancy between this result and the relatively low degree of crystallinity indicated by XRD can be understood considering the composite nature of the Fe-PANI-ACs and the lower analysis depth of Raman (∼1–5 μm) compared to XRD (∼30 μm), which implies that the latter analysis included a larger fraction of the amorphous activated carbon located in the core of the materials (see Scheme 2). The deconvolution of the Raman spectra shows the presence of two additional peaks, centred at 1200 and 1510 cm−1 (Fig. 2). These are generally assigned to C atoms outside the perfectly planar graphite network and to heteroatoms present in the graphite lattice, respectively.25 As expected based on the lower degree of graphitisation for Fe-PANI-AC-1, the combined area of these two bands accounts for a larger fraction of the total area for Fe-PANI-AC-1 than for Fe-PANI-AC-2.
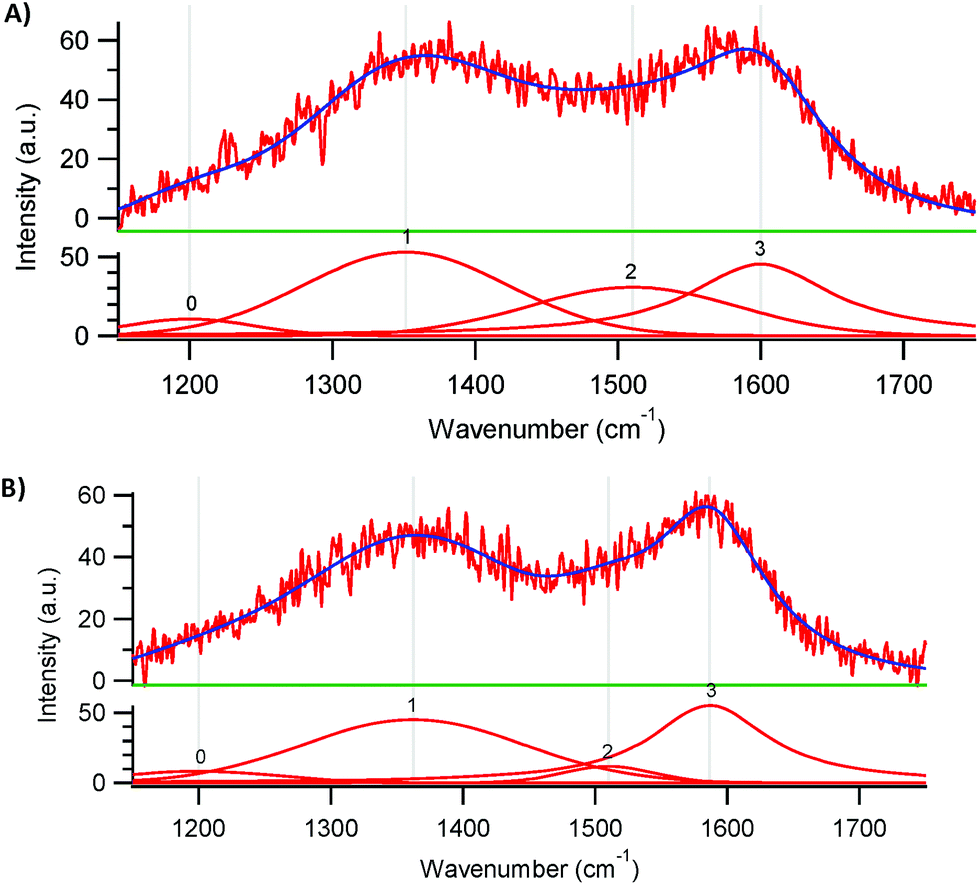 | ||
| Fig. 2 Deconvoluted Raman spectra of (A) Fe-PANI-AC-1 and (B) Fe-PANI-AC-2. | ||
The polymerisation of aniline in the initial step of the synthesis procedure was monitored by means of FT-IR before the first pyrolysis step was performed (Fig. 3). The spectrum obtained for the non-pyrolysed Fe-PANI-AC-1 is comparable to spectra that were previously reported for pure polyaniline.18,28,29 The peaks at 1610 (△) and 1480 cm−1 (◊) are assigned to the C![[double bond, length as m-dash]](https://www.rsc.org/images/entities/char_e001.gif) N stretching in quinoid diimine rings and to the aromatic CC stretching, respectively. The sharp peak at 1403 cm−1 (■) is ascribed to C–N stretching in the proximity of a quinoid diimine ring. The absorption bands at 1302 (○) and 1232 cm−1 (□) are attributed to aromatic C–H bending and aryl C–N stretching, respectively. The broad absorption band at 1134 cm−1 (●) is related to the benzenoid C–H in plane-bending and finally the large peak at 797 cm−1 (*) is characteristic for the out-of-plane deformations of C–H on 1,4-disubstituted rings.18,28,29 After the second pyrolysis, all these peaks disappear from the FT-IR spectrum of Fe-PANI-AC-1, thus confirming the XRD analysis (vide supra) and demonstrating that polyaniline is fully converted into a new carbon structure upon pyrolysis.
N stretching in quinoid diimine rings and to the aromatic CC stretching, respectively. The sharp peak at 1403 cm−1 (■) is ascribed to C–N stretching in the proximity of a quinoid diimine ring. The absorption bands at 1302 (○) and 1232 cm−1 (□) are attributed to aromatic C–H bending and aryl C–N stretching, respectively. The broad absorption band at 1134 cm−1 (●) is related to the benzenoid C–H in plane-bending and finally the large peak at 797 cm−1 (*) is characteristic for the out-of-plane deformations of C–H on 1,4-disubstituted rings.18,28,29 After the second pyrolysis, all these peaks disappear from the FT-IR spectrum of Fe-PANI-AC-1, thus confirming the XRD analysis (vide supra) and demonstrating that polyaniline is fully converted into a new carbon structure upon pyrolysis.
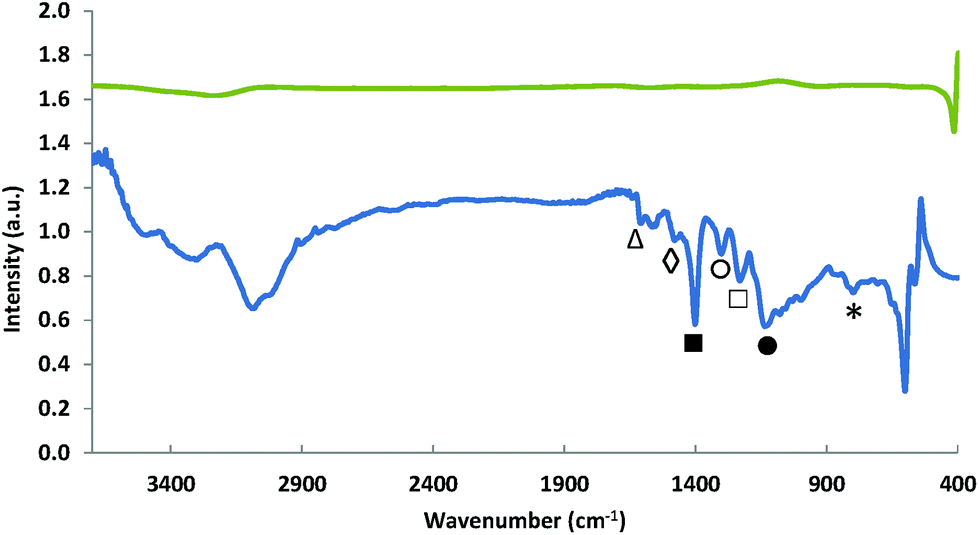 | ||
| Fig. 3 FT-IR spectra of Fe-PANI-AC-1 before pyrolysis (bottom) and after the second pyrolysis (top). | ||
Further analysis of the XPS data provides information about the configuration of N atoms in the prepared materials.17,18,23Fig. 4 shows the different N configurations that can be typically found in N-doped carbon materials: (N1) pyridinic N, (N2) pyrrolic N, (N3) and (N4) graphitic or quaternary N and (N5) oxidised pyridinic N. In the XPS spectrum they can be found at 398.0–399.3 eV (N1), 399.8–401.2 eV (N2), 401.1–402.7 eV (N3/N4) and >402.8 eV (N5).23 In the presence of a metal (in this case iron), N can also be found in a configuration bound to the metal (Fig. 4). However, this N–Fe peak cannot be distinguished from the pyridinic N peak in XPS since they occur at almost the same binding energy.18 Therefore, in the following discussion the signals of N–Fe and pyridinic N are considered as a whole. In order to investigate the influence of the temperature on the N content and the N configuration, an extra sample was prepared with the same composition used for Fe-PANI-AC-1 but with a different pyrolysis temperature (400 °C). XPS clearly shows that the N content decreases with the temperature from 22 wt% at 400 °C to 6 wt% at 900 °C, confirming the trend of decreasing N content with increasing pyrolysis temperature (vide supra). Furthermore, it is observed that the N configuration is strongly affected by the pyrolysis temperature (Fig. 4). No graphitic N species are present in the material pyrolysed at 400 °C, whereas a new peak that can be correlated to the formation of graphitic N emerges at higher binding energy in the XPS signal of the material pyrolysed at 700 °C. This proves that graphitisation of the Fe-PANI-AC material requires a high pyrolysis temperature. The fraction of graphitic nitrogen further increases in the material pyrolysed at 900 °C, as indicated by the deconvolution of the N 1s signal in the XPS spectra (Table 2 and Fig. S2†). The fraction of pyridinic N and pyrrolic N decreases with the pyrolysis temperature, with the effect being much more pronounced for pyrrolic N (Table 2). Based on this observation, it can be concluded that pyrrolic N is the least stable species, which is in line with previous reports.23,30 The higher fraction of pyridinic N/N–Fe in the Fe-PANI-AC pyrolysed at 700 °C compared to 900 °C can be associated with a higher amount of N–Fe species since more Fe was detected by XPS in Fe-PANI-AC-1 than in Fe-PANI-AC-2 (see Table 1). However, the nature of the iron species in the Fe-PANI-AC materials is more complex, as shown by the presence of a contribution assigned to iron oxides (at 530 eV) in the O 1s signal in XPS (Fig. S3 and Table S1†). Based on these XPS data, it was calculated that the fraction of surface iron species that is present as iron oxides is 13% for Fe-PANI-AC-1 and 50% for Fe-PANI-AC-2 (assuming that the iron oxides are Fe2O3). The higher fraction of iron oxides in Fe-PANI-AC-2 can be related to the decrease in number of surface N sites available for coordinating Fe, caused by the higher pyrolysis temperature used in the synthesis of this material. To further evaluate the configuration of Fe inside the electrocatalyst, the high resolution Fe 2p XPS signal was investigated (Fig. 4). The two bands at around 711 and 723 eV are assigned to 2p3/2 and 2p1/2 photoelectrons from Fe. XPS peaks in this position have been ascribed to several different Fe-containing species, including Fe(II)–N in pyridine–iron complexes,31 Fe–S species,32 and Fe–O in iron oxides.33 Since Fe-PANI-AC-1 does not contain Fe–S species (vide supra) we assign the obtained XPS signal to the expected Fe–N species in this material (Scheme 2) and to iron oxides (as indicated by the O 1s signal).
 | ||
| Fig. 4 Top: Representation of a graphitic carbon material with the different possible N configurations. Middle: N 1s XPS signal as a function of the pyrolysis temperature used in the synthesis of Fe-PANI-AC. Bottom: Fe 2p XPS signal of Fe-PANI-AC-1. | ||
| Sample | Pyridinic N (or N–Fe) | Pyrrolic N | Graphitic N | Oxidised pyr N | Npyr/Nquat |
|---|---|---|---|---|---|
| Fe-PANI-AC-1 (400 °C) | 57% | 43% | 0% | 0% | ∞ |
| Fe-PANI-AC-1 (700 °C) | 44% | 14% | 32% | 10% | 1.4 |
| Fe-PANI-AC-2 (900 °C) | 35% | 8% | 50% | 7% | 0.7 |
The nature of the iron sites in the Fe-PANI-AC materials was further investigated by Time of Flight-Secondary Ion Mass Spectroscopy (ToF-SIMS). This analysis shows that the Fe-PANI-AC materials contain the anticipated FeNxCy species, where y is in the range from 1 to 12 (compounds with higher values for y could no longer be distinguished from the background signal) and x is in the range from 1 to 4, since iron can coordinate a maximum of four nitrogen atoms (see Table 3).34 These data lead to an important conclusion: all four possible degrees of coordination of Fe with N are present in the material. The analysis also provides the relative abundance of the FeNxCy species. However, these data should be considered with caution, because the analysis with negative secondary ions indicates that FeN2Cy species are the most abundant type in both materials, whereas FeNCy species are the major ones when the analysis is carried out with positive secondary ions (Table 3). ToF-SIMS also confirms the presence of Fe–O species in both materials (see Table S2†), while virtually no N–Fe–O species were observed. This supports our assignment of the Fe 2p XPS signal to both Fe–N and Fe–O species. The ratio of Fe–O species to FeNxCy species is higher for Fe-PANI-AC-2 (0.76) than for Fe-PANI-AC-1 (0.20) (see Table S2†), in line with the results obtained by deconvoluting the O 1s XPS signals (vide supra). The presence of fragments containing more than one Fe atom (Fe2O+, Fe2O2+ and Fe3O3+) confirms the assignment of these Fe–O species to iron oxides, which are most likely organised in small, amorphous domains, as no peak related to any crystalline iron oxide phase was observed by XRD (Fig. 1). On the other hand, no iron sulphides were detected by ToF-SIMS although these species were observed in Fe-PANI-AC-2 by XRD. This suggests that the iron sulphides are not exposed on the surface of the material, since ToF-SIMS has an analysis depth of only 1–3 monolayers. This would also explain why these species did not get removed efficiently by the acid and thermal treatment (vide supra).
| FeNCy− | FeN2Cy− | FeN3Cy− | FeN4Cy− | |
|---|---|---|---|---|
| Fe-PANI-AC-1 | 26.1 | 36.7 | 26.0 | 11.2 |
| Fe-PANI-AC-2 | 19.1 | 43.5 | 14.2 | 23.2 |
| FeNCy+ | FeN2Cy+ | FeN3Cy+ | FeN4Cy+ | |
|---|---|---|---|---|
| Fe-PANI-AC-1 | 63.1 | 14.5 | 11.3 | 11.2 |
| Fe-PANI-AC-2 | 50.9 | 16.0 | 16.4 | 16.8 |
In summary, the characterisation of Fe-PANI-ACs shows that the materials contain the anticipated Fe–N species, which are expected to be the electrocatalytically active sites.3,9 The N atoms involved in the coordination of Fe can have pyridinic or pyrrolic configuration (Scheme 2 and Fig. 4), but if less than two pyrrolic N are involved (e.g. in FeNCy), then the positive charge of iron should be compensated by anions, such as chlorides. Indeed, the presence of Cl in both materials was proven by XPS (1.7 wt% for Fe-PANI-AC-1 and <0.5 wt% for Fe-PANI-AC-2). Besides the N–Fe species, the materials contain iron in the form of oxides and, in the case of Fe-PANI-AC-2, of sulphides. The latter are not exposed on the surface and, therefore, will not contribute to the electrocatalytic activity, whereas the iron oxide domains are present at the surface and may contribute to the activity in the NO reduction reaction.
Electrochemical characterisation
During the LSV measurements, the potential was varied from the open circuit potential to −0.69 V vs. Ag/Ag2SO4, while a gas mixture containing 6% or 18% NO in N2 was continuously cycled over the cathode compartment. Previous experimental research has shown that the selectivity towards hydroxylamine is the highest when 3 M H2SO4 is used as electrolyte and that the electricity generation increases with the partial pressure of NO up to 25 kPa (i.e. ∼25% NO), at which it reaches a plateau.3
A first indication of the performance of the synthesised electrocatalysts in the production of hydroxylamine is provided by the value of the current density in the region of interest, i.e. at a potential below −0.31 V vs. Ag/Ag2SO4, which is the standard potential (E°) for the reduction of NO to NH2OH (Fig. 5, top).9 The current that is produced at potentials above −0.31 V vs. Ag/Ag2SO4 is caused by other reduction reactions that are not of interest for this study and which will thus not be discussed further. Based on the current densities in the region of interest, the activity for the reduction of NO increases in the order FePc/AC < Fe-PANI-AC-2 < Fe-PANI-AC-1 < Pt/AC. This trend can be explained based on the metal content of these electrocatalysts, which increases in the same order (from 0.3 wt% for FePc/AC to 1 wt% for Fe-PANI-AC-2, 3 wt% for Fe-PANI-AC-1 and 10 wt% for Pt/AC). Since it is assumed that metals are the active sites promoting the reduction of NO (see Scheme 1), it is expected that the electrocatalyst with the highest metal loading leads to the highest current density. It should be noted that for the Fe-PANI-AC electrocatalysts, the surface metal loading (as determined by XPS) was assumed to be the important figure for explaining the NO reduction activity. Although the current density measured by LSV offers a first, rapid evaluation of the electrocatalysts performance in the reduction of NO, it does not provide any information about the selectivity towards the desired hydroxylamine product. Therefore, the Pt-containing electrocatalyst is not necessarily the most suitable for the selective production of hydroxylamine. On the contrary, previous reports showed that Pt electrocatalysts display very poor selectivity towards hydroxylamine and are thus not the best choice for this application.3,4 In order to get a better idea on the selectivity of the NO reduction on the different electrocatalysts, single cell tests were performed (see next section).
 | ||
| Fig. 5 Top: LSV plots of the electrocatalysts under study with 6% NO in N2 as a cathode feed. Bottom: LSV plots of Fe-PANI-AC-2 with 6 and 18% NO in the feed. The part of the plot at more negative potential relative to the standard potential for the reduction of NO to NH2OH (marked by the vertical line at −0.31 V vs. Ag/Ag2SO4) is the region of interest for this study. | ||
Linear sweep voltammetry in the half cell setup was also employed to study the influence of the NO content in the feed gas on the produced current using Fe-PANI-AC-2 as electrocatalyst (Fig. 5, bottom). As expected, the current density at potentials lower than −0.31 V vs. Ag/Ag2SO4 increases when the concentration of NO in the feed is increased from 6 to 18%. However, the current density does not increase by a factor of three upon a threefold increase in reactant concentration. This suggests that there are not enough active sites available in the electrocatalyst in order to maintain the same reaction rate with the increased concentration of NO in the feed.
000 s in order to ensure that a representative amount of data was recorded in a quasi-stationary condition. The electrocatalysts performance can be evaluated based on the rate of hydroxylamine production [mmolNH2OH h−1], on the yield of hydroxylamine [YNH2OH (%)], on the current efficiency towards hydroxylamine [CENH2OH (%)], which is a measure of the selectivity towards NH2OH in the reduction of NO, and on the power generated at steady state (Table 4).
| Entry | Electrocatalyst used in the cathode | % NO | ΔEcell poised (V) | ΔEcell at steady state (V) | Current density (j) at steady state (A m−2) | Power at steady state (W m−2) | Production rate (mmolNH2OH h−1) | Y NH2OH (%) | CENH2OH (%) |
|---|---|---|---|---|---|---|---|---|---|
| 1 | Fe-PANI-AC-1 | 6 | 0 | 0.018 | −115 | −2.1 | 0.46 | 31 | 34 |
| 2 | Fe-PANI-AC-2 | 6 | 0 | 0.014 | −98 | −1.4 | 0.27 | 18 | 29 |
| 3 | FePc/AC | 6 | 0 | 0.010 | −76 | −0.8 | 0.60 | 39 | 80 |
| 4 | Pt/AC | 6 | 0 | — | −130 | — | Not detected | 0 | 0 |
Several conclusions can be drawn from the chronoamperometric tests performed with 6% NO in the feed. First of all, the trend already observed by LSV of increasing current density with increasing content of accessible metal (either Fe or Pt) is confirmed in these experiments. Secondly, the selectivity towards hydroxylamine is much higher over FePc/AC than over the Fe-PANI-AC materials (see the current efficiency values in Table 4). This behaviour is ascribed to the lower iron content and isolated nature of the iron sites of FePc/AC, and is consistent with previous reports,3 in which it was proposed that the formation of the main side products in the synthesis of NH2OH from NO, i.e. N2O and NH3, requires two neighbouring iron sites. Therefore, a lower metal content will lead to a higher selectivity towards hydroxylamine since the probability to encounter two neighbouring metal sites in the final structure of the electrocatalyst decreases by lowering the metal loading. The current efficiencies achieved with the two Fe-PANI-AC materials are similar to each other, and lower than that achieved with FePc/AC. This suggests that in these two electrocatalysts the iron sites are closer than in FePc/AC, as a consequence of the higher metal loading but also of the absence of the phthalocyanine ligand acting as a spacer. As anticipated, no hydroxylamine was produced when Pt/AC was used as electrocatalyst (Table 4). This result is attributed both to the nature of the metal and to its high loading. Based on the discussion above, the ranking of the investigated electrocatalysts differs whether the focus lays on current generation or on selectivity to hydroxylamine. For the former the performance increases in the order FePc/AC < Fe-PANI-AC-2 < Fe-PANI-AC-1 < Pt/AC, while the selectivity increases in the order Pt/AC < Fe-PANI-AC-2 ∼ Fe-PANI-AC-1 < FePc/AC. Based on these results, the Fe-PANI-AC materials can be considered promising electrocatalysts for the reduction of NO to NH2OH, because they lead to a yield of the desired hydroxylamine similar to that obtained with FePc/AC, but they are able to generate significantly higher electric power (Table 4). Moreover, these materials have the advantage of a straightforward preparation from inexpensive precursors.
From the perspective of potential industrial application, it is relevant to study the performance of the electrocatalysts also using a higher concentration of NO in the gas feed (18%). These tests were performed by poising the cell at 0, 0.05 and 0.10 V and using either Fe-PANI-AC-2 or the reference FePc/AC as electrocatalyst (Table 5). In line with logical expectations and with what was observed in the LSV tests, the current density increases by increasing the concentration of the reactant in the feed (compare entry 1 in Table 5 with entry 2 in Table 4, and entry 4 in Table 5 with entry 3 in Table 4). On the other hand, and quite surprisingly, the selectivity towards hydroxylamine measured in terms of current efficiency increases significantly in the case of Fe-PANI-AC-2, whereas it decreases dramatically in the case of FePc/AC. This results in an almost threefold higher production rate of hydroxylamine over Fe-PANI-AC-2 compared to FePc/AC (Table 5). The lower hydroxylamine selectivity with FePc/AC can be explained considering that at low NO concentrations (e.g. 6%), the probability that two NO molecules come in contact with each other is very low due to the relatively low number of NO molecules that are being fed to the cathodic compartment and due to the lack of neighbouring iron sites in this type of electrocatalysts. Since an encounter between two NO molecules (or intermediates) is necessary to produce the main side-products (see Introduction), the selectivity towards NH2OH can decrease by increasing the concentration of reactant (e.g. to 18% NO). However, this type of analysis cannot account for the increase in hydroxylamine selectivity observed with Fe-PANI-AC-2. This strongly suggests that the nature of the active sites in the Fe-PANI-AC electrocatalysts is different, and presumably more complex, compared to the well-defined sites in FePc/AC. In this line of reasoning, a possible explanation for the increased selectivity with Fe-PANI-AC-2 is that some active iron sites might be less accessible or might coordinate NO more weakly and thus remain unoccupied at low NO concentrations. At higher NO contents these sites will be utilised as well. In the hypothesis that these sites have lower accessibility, the chance of a second NO molecule approaching them will be low. If these iron sites coordinate NO more weakly, they might be also more prone to release the formed NH2OH, thus preventing its further reduction to NH3. Therefore, both types of sites would lead to an increased selectivity towards hydroxylamine, thus explaining the observed behaviour. The existence of active sites with different activity is strongly supported by the ToF-SIMS data, which showed the presence of FeNxCy species with different value of x (1 to 4) in the Fe-PANI-AC materials (vide supra). However, further research is still necessary to shed more light on the adsorption strength and the location of the various types of active sites in these electrocatalysts and on the possible contribution of the iron oxide species. Further understanding of the selectivity of the electrocatalysts could also be achieved by analysing the gaseous products of the NO reduction, which was not possible with the setup employed in this work.
| Entry | Electrocatalyst used in the cathode | % NO | ΔEcell poised (V) | ΔEcell at steady state (V) | Current density (j) at steady state (A m−2) | Power at steady state (W m−2) | Production rate (mmolNH2OH h−1) | Y NH2OH (%) | CENH2OH (%) |
|---|---|---|---|---|---|---|---|---|---|
| 1 | Fe-PANI-AC-2 | 18 | 0 | 0.020 | −153 | −3.1 | 1.23 | 27 | 63 |
| 2 | Fe-PANI-AC-2 | 18 | 0.050 | 0.067 | −139 | −9.3 | 0.92 | 21 | 53 |
| 3 | Fe-PANI-AC-2 | 18 | 0.100 | 0.112 | −112 | −12.5 | 0.63 | 14 | 46 |
| 4 | FePc/AC | 18 | 0 | 0.017 | −117 | −2.0 | 0.44 | 9.9 | 30 |
| 5 | FePc/AC | 18 | 0.050 | 0.063 | −74 | −4.5 | 0.34 | 7.6 | 42 |
| 6 | FePc/AC | 18 | 0.100 | 0.108 | −64 | −7.0 | 0.32 | 7.1 | 40 |
The study of Fe-PANI-AC-2 and FePc/AC as electrocatalysts with 18% NO in the feed was completed by investigating the effect of poising the cell at different potentials, i.e. 0, 0.05 and 0.10 V. Increasing the cell potential enhanced the power generation at the expense of the hydroxylamine production (Table 5). At each potential, the electric power generated as well as the selectivity and yield of the desired hydroxylamine are markedly higher with Fe-PANI-AC-2 compared to those obtained with FePc/AC. These results confirm the superior performance of Fe-PANI-AC-2 when 18% NO is used as gas feed. The gradual decrease in the hydroxylamine selectivity over Fe-PANI-AC-2 by increasing the cell potential, and thus in conditions in which the reaction rate and the current density are lower, is consistent with our hypothesis of different types of active sites in this material. Among the three tested cell potentials, 50 mV might result in the best compromise between power density on one hand, and yield and selectivity towards hydroxylamine on the other hand.
Finally, the stability of the two Fe-PANI-AC electrocatalysts was evaluated based on the chronoamperometric measurements carried out at a constant cell potential of 0.01 V for 40000 s in a 3 M H2SO4 solution and with 6% NO in the gas feed. The performance loss between 5000 and 40000 s (i.e. after initial stabilisation) is 6% for both Fe-PANI-ACs (Fig. 6), which means that our electrocatalysts are rather stable under the fuel cell operating conditions.
 | ||
| Fig. 6 Relative current density vs. time (j–t) plot based on chronoamperometric measurements of the Fe-PANi-AC electrocatalysts at a cell potential of 0.01 V in a 3 M H2SO4 solution with 6% NO in the gas feed. | ||
Conclusions
Iron-containing N-doped carbon materials derived from activated carbon and polyaniline incorporating Fe sites (Fe-PANI-AC) were reported here for the first time as electrocatalysts for the reduction of NO with the industrially relevant NH2OH as target product. The electrochemical synthesis of hydroxylamine in a fuel cell setup is a very attractive option in the context of green chemistry as it would allow producing this useful compound while converting the energy liberated in the process into electricity. The Fe-PANI-AC electrocatalysts showed very promising results in terms of current density generated, selectivity and yield of the desired hydroxylamine product, particularly when the tests were performed employing a gas feed with higher NO concentration (18%). Under these conditions, the performance of Fe-PANI-AC was much superior to that of the reference FePc/AC (increase of 33% in terms of selectivity towards NH2OH, 1.5 times higher power generation, and a nearly threefold increase in NH2OH production rate), which was the most promising electrocatalyst reported so far for this application. Importantly, the Fe-PANI-AC electrocatalysts displayed high stability under fuel cell operating conditions. An additional advantage of the Fe-PANI-AC electrocatalysts is that their synthesis is based on inexpensive precursors, is straightforward and has the potential to be easily up-scalable. The characterisation of the Fe-PANI-AC electrocatalysts indicated that different types of isolated N-coordinated Fe sites are present, alongside with iron oxides. The observed electrocatalytic behaviour could be correlated well with the existence of this variety of active sites. Future research should aim at elucidating further the complex nature of the iron species acting as active sites in the reduction of NO to NH2OH. This could entail DFT computational modeling of the different FeNxCy sites observed in this work, and of their interaction with NO and with the reaction intermediates in the proposed mechanism (Scheme 1). Moreover, the optimisation of the synthesis method (e.g. pyrolysis temperature, type of activated carbon support and metal loading) is expected to lead to further improvements in the electrocatalytic performance.Acknowledgements
The authors acknowledge sponsoring from Flemish Agency for Innovation by Science and Technology (IWT) in the frame of an SBO project (OCPEC, contract number 090027) and for a Ph.D. grant (ND), the IAP-PAI research programs from the Belgian federal government and the START1 and Methusalem (CASAS) projects of the KU Leuven. We thank Kitty Baert (VUB) for helping with the XPS and Raman measurements, Claude Poleunis (UCL) for his help with the ToF-SIMS measurements and Gina Vanbutsele (KU Leuven) and Zhenchen Tang (University of Groningen) for helping with the N2 physisorption measurements.References
- X. Sheng, N. Daems, B. Geboes, M. Kurttepeli, S. Bals, T. Breugelmans, A. Hubin, I. F. J. Vankelecom and P. P. Pescarmona, Appl. Catal., B, 2015, 176–177, 212–224 CrossRef CAS.
- D. S. Su and G. Centi, J. Energy Chem., 2013, 22, 151–173 CrossRef CAS.
- K. Otsuka, H. Sawada and I. Yamanaka, J. Electrochem. Soc., 1996, 143, 3491–3497 CrossRef CAS.
- W. Lewdorowicz, W. Tokarz, P. Piela and P. K. Wrona, J. New Mater. Electrochem. Syst., 2006, 9, 339–343 CAS.
- S. H. Langer and H. P. Landi, J. Am. Chem. Soc., 1986, 86, 4694–4698 CrossRef.
- F. Alcaide, P. L. Cabot and E. Brillas, J. Power Sources, 2006, 153, 47–60 CrossRef CAS.
- B. Wouters, X. Sheng, A. Boschin, T. Breugelman, E. Ahlberg, I. F. J. Vankelecom, P. P. Pescarmona and A. Hubin, Electrochim. Acta, 2013, 111, 405–410 CrossRef CAS.
- X. Sheng, B. Wouters, T. Breugelmans, A. Hubin, I. F. J. Vankelecom and P. P. Pescarmona, ChemElectroChem, 2014, 1, 1198–1210 CrossRef CAS.
- Y. Alvarez-Gallego, X. Dominguez-Benetton, D. Pant, L. Diels, K. Vanbroekhoven, I. Genné and P. Vermeiren, Electrochim. Acta, 2012, 82, 415–426 CrossRef CAS.
- S. Polizzi, A. Benedetti, G. Fagherazzi, C. Goatin, R. Strozzi, G. Talamini and L. Toniolo, J. Catal., 1987, 106, 494–499 CrossRef CAS.
- M. T. de Groot, M. Merkx, A. H. Wonders and M. T. M. Koper, J. Am. Chem. Soc., 2005, 127, 7579–7586 CrossRef CAS PubMed.
- W. B. Fisher and L. Crescentini, in Kirk-Othmer Encyclopedia of Chemical Technology, Wiley Interscience, 5th edn, 2011 Search PubMed.
- M. J. Foral and S. H. Langer, Electrochim. Acta, 1991, 36, 299–307 CrossRef CAS.
- A. C. A. de Vooys, G. L. Beltramo, B. Van Riet, J. A. R. van Veen and M. T. M. Koper, Electrochim. Acta, 2004, 49, 1307–1314 CrossRef CAS.
- A. C. A. de Vooys, M. T. M. Koper, R. A. van Santen and J. A. R. van Veen, J. Catal., 2001, 202, 387–394 Search PubMed.
- B. G. Snider and D. C. Johnson, Anal. Chim. Acta, 1979, 105, 9–23 CrossRef CAS.
- G. Wu, K. L. More, C. M. Johnston and P. Zelenay, Science, 2011, 332, 443–447 CrossRef CAS PubMed.
- G. Wu, C. M. Johnston, N. H. Mack, K. Artyushkova, M. Ferrandon, M. Nelson, J. S. Lezama-Pacheco, S. D. Conradson, K. L. More, D. J. Myers and P. Zelenay, J. Mater. Chem., 2011, 21, 11392–11405 Search PubMed.
- R. Chen, H. Li, D. Chu and G. Wang, J. Phys. Chem. C, 2009, 113, 20689–20697 CAS.
- J. C. Vicker and D. Briggs, in ToF-SIMS: Materials Analysis by Mass Spectrometry, IM Publications LLP, 2nd edn, 2013 Search PubMed.
- F. Zhang, S. Cheng, D. Pant, G. Van Bogaert and B. E. Logan, Electrochem. Commun., 2009, 11, 2177–2179 CrossRef CAS.
- P. Vermeiren, R. Leysen, H. Beckers, J. P. Moreels and a. Claes, J. Porous Mater., 2008, 15, 259–264 CrossRef CAS.
- N. Daems, X. Sheng, I. F. J. Vankelecom and P. P. Pescarmona, J. Mater. Chem. A, 2014, 2, 4085–4110 CAS.
- L. Roldán, S. Armenise, Y. Marco and E. García-Bordejé, Phys. Chem. Chem. Phys., 2012, 14, 3568–3575 RSC.
- I. Herrmann, U. I. Kramm, J. Radnik, S. Fiechter and P. Bogdanoff, J. Electrochem. Soc., 2009, 156, B1283–B1292 CrossRef CAS.
- Z. Lin, G. Waller, Y. Liu, M. Liu and C. P. Wong, Adv. Energy Mater., 2012, 2, 884–888 CrossRef CAS.
- Y. Wang, D. C. Alsmeyer and R. L. McCreery, Chem. Mater., 1990, 2, 557–563 CrossRef CAS.
- S. Quillard, G. Louarn, S. Lefrant and A. G. Macdiarmid, Phys. Rev. B: Condens. Matter, 1994, 50, 496–508 CrossRef.
- M. Trchová, P. Matějka, J. Brodinová, A. Kalendová, J. Prokeš and J. Stejskal, Polym. Degrad. Stab., 2006, 91, 114–121 CrossRef.
- R. Liu, D. Wu, X. Feng and K. Müllen, Angew. Chem., Int. Ed., 2010, 49, 2565–2569 CrossRef CAS PubMed.
- M. Salavati-Niasari, M. Shakouri-Arani and F. Davar, Microporous Mesoporous Mater., 2008, 116, 77–85 CrossRef CAS.
- X. Wang, Q. Xiang, B. Liu, L. Wang, T. Luo, D. Chen and G. Shen, Sci. Rep., 2013, 3, 1–8 CrossRef.
- A. E. Bocquet, T. Mizokawa, T. Saitoh, H. Namatame and A. Fujimori, Phys. Rev. B: Condens. Matter, 1992, 46, 3771–3784 CrossRef CAS.
- M. Lefèvre, J. P. Dodelet and P. Bertrand, J. Phys. Chem. B, 2002, 106, 8705–8713 CrossRef.
Footnotes |
| † Electronic supplementary information (ESI) available. See DOI: 10.1039/c5gc02197a |
| ‡ These authors contributed equally. |
| This journal is © The Royal Society of Chemistry 2016 |