
 Open Access Article
 This Open Access Article is licensed under a Creative Commons Attribution-Non Commercial 3.0 Unported Licence
From sugars to biodiesel using microalgae and yeast†
Jose A.
Gomez
,
Kai
Höffner
and
Paul I.
Barton
*
Process Systems Engineering Laboratory, Department of Chemical Engineering, Massachusetts Institute of Technology, 77 Mass. Ave., Cambridge, MA 02139, USA. E-mail: pib@mit.edu
First published on 10th September 2015
Abstract
The economic production of algal biofuels requires novel strategies, such as microbial consortia and synthetic ecologies, to boost the productivity of open pond systems. These strategies have not been fully explored partly due to the lack of reliable and predictive process models. This study uses genome-based metabolic networks to build a process model of a raceway pond. This process model is used as a discovery tool for novel process strategies. First, an algal monoculture with flue gas sparging is modeled. Then, an oleaginous yeast monoculture is modeled. The yeast monoculture is O2 limited and the presence of algae in the culture would result in better resource utilization. Next, an algal/fungal raceway pond with a feed of cellulosic glucose is explored. Finally, an oleaginous yeast that can consume a glucose/xylose mix, resulting from the hydrolysis of lignocellulosic waste, is modeled. This model predicts biomass and lipids productivities comparable to those reported in the literature. Assuming 50% yield loss due to contamination and invasion, a simple economic analysis shows that an algae/yeast coculture can produce biodiesel at competitive prices, $2.01 per liter for pure glucose and $1.44 per liter for the sugar mix, whereas the algae monoculture can do so only at very short distances from a flue gas source. This modeling framework will enable the use of optimization algorithms in the design of open pond systems in the near future and will allow the exploration of novel strategies in bioprocesses employing microbial communities.
1. Introduction
In March 2015, the United States pledged to cut its carbon emissions by 26–28% by 2025.1 This ambitious environmental objective is in line with the energy policy set in 2011 to guarantee the United States’ energy security and reduce greenhouse gases emissions. This energy policy includes specific actions such as reducing oil imports, increasing energy efficiency, and speeding up the development of biofuels.2Biofuels are fuels generated from biomass. First-generation biofuels are those obtained from food crops. The realization that these biofuels were little better than traditional fossil fuels regarding environmental impact combined with their competition for food resources prompted research on second-generation biofuels. Second generation biofuels are obtained from waste biomass.3 This type of biofuels represent a great opportunity because 349 million tons of sustainable waste biomass are produced in the United States per year,4 and most of this biomass is wasted. The most promising technologies for second-generation biofuels production are based on microbial conversion of biomass into lipids. Three types of microorganisms are used for microbial biomass production: bacteria, fungi (including higher fungi), and microalgae. Preferred characteristics of the microorganisms are high specific growth rate, high lipids to biomass yield, high cell density, ability to use complex substrates, affinity to substrate, and low nutrient requirements.5
Microalgae are attractive for biofuels production from sunlight energy because some strains naturally accumulate up to 50% dry weight in lipids.6 In addition, algae do not compete for food resources as they can be grown on wastewater and/or sea water,7 and they are up to one order of magnitude more efficient than higher-order terrestrial plants in capturing sunlight.6,8 In addition, algal biofuels have reduced CO2 emissions compared to fossil fuels, and can become carbon neutral if all energy inputs to the process are carbon neutral. Despite all these advantages, algal biofuels remain to be commercialized due to their high prices. For example, in 2013 the Department of Defense paid $150 per gallon for 1500 gallons of jet fuel when petroleum-based jet fuel was only $2.88 per gallon.9 Prices remain high because a low cost production method that obtains acceptable algal biomass and lipids yields remains to be found.
Oleaginous yeasts are also attractive for biofuels production as they can convert lignocellulosic sugars into lipids. Some examples of oleaginous yeast strains include Cryptococcus albidus, Lipomyces starkeyi, Rhodotorula glutinis, Trichosporon pullulans, and Yarrowia lipolytica which accumulate up to 65, 63, 72, 65, and 36% lipids, respectively.10,11
Algae and yeasts can be cultivated in open pond systems or closed photobioreactors. Closed photobioreactors have been used successfully to produce high-value specialty chemicals, but these systems incur high capital and operating costs.12 Therefore, they are not commercially viable to produce commodities such as fuels. On the other hand, open pond lipid yields are insufficient because monocultures are vulnerable to invasion and predation by other algae species, bacterial or fungal infection. Oleaginous yeasts that thrive under low pH and low temperature conditions have been successfully cultivated in open ponds,13 but most oleaginous yeasts are not extremophiles. In this case, culture resilience and stability are critical. Synthetic consortia can be designed to fill ecological niches which would otherwise be filled by invading species. Design of such synthetic consortia has been discussed in Kazamia et al.14 at a qualitative level, and a quantitative approach has been proposed in Höffner and Barton.5 In addition, algae in open pond cultures are carbon limited due to the low atmospheric CO2 concentration and yeasts can become O2 limited.15 The carbon limitation has restricted the locations where algal ponds can be economically feasible, because the use of CO2-rich flue gas is only possible in the vicinity of power plants.16 An alternative approach to cultivating monocultures of yeast and algae is to grow them together and benefit from their symbiotic interactions. Examples of this approach have been tested at lab scale.15,17–22 The introduction of yeast enables lignocellulosic sugars, which cannot be metabolized by most microalgae, to be digested and can increase algal biomass by transforming part of these carbon sources into CO2. At the same time, yeast can benefit from the O2 produced by microalgae and increase lipids production. In addition, both species together fill available ecological niches to protect against invasion.14 This alternative strategy promotes installing algal/fungal ponds near farms, where significant quantities of agricultural waste are generated, but no flue gas is available, and transform these wastes into lipids first, and then biodiesel.
This paper shows how an algal-fungal pond is able to attain higher biomass productivities than the respective monocultures. The substrates required for algae growth are minimal. For algal photoautotrophic growth, CO2 is the carbon source, energy is provided by sunlight, and small amounts of nitrogen, phosphorus and sulfur sources need to be provided. The quantity of the available substrate strongly determines the growth rate and intracellular accumulation of desired metabolic products such as lipids. For yeast, a carbon source, in this case glucose and xylose, and small amounts of nitrogen, phosphorus and sulfur are required. This case study shows that yeast provides additional CO2 to algae by metabolizing sugars and algae provides O2 to yeast. Furthermore, together yeast and algae use available resources more efficiently, which makes the invasion of other microorganisms less likely. This paper uses the modeling framework presented in Höffner and Barton,5 which is based on Dynamic Flux Balance Analysis (DFBA)23–26 and the High-Rate Algal-Bacterial pond model.27,28
2. Methods
Design of novel algal open pond systems requires process models, which provide quantitative predictions of interactions between process components across different scales. Multi-scale models, integrating genome-scale information in metabolic networks with the ecological scale of the interactions between multiple species and the process scale of bioreactors, have been proposed in Höffner and Barton.5 These complex models are based on multi-species dynamic flux balance analysis and can be used for the discovery of novel and improved microbial bioprocesses.2.1. Dynamic flux balance analysis
Flux balance analysis (FBA) is a genome-scale, constraint-based modeling approach. It is a widely successful framework for metabolic engineering and analysis of metabolic networks.24,26 Consequently, metabolic network models of many organisms have been developed.29 Based on genomic analysis, a metabolism can be modeled as a network of reactions, which must satisfy simple mass balance constraints. The network reconstruction determines the stoichiometry of the metabolism under the balanced growth assumption.26 However, this network is often underdetermined; the fluxes of the different substrates and metabolites can vary and yet still produce a solution which satisfies mass balance constraints. Thus, it is assumed that the fluxes will be such that some cellular objective is maximized. For example, an evolutionary argument can be made that a microorganism will maximize its growth rate if sufficient nutrients are provided.24Dynamic flux balance analysis (DFBA) combines genome-scale metabolic network analysis with a dynamic simulation of the extracellular environment.23,25 At this scale, process models of bioreactors incorporating detailed metabolic reconstructions can be considered. DFBA models have matched accurately experimental data for the cultivation of E. coli23,30 and the competition between Rhodoferax and Geobacter.31 In addition, DFBA has successfully modeled experimentally observed mutualistic relationships between D. vulgaris and M. maripaludis and between engineered yeast strains unable to grow on minimal glucose medium separately, and has been used to make fast predictions for combinations of microorganisms and media not yet validated experimentally.32 DFBA provides a platform for detailed design, control, and optimization of biochemical process technologies, such as an open pond. With DFBA, temporal and/or spatial variations in the behavior of the community within the bioreactor can be simulated. This formulation provides a more appropriate and predictive description of complex ecological systems, in which emergent nonlinear dynamic behavior is a common phenomenon. Furthermore, the mathematical formulation allows for unstructured models of ecological species, such as large zooplankton, for which a metabolic model is not available.
Simulation and optimization of large multi-species and multi-scale process models requires efficient numerical tools. A DFBA model results in a dynamic system with linear programs embedded.33,34 Numerical complications arise when simulating these systems; these have recently been addressed and efficient simulators have become available.33,35 Therefore, simulation of large-scale multi-species metabolic reconstructions is now possible. The simulations in this paper were performed using DFBAlab.35
2.2. High-rate algal pond model
The high-rate algal-bacterial pond model was first introduced and validated experimentally by Buhr and Miller27 and then extended by Yang.28 This model considers a coculture of bacteria and algae for high-rate wastewater treatment ponds. Their growth expressions are given by Monod type kinetics dependent on the concentration of carbon, oxygen, and nitrogen. In addition, they considered pond depth and biomass concentration effects on light penetration, the effect of ionic species on pH, and the effect of pH on dissolved CO2. In order to use Monod kinetic expressions, a limiting substrate must be readily identified, and accuracy is lost at transitions when several substrates may be limiting. In cocultures and non-steady state environments, predicting limiting substrates and active metabolic pathways can be a very challenging task, if possible. In this paper we incorporate genome-scale metabolic models into the high-rate algal-bacterial pond. When using dynamic flux balance analysis, no a priori predictions are needed because the linear programs modeling the behavior of each species predict the metabolic state given the extracellular conditions and identify the limiting substrates. Monod kinetics are used indirectly by bounding the consumption of substrates as in Hanly and Henson,30 but the actual consumption rate is calculated by the linear programs after identifying a limiting substrate.2.3. Raceway open ponds
A raceway pond is an open pond with flow and can be modelled as a plug flow reactor (PFR). In this paper, the spatial distribution of quantities in the raceway pond is approximated as a sequence of interconnected continuous stirred tank reactors (CSTRs). Each CSTR model includes the mass balances for the main metabolites and an estimate of the variation of the average light intensity during a 24 hour period. For each CSTR, it is assumed that the broth is well mixed such that there are no gradients in nutrients or biomass concentrations. Growth rates of algae and yeast, and uptake and production rates of metabolites are obtained from genome-scale metabolic network reconstructions.First a pond with an algae monoculture with no CO2 sparging is analyzed. Next, the productivity of this culture is boosted with CO2 sparging and a series of three ponds is considered. Next, a pond containing a monoculture of oleaginous yeast is considered and the advantages of an algae/yeast coculture are illustrated. Next, we model an algal/yeast coculture with no flue gas sparging in a three pond system. Finally, the case where the oleaginous yeast can also consume xylose is considered in another three pond system. The coculture examples illustrate the benefits of the symbiotic relationships between yeast and algae. The series of ponds is necessary to induce lipids production through nitrogen starvation,13 as observed experimentally by Rodolfi et al.36 and Breuer et al.37 Nitrogen starvation increases lipids productivity but reduces biomass productivity.37,38 A two phase cultivation system can achieve good biomass and lipids productivity.39 Therefore, the series of ponds allows biomass growth in the first pond and lipids accumulation in the latter ones. Ammonia is used as the single nitrogen source. Caustic soda is used to prevent the pond from becoming too acidic.
In this case study, the model for each pond was obtained from Yang.28 This model considers a 350![[thin space (1/6-em)]](https://www.rsc.org/images/entities/char_2009.gif) 000 L outdoor pond with a depth of 0.4 m. It is continuously harvested at a rate of 50000 L per day with a recycle rate of 350000 L h−1. A channel width of 1.2 m is assumed such that the flow velocity is 0.2 m s−1 to avoid sedimentation and thermal stratification, as suggested by Becker.40 The Reynolds number of this pond is of 250000; turbulent flow is desired to keep cells in suspension and prevent stratification.41 We discretized the spatial variations of the pond by modeling it as a sequence of nine CSTRs. For ponds connected in series, the effluent of one pond feeds into the next and the effluent of the last pond feeds into a clarifier, in which the water content is reduced and subsequently the remaining biomass is harvested and processed. The clarifier and other downstream processes are not included in the current model.
000 L outdoor pond with a depth of 0.4 m. It is continuously harvested at a rate of 50000 L per day with a recycle rate of 350000 L h−1. A channel width of 1.2 m is assumed such that the flow velocity is 0.2 m s−1 to avoid sedimentation and thermal stratification, as suggested by Becker.40 The Reynolds number of this pond is of 250000; turbulent flow is desired to keep cells in suspension and prevent stratification.41 We discretized the spatial variations of the pond by modeling it as a sequence of nine CSTRs. For ponds connected in series, the effluent of one pond feeds into the next and the effluent of the last pond feeds into a clarifier, in which the water content is reduced and subsequently the remaining biomass is harvested and processed. The clarifier and other downstream processes are not included in the current model.
The average light intensity is estimated based on the Beer–Lambert law:27,28
 | (1) |
| Ke(X(t)) = Ke1 + Ke2X(t), | (2) |


| Im(t) = min(Ia(t), I1(t)) |
Sparging of flue gas is modeled according to Yang.28 The model considers that flue gas is fed at atmospheric pressure into orifices with a diameter of 5 cm. covering the entire bottom of the pond with a concentration of 250 orifices per m2. Flue gas flowrates of 10, 40, 100, 500, and 2000 m3 h−1 were modeled. The flue gas composition of 13.6% CO2, 5% O2, and the rest N2 was obtained from Brown.45 Variations of the concentration of CO2 in the gas bubbles with respect to pond depth were considered.
2.4. Metabolic models
Chlamydomonas reinhardtii is used as a model organism for microalgae. The genome-scale metabolic network iRC1080 is an up-to-date metabolic reconstruction of C. reinhardtii.46 The reconstruction consists of 2191 fluxes and 1706 unique metabolites, and encompasses ten compartments including a detailed reconstruction of the lipid metabolism. The model includes photoautotrophic, heterotrophic and mixotrophic growth options and a detailed model of the light spectrum. The model prediction has been validated experimentally under different environmental conditions, such as nitrogen limited or light limited growth.46 The model includes the pathways necessary for the biosynthesis of unsaturated fatty acids, fatty acids, steroids, sphingolipids, glycerophospholipids, and glycerolipids, and it considers the pathways related to fatty acid elongation in the mitochondria. The model considers all individual metabolites in these pathways including backbone molecules, stereochemical numbering of acyl-chain positions, acyl-chain length, and cis–trans stereoisomerisms.46 More model details including a list of all metabolites and reactions can be found in the ESI of Chang et al.46 and more information in general on algal lipids synthesis in Harwood and Guschina.47 For this paper, 125 metabolites were classified as lipids and a lipid storage was implemented in the model. In addition, minor modifications were done to the metabolic network reconstruction to satisfy mass balances.The model for the yeast organism is based on a well-established model of Saccharomyces cerevisiae. The genome-scale network reconstruction of the S. cerevisiae metabolism iND750 has shown good agreement with experimental data.48 It considers 1061 unique metabolites in eight compartments and 1266 intracellular and exchange fluxes. Furthermore, the model correctly predicts ethanol production under anaerobic conditions. However, S. cerevisiae is not an oleaginous yeast. Examples of oleaginous yeasts include Cryptococcus albidus, Lipomyces starkeyi, Rhodotorula glutinis, Trichosporon pullulans, and Yarrowia lipolytica with lipid accumulations ranging from 36% to 72%.10,11 A description of the lipids profiles for different fungal species can be found in Ratledge.10 The iND750 model considers most pathways found in fungal species. It also considers the production of different lipids species such as glycerolipids, glycolipids, sphingolipids, phospholipids, and fatty acids. This metabolic reconstruction can be used to model different species by adjusting the biomass equation and adjusting the flux bounds on reactions feeding to different pathways. In this paper, we modified the iND750 model such that it cannot produce ethanol11 and under low oxygen conditions it can produce acetate, formate, succinate, and citrate, reflecting the behavior of Y. lipolytica.49 We also modified it further such that it consumed xylose reflecting the behavior of Rhodotorula glutinis.50 Therefore, the biomass equation was modified such that the yeast accumulates 40% lipids.
Both modified models are provided as ESI†. Fig. 1 presents a simplified version of both models. Yeast consumes glucose, xylose, O2, and nutrients to obtain biomass, CO2 and water. The metabolic reactions of glucose and xylose generate ATP with stoichiometry defined by the metabolic model. Xylose, glucose and nutrients are assimilated into biomass; these growth reactions have ATP requirements with coefficients determined by the metabolic model. Meanwhile, algae obtains ATP from light and converts CO2 and water into glucose and O2 through photosynthesis with some ATP requirement. This glucose can be transformed into starch for energy storage, consumed for ATP production, or assimilated with nutrients as biomass. Under nitrogen limitations, this glucose can be assimilated as lipids. In addition, the algae model considers a survival ATP requirement. The red and purple arrows show symbiotic opportunities. All ATP coefficients are determined by the metabolic model. Both models, iRC1080 and iND750, contain in full detail all the relevant metabolic pathways that achieve these main reactions. The full list of metabolites and reactions of iRC1080 and iND750 can be found in the ESI of Chang et al.46 and the ESI of Duarte et al.,48 respectively.
 | ||
| Fig. 1 Main reactions considered in the modified models iRC1080 and iND750. The stoichiometric coefficients of ATP production and consumption are determined by the metabolic models. The red and purple arrows illustrate symbiotic relationships: the red dashed arrow shows yeast utilizing O2 produced by algae, whereas the purple dotted and dashed arrow shows algae consuming CO2 produced by yeast. | ||
2.5. Kinetic parameters
The uptake kinetics for the exchange metabolites for both microorganisms are approximated by Michaelis–Menten kinetics: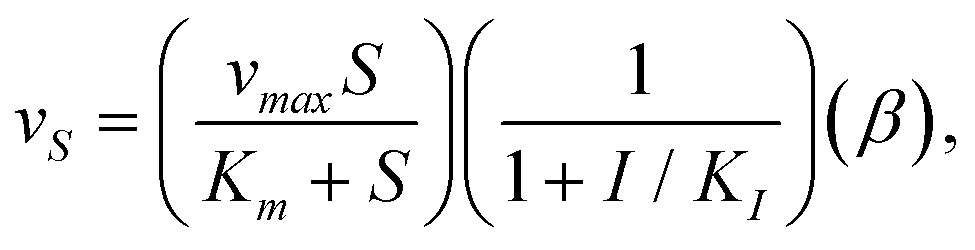 | (3) |
where α, K1, KOH−, and KH+ are constants. Algal pH dependent growth data under nitrogen and carbon limitations was obtained from Franco et al.54 and Kong et al.,55 whereas yeast parameters were adjusted such that it grew at pH levels between 2 and 9 with maximum growth rate at pH equal to 6. Table 2 presents the constants used for these simulations.

| Yeast | v max (mmol per gDW per h) | K m (mmol L−1) | K I (mmol L−1) | Ref. |
|---|---|---|---|---|
| Note: Ammonium uptake for yeast was approximated with that of fungus Lactarius rufus. The weight fraction of chlorophyll (22.8 mg per gDW) in algae was obtained from the biomass equation in the iRC1080 model. The yeast uptake of xylose was scaled from E. coli values. | ||||
| Glucose | 22.4 | 4.44 | EtOH: 217 | Hanly et al.30 |
| O2 | 2.5 | 0.003 | None | Hanly et al.30 |
| NH4+ | 25.5 | 35.4 × 10⁻³ | None | Jongbloed et al.56 |
| Xylose | 12.8 | 32.5 | EtOH: 217 | Hanly et al.30 |
| Glucose: 2.78 | ||||
| Algae | ||||
| CO2 | 1.25 | 0.03 | None | Tsuzuki et al.57 |
| O2 | 2.065 | 0.008 | None | Yang28 |
| HCO3− | 1.82 | 0.27 | None | Tsuzuki et al.57 |
| NH4+ | 0.65 | 3.84 × 10⁻⁴ | None | Hein et al.58 |
| NO3− | 0.251 | 1.1 × 10⁻³ | None | Galván et al.59 |
| Acetate | N.A | N.A | None | Zhang et al.51 |
| Algae | NH4+, NO3− | CO2, HCO3− | Acetate |
|---|---|---|---|
| α | 1.25 | 1.08 | 1 |
| K 1 | 1.19 | 1.07 | 1.18 |
| K OH − [mol L−1] | 3.51 × 10⁻¹⁰ | 9.26 × 10⁻¹¹ | 2.82 × 10⁻⁸ |
| K H + [mol L−1] | 3.19 × 10⁻⁷ | 5.9 × 10⁻⁶ | 6.66 × 10⁻⁸ |
| Yeast | Glucose/Xylose | ||
| α | 1 | ||
| K 1 | 0.97 | ||
| K OH − [mol L−1] | 2 × 10⁻⁸ | ||
| K H + [mol L−1] | 1 × 10⁻⁴ |
Finally, an expression was derived for algal starch production and consumption. Starch is the only source of energy for algae at night. It is assumed that starch production is dependent on light and carbon concentrations and that its consumption is dependent on intracellular starch concentration at night:
 | (4) |

 | (5) |
2.6. Solution equilibrium
The chemical equilibrium of the system is based on Buhr and Miller27 with parameters obtained from Robinson and Stokes60 at 20 °C. It is assumed that the ions present in the system are CO32−, H+, OH−, HCO3−, NH4+, Na+, and the ions resulting from formic, acetic, succinic, and citric acids. Ammonia is assumed to dissolve completely. Therefore, a system of equations is obtained from the solution equilibria of ammonia, carbon dioxide, formic, acetic, succinic, and citric acids and water, the mass balances of ammonia, carbon, acetate, formate, succinate, and citrate, and electroneutrality. From this system of equations, the concentrations of all ionic species are obtained.2.7. DFBAlab hierarchy of objectives
Since the flux distribution associated with maximal growth is not necessarily unique, hierarchical optimization is used to determine unique exchange fluxes among the optimal flux distributions. DFBAlab requires the user to provide a hierarchy of objectives for efficient integration of the dynamic system.35Table 3 presents the objectives used for algae and yeast.| Yeast | Algae | |
|---|---|---|
| 1 | Maximize growth | Maximize autotrophic growth |
| 2 | Maximize CO2 production | Maximize lipids production |
| 3 | Maximize glucose consumption | Maximize starch production |
| 4 | Maximize xylose consumption | Maximize consumption and minimize production of CO2 |
| 5 | Maximize O2 consumption | Maximize ammonium consumption |
| 6 | Maximize ammonium consumption | Maximize HCO3− consumption |
| 7 | Minimize acetate production | Maximize consumption and minimize production of O2 |
| 8 | Minimize formate production | Minimize formate production |
| 9 | Minimize citrate production | Minimize ethanol production |
| 10 | Minimize succinate production | Minimize acetate production |
| 11 | Minimize hydrogen production |
3. Results and discussion
In this section, some quantities are reported per m2 of illuminated area. This is a common normalization quantity that allows performance comparison with algal production processes reported in the literature.3.1. Algae monoculture without CO2 sparging
First an algae monoculture with no CO2 sparging is simulated. It is supplemented with 146 mg per (m2 × day) of ammonia. This amount of nitrogen is enough for the pond to be carbon limited. Fig. 2 presents a schematic of the simulation. The 350000 L raceway pond is approximated by nine CSTRs of equal volume.
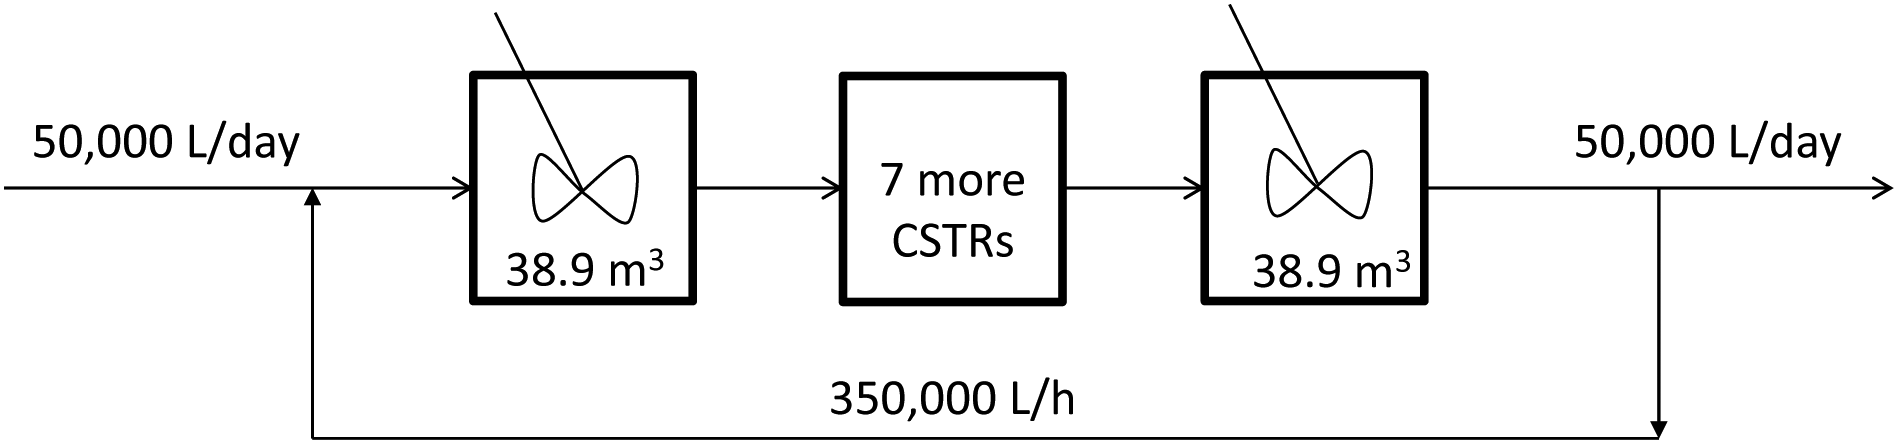 | ||
| Fig. 2 Schematic of the raceway pond model. The 350 m3 pond is approximated by nine CSTRs. There is a constant feed and outlet of 50 m3 per day and a recirculation of 350 m3 h−1. | ||
The results of this simulation show that all sections of the pond have very similar concentration profiles. This is a consequence of having a recycle rate 168 times greater than the dilution rate. In fact, a plug flow reactor with a very high recycle rate can be approximated by a single CSTR. Therefore, we modeled the pond as a single CSTR and compared the results with the approximation of nine CSTRs. The predicted outflow concentration profiles of both approximations are very similar. Therefore, all ponds in the following case studies are modeled as single CSTRs.
Fig. 3 shows the predicted concentration profiles in the pond at cyclic steady state. It can be seen that the predicted biomass productivity is less than 1 g per (m2 × day). The cyclic nature of the steady state can be observed in the concentration profiles of O2 and CO2 as well as in the pH of the pond. During the day, algae produces O2 and consumes CO2 which increases the pH due to the depletion of carbonic acid; the opposite behavior takes place at night. Due to the low predicted productivity of an algae monoculture without additional CO2 supply, this system is not explored any further. The next case study is that of an algae monoculture with sparging of flue gas.
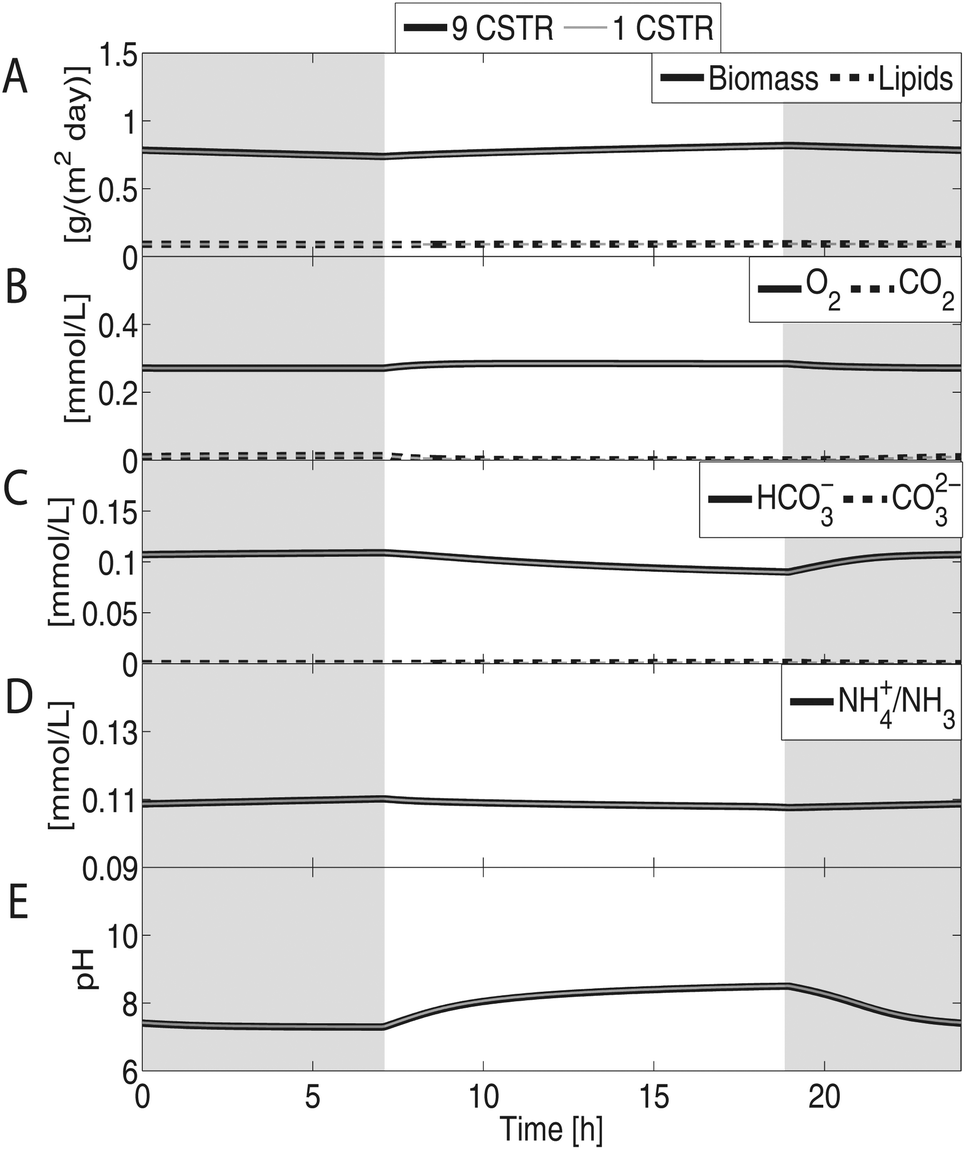 | ||
| Fig. 3 Concentration profiles of an algae monoculture pond with no CO2 sparging. Shaded areas represent dark periods. Notice that the results are the same for a simulation discretizing the length dimension of the pond as nine CSTRs and one modeling the pond as a single CSTR. (A) Predicted biomass and lipids productivity is approximately 0.78 and 0.09 g per (m2 × day), respectively. (B) The photosynthetic activity of algae slightly increases O2 and reduces CO2 concentrations during the day. The opposite behavior occurs at night. (C) A small amount of HCO3− is metabolized by the monoculture. (D) Nitrogen sources are consumed faster during growth periods, causing their concentrations to drop during the day. The pond is not nitrogen limited. (E) pH increases during the day as the concentration of CO2 drops and decreases at night as CO2 is accumulated again. The pH stays between 7 and 9. | ||
3.2. Algae monoculture with CO2 sparging
A schematic of the cultivation system can be observed in Fig. 4. With flue gas sparging (13.6% CO2, 5% O2, and the rest N2), biomass productivity increases greatly as more CO2 is supplied into the system. Flue gas was fed into a three pond system for 10 hours during the day at a sparging rate of 40 m3 h−1. A total of 1.04 and 0.15 g per (m2 × day) of ammonia and sodium hydroxide, respectively, are fed into the system. Fig. 4 shows how these feeds are distributed among the three ponds. With this feed distribution, the last pond is nitrogen starved, and lipids production is induced. | ||
| Fig. 4 Schematic of the algal biomass cultivation system using three raceway ponds. Each pond can be modeled as a CSTR with a volume of 350 m3. There is a constant feed and outlet of 50 m3 per day for each pond. The last two ponds present nitrogen limitations inducing lipids production. Sodium hydroxide is fed at a constant rate all day long, whereas ammonia is fed from 8:00 to 18:00. Flue gas sparging occurs only from 8:00 to 18:00. | ||
Fig. 5 shows that this cultivation scheme can attain biomass and lipids productivities of 34.4 and 16.2 g per (m2 × day), respectively, which is in line with the 20–40 g per (m2 × day) observed in several raceway ponds in the last decade as reported by Fig. 20 in Williams and Laurens.38 The level of accumulation of biomass is highly dependent on the feed rate of flue gas, for low feed rates, and the concentration of CO2 in this gas. The accumulation of biomass is most likely an upper bound on what can be obtained realistically as the effects of invading species or of toxic components in low concentrations in the flue gas have not been included.
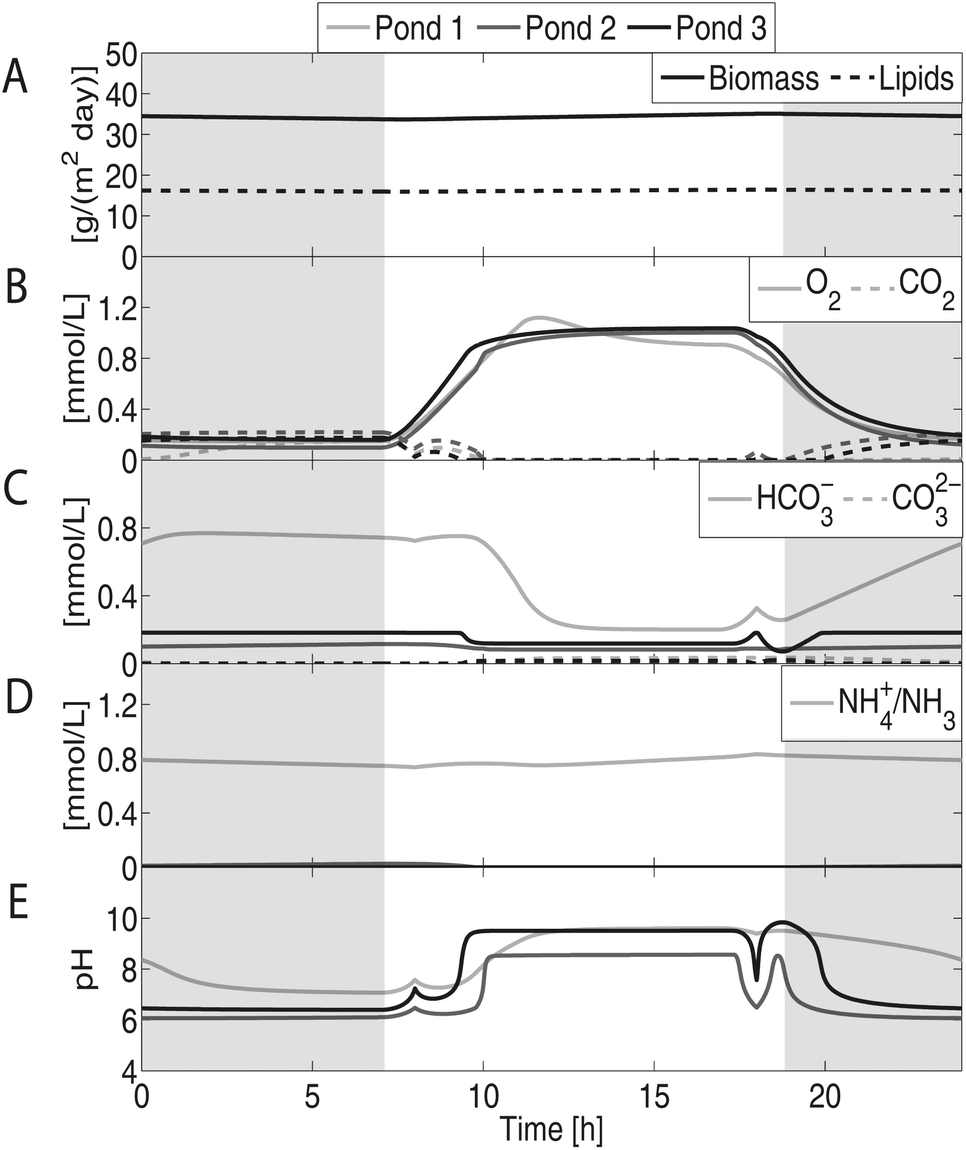 | ||
| Fig. 5 Concentration profiles of an algae cultivation system using three raceway ponds with flue gas sparging. Shaded areas represent dark periods. (A) Predicted biomass and lipids productivities are approximately 34.4 and 16.2 g per (m2 × day), respectively. (B) Due to algae's photosynthetic activity, O2 concentration increases during the day and decreases during the night, whereas CO2 concentration decreases during the day and increases during the night. (C) HCO3− concentration is highly related to pH. (D) The concentration of nitrogen drops as we move from pond 1 to pond 3. Pond 3 is effectively nitrogen starved inducing lipids production. (E) The pH of the system ranges from 6 to 10. For pond 1, pH is mostly influenced by the concentration of NH4+, whereas for ponds 2 and 3, it is mostly influenced by the concentration of CO2. | ||
Fig. 6 shows how biomass and lipids concentrations increase at each pond. Due to nitrogen starvation, the last pond accumulates a higher weight fraction of lipids. In addition, biomass accumulation is slower as lipid fraction increases, as reported by Williams and Laurens.38 The carbon atom balance is presented in Table 4; most of the carbon in the flue gas is fixed into algal biomass.
 | ||
| Fig. 6 Biomass and lipids concentrations in an algae cultivation system using three raceway ponds with flue gas sparging. The numbers on top of the lipids bars represent the weight fraction of lipids in algal biomass. As a consequence of nitrogen limitations in the last two ponds, the model predicts significant lipids accumulation (up to ≈47% weight). | ||
| Flue gas feed rate (m3 h−1) | 10 | 40 | 100 | 500 | 2000 |
|---|---|---|---|---|---|
| Algal biomass | 76.9% | 56.5% | 32.1% | 6.9% | 1.7% |
| Not transferred from flue gas | 16.3% | 31.2% | 54.0% | 83.8% | 93.9% |
| Net loss to atmosphere | 6.3% | 12.2% | 13.8% | 9.2% | 4.4% |
| Dissolved inorganic carbon lost in outlet flow | 0.5% | 0.2% | 0.1% | 0.1% | ≈0% |
| Formate production | ≈0% | ≈0% | ≈0% | ≈0% | ≈0% |
| Biomass g per (m2 × day) | 11.7 | 34.4 | 48.8 | 52.1 | 52.1 |
| Lipids g per (m2 × day) | 5.5 | 16.2 | 22.9 | 25.0 | 24.9 |
Increasing the flue gas flowrate increases biomass concentration until the culture becomes light-limited. Considering a theoretical limit in sunlight capture by algae of 10%,38 an average sunlight energy of 6.3 × 10⁶ kJ per (m2 × year),61 and an average algal biomass calorific value of 24.7 kJ g−1,38 the maximum possible yield of algae would be approximately 70 g per (m2 × day). Table 4 shows the results when the feed rate is increased from 40 to 100, 500, and 2000 m3 h−1, respectively. The maximum biomass productivity predicted by the model is about 52 g per (m2 × day). As the flue gas feed rate is increased, more carbon is lost to the atmosphere. Therefore, for this to be a viable carbon capture alternative, sparging rates should not be increased beyond the point where more than half of the carbon is lost to the atmosphere.
This kind of cultivation system can only be considered in locations able to supply considerable amounts of flue gas, for example, near power plants. Otherwise, algae growth is carbon limited and very low productivities can be predicted as illustrated by the example in section 3.1. A different strategy to deal with this carbon limitation is to feed cellulosic glucose and/or xylose into a pond cultivating an oleaginous yeast. Next, we explore the productivity of an oleaginous yeast monoculture growing on glucose and we illustrate the advantages of having a yeast/algae coculture.
3.3. Oleaginous yeast growing on glucose
Oleaginous yeasts, such as Yarrowia lipolytica or Rhodotorula glutinis, can be cultivated as a monoculture growing on glucose.13 However, the maximum concentration of biomass is limited by the mass transfer rate of O2 from the atmosphere. For an open pond with the same characteristics as the previous examples, DFBAlab predicts a maximum concentration of yeast of 1.82 g L−1. However, significant amounts of acetate are produced. The presence of acetate indicates a shortage of O2 in the system. The maximum biomass concentration attained with no production of acetate is 1.57 g L−1. Given the higher efficiency on the utilization of glucose when the yeast is cultivated with sufficient O2, the inputs of all further simulations were tailored such that no acetate was produced.As discussed earlier and illustrated in Fig. 1, the O2 limitation in yeast and the CO2 limitation in algae create a great opportunity. If both species are cultivated together, the yeast can benefit from the O2 produced by the algae and the algae can benefit from the CO2 produced by the yeast. As a proof of concept, let us assume that both species are cultivated together with a constant source of sunlight of 3.6 moles of photons per (m2 × h) corresponding to 6.8 × 10⁶ kJ per (m2 × year).28 A total biomass loading of 2.54 g L−1 can be attained. A summary of these cases is presented in Table 5. It is clear that the coculture presents advantages in resource utilization and total biomass productivity with respect to the monocultures. Next, we explore the behavior of an algal/yeast coculture feeding pure glucose and a mix of glucose and xylose into a raceway pond.
| Monoculture 1 | Monoculture 2 | Coculture | |
|---|---|---|---|
| Inputs [g per (m 2 × day)] | |||
| Glucose | 200.6 | 300.9 | 195.4 |
| NH3 | 11.4 | 17.1 | 17.4 |
| NaOH | 0 | 34.3 | 0 |
| Outputs [g per (m 2 × day)] | |||
| Yeast | 89.6 | 104.1 | 87.3 |
| Algae | 0 | 0 | 57.7 |
| Total biomass | 89.6 | 104.1 | 145 |
| Acetate | 0 | 73.3 | 0 |
| Carbon balance outputs | |||
| Yeast | 62.8% | 48.6% | 59.6% |
| Algae | 0% | 0% | 35.6% |
| Acetate | 0% | 24.8% | 0% |
| CO2 lost to atmosphere | 36.7% | 26.0% | 4.6% |
| Lost in flow | 0.5% | 0.6% | 0.2% |
3.4. Algae/yeast coculture with cellulosic glucose feed
Fig. 7 presents a schematic of the cultivation system. Cellulosic glucose is metabolized by yeast and converted to CO2 which is then fixed by algae. A total of 94.4, 3.1, and 0.03 g per (m2 × day) of glucose, ammonia, and sodium hydroxide, respectively, are fed in the system. Fig. 7 shows how these feeds are distributed among the three ponds; the last pond is nitrogen starved, and lipids production is induced. | ||
| Fig. 7 Schematic of the algal biomass cultivation system using three raceway ponds. Each pond can be modeled as a CSTR with a volume of 350 m3. There is a constant feed and outlet of 50 m3 per day for each pond. Sodium hydroxide is fed at a constant rate all 24 hours a day, whereas glucose and ammonia are fed only during daytime (12 hours). | ||
Fig. 8 shows that this cultivation scheme can attain yeast, algae, and lipids productivities of 34.5, 26.2, and 22.6 g per (m2 × day), respectively. Yeast and algae accumulate lipids up to approximately 40% and 33% dry weight, respectively. In the coculture case resources are better utilized, making invasion more difficult.14Fig. 9 shows algae, yeast and lipids concentrations in each pond. Due to nitrogen limitations in the last two ponds, lipids are accumulated. Table 6 presents the carbon balance for this case; approximately 84.7% of carbon in glucose ends in biomass.
 | ||
| Fig. 8 Concentration profiles of an algae/yeast cultivation system using three raceway ponds with cellulosic glucose. Shaded areas represent dark periods. (A) Predicted yeast, algae, and lipids productivities are approximately 34.5, 26.2, and 22.6 g per (m2 × day), respectively. (B) Due to algae's photosynthetic activity, O2 concentration increases during the day and decreases during the night, whereas CO2 concentration decreases during the day and increases during the night. (C) HCO3− and CO32− concentrations remain low. (D) The concentration of nitrogen drops as we move from Pond 1 to Pond 3. Ponds 2 and 3 have nitrogen limitations inducing lipids production. (E) The pH of the system ranges between 5 and 7. | ||
 | ||
| Fig. 9 Yeast, algae and lipids concentrations in a cultivation system using three raceway ponds with pure glucose feed. The numbers on top of the Lipids bars represent the weight fraction of lipids in total biomass. The last two ponds are nitrogen limited; therefore, the model predicts significant lipids accumulation (up to ≈37.1% weight). Yeast grows slower in the last two ponds due to nitrogen limitations and lower glucose feed rates. | ||
| Carbon inputs | Carbon outputs | ||
|---|---|---|---|
| Glucose | 100% | Yeast biomass | 51.4% |
| Algal biomass | 33.3% | ||
| Net loss to atmosphere | 15.2% | ||
| Inorganic carbon lost in flow | 0.08% | ||
| Glucose lost in flow | 0.02% | ||
3.5. Algae/yeast coculture with cellulosic glucose and xylose feeds
When cellulosic biomass is hydrolized, both glucose and xylose are obtained. Their ratio is dependent on the source of the lignocellulosic waste. A 2 to 1 glucose to xylose ratio by weight is typical.30 A process that can utilize both, glucose and xylose, is desirable because the sugar mix is cheaper than pure glucose. Some oleaginous yeasts, for example, Rhodotorula glutinis, are able to metabolize xylose.50 Therefore, we simulated the case where yeast can metabolize both glucose and xylose.Fig. 10 presents a schematic of the cultivation system. Cellulosic glucose and xylose are metabolized by yeast and converted to CO2 which is then fixed by algae. A total of 62.9, 31.5, 2.8, and 0.03 g per (m2 × day) of glucose, xylose, ammonia, and sodium hydroxide, respectively, are fed into the system. Fig. 10 shows how these feeds are distributed among the three ponds; the last pond is nitrogen starved, and lipids production is induced.
 | ||
| Fig. 10 Schematic of the algal biomass cultivation system using three raceway ponds. Each pond can be modeled as a CSTR with a volume of 350 m3. There is a constant feed and outlet of 50 m3 per day for each pond. Sodium hydroxide is fed at a constant rate all 24 hours a day, whereas glucose, xylose and ammonia are fed only during daytime (12 hours). | ||
Fig. 11 shows that this cultivation scheme can attain yeast, algae, and lipids productivities of 30.2, 27.4 and 22.9 g per (m2 × day), respectively. Yeast and algae accumulate lipids up to approximately 40% and 39% dry weight, respectively. Fig. 12 shows algae, yeast and lipids concentrations in each pond. Due to nitrogen limitations in the last two ponds, lipids are accumulated. Table 7 presents the carbon balance for this case; approximately 80.6% of the carbon in glucose and xylose ends in biomass.
 | ||
| Fig. 11 Concentration profiles of an algae/yeast cultivation system using three raceway ponds and glucose and xylose feeds. Shaded areas represent dark periods. (A) Predicted yeast, algae, and lipids productivities are approximately 30.2, 27.4 and 22.9 g per (m2 × day), respectively. (B) Due to algae's photosynthetic activity, O2 concentration increases during the day and decreases during the night, whereas CO2 concentration decreases during the day and increases during the night. (C) HCO3− and CO32− concentrations remain low. (D) The concentration of nitrogen drops as we move from Pond 1 to Pond 3. Ponds 2 and 3 have severe nitrogen limitations inducing lipids production. (E) The pH of the system ranges between 5 and 7. | ||
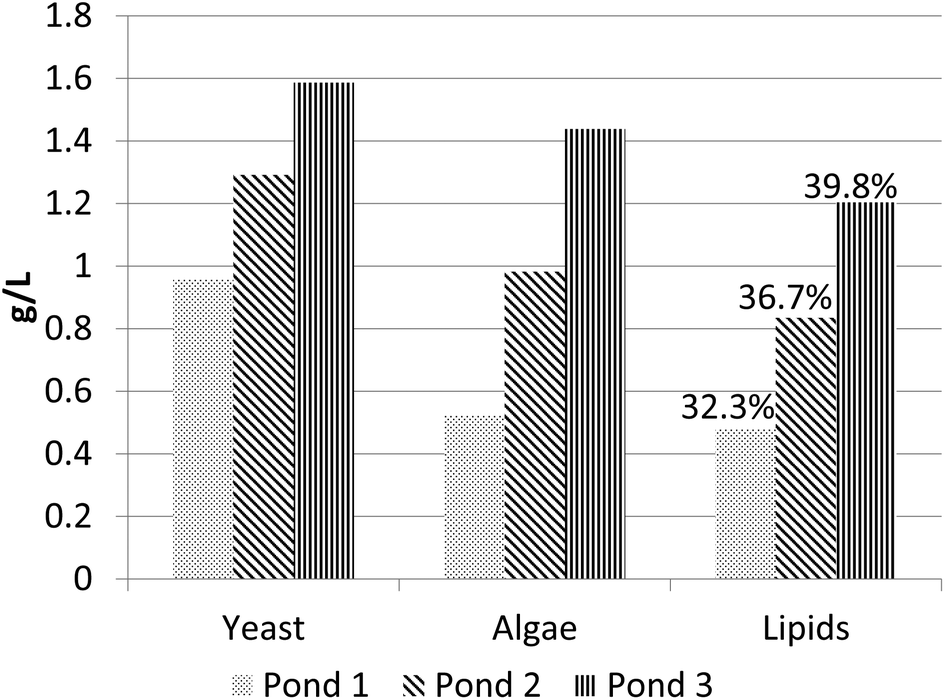 | ||
| Fig. 12 Yeast, algae and lipids concentrations in an algae/yeast cultivation system using three raceway ponds with glucose and xylose feeds. The numbers on top of the Lipids bars represent the weight fraction of lipids in total biomass. The last two ponds are nitrogen limited; therefore, the model predicts significant lipids accumulation (up to ≈39.8% weight). Yeast grows slower on the last two ponds due to nitrogen limitations and lower glucose and xylose feed rates. | ||
| Carbon inputs | Carbon outputs | ||
|---|---|---|---|
| Glucose | 66.7% | Yeast biomass | 45.0% |
| Xylose | 33.3% | Algal biomass | 35.7% |
| Net loss to atmosphere | 19.2% | ||
| Inorganic carbon lost in flow | 0.1% | ||
| Xylose lost in flow | 0.1% | ||
| Glucose lost in flow | 0.01% | ||
This kind of biomass cultivation system can be implemented at locations that generate large amounts of cellulosic waste, such as farms or forests. The area suitable for this scheme is much larger than the one offered by the scheme requiring flue gas in section 3.2.
3.6. Economic analysis
We now proceed to do a simple economic analysis based on Table 9 of Williams and Laurens.38 First we describe the assumptions for this economic analysis.500 per hectare in 1987. Using CPI indices, this translates to roughly $146000/hectare in 2015 dollars.
Each pond has a paddlewheel running for 24 hours. The power consumed by the paddlewheel can be calculated using the following equation:41
 | (6) |
 | (7) |
We estimated the capital costs of a centrifugal compressor with maximum capacity of 30000 kW using the correlations in Table 7.2 of Towler and Sinnott.64 We calculated the compressor capital costs considering a cultivation area of 900 hectares. We considered that the compressor was made of stainless steel due to the acids present in the flue gas, and used the factors in Tables 7.4 and 7.5 of Towler and Sinnott.64
:2 protein to carbohydrates is assumed.38
In the economic analysis of Williams and Laurens, protein is sold as animal feed at $0.9/kg.38 At this price, the income from protein exceeds the one obtained from biodiesel. If microalgal ponds are used for large-scale production of biodiesel, the market for animal feed will be flooded and the price of protein as animal feed will fall. Therefore, in this analysis we assumed all protein was digested anaerobically. This allows to recover nitrogen and phosphorus such that 60% of the nutrient inputs to the process are recycled.41
An open pond system is prone to contamination and invasion by other species. In fact, in some cases contamination can cause the desired algae strain concentration to fall by approximately 90% in a matter of days.70 Some strategies such as adding toxic chemicals or increasing salt concentration to kill potential invaders, constant feeding of the desired algal and yeast strains, and growing algae and yeast in coculture reduce this risk. To consider contamination and invasion risks, the final biodiesel yield was divided by two.
First, the economic analysis of the sparging alternative is presented. From Table 8 we notice that the monoculture is very competitive when it is very close to a source of flue gas, but its price increases rapidly with distance. High sparging rates are desirable because they attain higher concentrations of biomass, making the capital costs less burdensome. However, as distance from a flue gas source increases, higher sparging rates incur higher operating costs.
| Sparging rate (m3 h−1) | 10 | 40 | 100 | Units |
|---|---|---|---|---|
| Areal production | 11.7 | 34.4 | 48.8 | gDW per (m2 × d) |
| 42.7 | 125.6 | 178.1 | Tonne per (ha × yr) | |
| Lipid content | 47.4 | 47.1 | 46.9 | %DW |
| Lipid production | 20.2 | 59.1 | 83.6 | Tonne per (ha × yr) |
| Carbohydrate production | 9.0 | 26.6 | 37.8 | Tonne per (ha × yr) |
| Protein production | 13.5 | 39.9 | 56.7 | Tonne per (ha × yr) |
| Electricity AD | 34.8 | 103 | 146.5 | MWh per (ha × yr) |
| Capital costs | ||||
| Raceway pond | 146 | 146 | 146 | $1000 per ha |
| Non-pond site preparation | 5 | 5 | 5 | $1000 per ha |
| Engineering | 22 | 22 | 22 | $1000 per ha |
| Harvest | 3.6 | 3.6 | 3.6 | $1000 per ha |
| Extraction | 4.6 | 4.6 | 4.6 | $1000 per ha |
| Anaerobic digester | 5.1 | 14.9 | 21.2 | $1000 per ha |
| Total capital costs | 186.2 | 196.1 | 202.4 | $1000 per ha |
| Power requirements | ||||
| Growth | 21.6 | 21.6 | 21.6 | MWh per (ha × yr) |
| Harvest | 38 | 38 | 38 | MWh per (ha × yr) |
| Dewatering | 1.5 | 1.5 | 1.5 | MWh per (ha × yr) |
| Electricity required | 26.3 | −41.8 | −85.4 | MWh per (ha × yr) |
| Running costs | ||||
| Labor | 4430 | 4430 | 4430 | $ per (ha × yr) |
| Electricity | 2640 | −4191 | −8557 | $ per (ha × yr) |
| Transesterification | ||||
| Power (natural gas) | 93.2 | 272 | 385 | $ per (ha × yr) |
| Methanol | 927 | 2710 | 3830 | $ per (ha × yr) |
| NaOH | 462 | 462 | 462 | $ per (ha × yr) |
| Water | 145 | 145 | 145 | $ per (ha × yr) |
| Ammonia | 69.6 | 207 | 295 | $ per (ha × yr) |
| DAP | 586.2 | 1740 | 2480 | $ per (ha × yr) |
| Anaerobic digester | 1744 | 5160 | 7350 | $ per (ha × yr) |
| Capital costs @ 10%/yr | 18.6 | 19.6 | 20.2 | $1000 per (ha × yr) |
| Total costs | 29.7 | 30.5 | 31.1 | $1000 per (ha × yr) |
| Biodiesel production ideal | 16.1 | 47.0 | 66.5 | kL per (ha × yr) |
| Biodiesel production real | 8.0 | 23.5 | 33.2 | kL per (ha × yr) |
| Biodiesel cost (0 km) | 3.70 | 1.30 | 0.93 | $ per L |
| Biodiesel cost (1 km) | 4.08 | 1.66 | 1.54 | $ per L |
| Biodiesel cost (3 km) | 4.36 | 1.98 | 2.09 | $ per L |
| Biodiesel cost (15 km) | 5.02 | 2.66 | 3.25 | $ per L |
| Biodiesel cost (63 km) | 5.68 | 3.34 | 4.41 | $ per L |
Next we present the results for a coculture growing on pure glucose, one growing on a mix of glucose and xylose, and a yeast monoculture growing on a mix of glucose and xylose (Table 9). The benefits of using a mix of sugars instead of pure glucose is evident as the $ per L decreases approximately ≈30% with respect to pure glucose. The yeast monoculture performs slightly better than the coculture, although the difference is probably within the accuracy of our cost estimates. There are several benefits of using a coculture with respect to a monoculture:
1. In a coculture, resources are better utilized making invasion more difficult. A coculture is more resilient than a monoculture.14
| Coculture | Coculture | Yeast | Units | |
|---|---|---|---|---|
| Glucose or mix | Glucose | Mix | Mix | |
| Yeast production | 34.5 | 30.2 | 86.9 | gDW per (m2 × d) |
| Algae production | 26.2 | 27.3 | 0 | gDW per (m2 × d) |
| Lipid production | 82.5 | 83.6 | 128.7 | Tonne per (ha × yr) |
| Carbohydrate production | 55.6 | 50.5 | 75.5 | Tonne per (ha × yr) |
| Protein production | 83.4 | 75.8 | 113.2 | Tonne per (ha × yr) |
| Electricity AD | 216 | 196 | 292 | MWh per (ha × yr) |
| Capital costs | ||||
| Raceway pond | 146 | 146 | 146 | $1000 per ha |
| Non-pond site preparation | 5 | 5 | 5 | $1000 per ha |
| Engineering | 22 | 22 | 22 | $1000 per ha |
| Harvest | 3.6 | 3.6 | 3.6 | $1000 per ha |
| Extraction | 4.6 | 4.6 | 4.6 | $1000 per ha |
| Anaerobic digester | 31.2 | 28.4 | 42.4 | $1000 per ha |
| Total capital costs | 212.4 | 209.6 | 223.6 | $1000 per ha |
| Power requirements | ||||
| Growth | 21.6 | 21.6 | 21.6 | MWh per (ha × yr) |
| Harvest | 38 | 38 | 38 | MWh per (ha × yr) |
| Dewatering | 1.5 | 1.5 | 1.5 | MWh per (ha × yr) |
| Electricity required | −154.4 | −134.6 | −231.3 | MWh per (ha × yr) |
| Running costs | ||||
| Labor | 4430 | 4430 | 4430 | $ per (ha × yr) |
| Electricity | −15400 |
−13500 |
−23200 |
$ per (ha × yr) |
| Transesterification | ||||
| Power (natural gas) | 380 | 385 | 593 | $ per (ha × yr) |
| Methanol | 3780 | 3830 | 5900 | $ per (ha × yr) |
| NaOH | 90.9 | 90.9 | 0 | $ per (ha × yr) |
| Water | 145 | 145 | 145 | $ per (ha × yr) |
| Ammonia | 1300 | 1150 | 2780 | $ per (ha × yr) |
| DAP | 2360 | 2190 | 1690 | $ per (ha × yr) |
| Sugars | 43400 |
24100 |
50400 |
$ per (ha × yr) |
| Anaerobic digester | 4320 | 3930 | 5870 | $ per (ha × yr) |
| Capital Costs @ 10%/yr | 21.2 | 21.0 | 22.4 | $1000 per (ha × yr) |
| Total costs | 65.8 | 47.6 | 70.8 | $1000 per (ha × yr) |
| Biodiesel production ideal | 65.6 | 66.5 | 102.4 | kL per (ha × yr) |
| Biodiesel production real | 32.8 | 33.2 | 51.2 | kL per (ha × yr) |
| Biodiesel cost | 2.01 | 1.44 | 1.39 | $ per L |
2. If CO2 generation is a concern, the coculture releases less CO2 to the atmosphere than a yeast monoculture as algae metabolizes CO2. In the monoculture 37% of the carbon in the sugars is released as CO2 compared to 19% in the coculture.
3. The coculture utilizes less raw materials. In mature commodity industries, raw materials costs represent approximately 70% of the total cost; therefore, reducing raw materials consumption is important.
Therefore, an algae/yeast coculture could be preferred over a yeast monoculture.
The anaerobic digester produces CO2. If algae ponds are located immediately next to the digester, minimal costs are incurred for compressing the flue gas. Then, the price per liter of biodiesel for a sparging rate of 100 m3 h−1 is of $0.93/L. A mixed setup can be conceived where most of the biodiesel is produced from a glucose/xylose mix and a few ponds produce biodiesel using flue gas from the anaerobic digester.
4. Conclusions
DFBA can be used to model accurately complex and novel biological scenarios, for example, a microbial consortia in an algal pond. Based on this modeling framework, the potential of producing biodiesel in raceway ponds from algae and oleaginous yeast was evaluated. Flue gas can be used to produce biodiesel at competitive prices only if the ponds are located very close to the flue gas source. Meanwhile, algae/yeast cocultures provide a method of producing biodiesel using cellulosic sugar. Our model predicts a cost of production of biodiesel of $2.01/L if pure glucose is used and $1.44/L if a mix of glucose and xylose is used instead.The results of this work suggest that algae/yeast cocultures for biodiesel production should be considered seriously. This alternative employs cellulosic sugars which are currently very cheap. In this analysis we considered that lipid-extracted biomass was utilized to produce electricity. Another option would be to treat it and make it digestible by the consortia, potentially reducing the operating costs of the consortia alternative. In addition, the results in this work are not systematically optimized. The optimization of this system requires the computation of generalized derivatives for non-smooth objective functions. The work in Khan et al.71 and Höffner et al.72 will enable the numerical optimization of these systems to become possible in the very near future. However, despite the lack of optimization, the results of the algae/yeast coculture growing on cellulosic sugars presented in this paper are promising. We suggest experimental groups implement the proposed microbial consortia strategy to increase culture resilience and expand the range of substrates that can be converted into biofuels.
References
- R. Harrabin, US makes climate pledge to UN, http://www.bbc.com/news/science-environment-32136006, 2015 Search PubMed.
- Blueprint for a Secure Energy Future, The White House report, 2011.
- R. Luque, Energy Environ. Sci., 2010, 3, 254–257 CAS.
- R. Agrawal and N. R. Singh, Annu. Rev. Chem. Biomol. Eng., 2010, 1, 343–364 CrossRef CAS PubMed.
- K. Höffner and P. I. Barton, Comput.-Aided Chem. Eng., 2014, 34, 65–74 Search PubMed.
- M. S. Wigmosta, A. M. Coleman, R. J. Skaggs, M. H. Huesemann and L. J. Lane, Water Resour. Res., 2011, 47, W00H04 CrossRef.
- A. Clarens and L. Colosi, Biofuels, 2010, 1, 805–808 CrossRef CAS.
- Y. Chisti, J. Biotechnol., 2013, 167, 201–214 CrossRef CAS PubMed.
- Alternative Jet Fuels: Federal Activities Support Development and Usage, but Long-term Commercial Viability Hinges on Market Factors, United States government accountability office report, 2014.
- C. Ratledge, Trends Biotechnol., 1993, 11, 278–284 CrossRef CAS PubMed.
- A. Beopoulos, J. Cescut, R. Haddouche, J.-L. Uribelarrea, C. Molina-Jouve and J.-M. Nicaud, Prog. Lipid Res., 2009, 48, 375–387 CrossRef CAS PubMed.
- L. Amer, B. Adhikari and J. Pellegrino, Bioresour. Technol., 2011, 102, 9350–9359 CrossRef CAS PubMed.
- F. Santamauro, F. M. Whiffin, R. J. Scott and C. J. Chuck, et al. , Biotechnol. Biofuels, 2014, 7, 34–43 CrossRef PubMed.
- E. Kazamia, D. C. Aldridge and A. G. Smith, J. Biotechnol., 2012, 162, 163–169 CrossRef CAS.
- B. Cheirsilp, W. Suwannarat and R. Niyomdecha, New Biotechnol., 2011, 28, 362–368 CrossRef CAS PubMed.
- C. M. Beal, L. N. Gerber, D. L. Sills, M. E. Huntley, S. C. Machesky, M. J. Walsh, J. W. Tester, I. Archibald, J. Granados and C. H. Greene, Algal Res., 2015, 10, 266–279 CrossRef.
- C. A. Santos and A. Reis, Appl. Microbiol. Biotechnol., 2014, 98, 5839–5846 CrossRef CAS PubMed.
- R. Reyna-Martínez, R. Gomez-Flores, U. J. López-Chuken, R. González-González, S. Fernández-Delgadillo and I. Balderas-Rentería, Appl. Biochem. Biotechnol., 2015, 175, 354–359 CrossRef PubMed.
- H.-W. Yen, P.-W. Chen and L.-J. Chen, Bioresour. Technol., 2015, 184, 148–152 CrossRef CAS PubMed.
- T. Papone, S. Kookkhunthod and R. Leesing, World Acad. Sci. Eng. Technol., 2012, 64, 1127–1131 Search PubMed.
- J. Ling, S. Nip, W. L. Cheok, R. A. de Toledo and H. Shim, Bioresour. Technol., 2014, 173, 132–139 Search PubMed.
- Z. Zhang, H. Ji, G. Gong, X. Zhang and T. Tan, Bioresour. Technol., 2014, 164, 93–99 CrossRef CAS PubMed.
- A. Varma and B. Ø. Palsson, Appl. Environ. Microbiol., 1994, 60, 3724–3731 CAS.
- J. D. Orth, I. Thiele and B. Ø. Palsson, Nat. Biotechnol., 2010, 28, 245–248 CrossRef CAS PubMed.
- R. Mahadevan, J. S. Edwards and F. J. Doyle, Biophys. J., 2002, 83, 1331–1340 CrossRef CAS PubMed.
- B. Ø. Palsson, Systems Biology: Properties of Reconstructed Networks, Cambridge University Press, New York, NY, 2006 Search PubMed.
- H. Buhr and S. Miller, Water Res., 1983, 17, 29–37 CrossRef CAS.
- A. Yang, Ind. Eng. Chem. Res., 2011, 50, 11181–11192 CrossRef CAS.
- J. Schellenberger, J. O. Park, T. M. Conrad and B. Ø. Palsson, BMC Bioinf., 2010, 11, 213 CrossRef PubMed.
- T. J. Hanly and M. A. Henson, Biotechnol. Biofuels, 2013, 6, 44 CrossRef CAS PubMed.
- K. Zhuang, M. Izallalen, P. Mouser, H. Richter, C. Risso, R. Mahadevan and D. R. Lovley, ISME J., 2011, 5, 305–316 CrossRef PubMed.
- N. Klitgord and D. Segrè, PLoS Comput. Biol., 2010, 6, e1001002 Search PubMed.
- K. Höffner, S. Harwood and P. Barton, Biotechnol. Bioeng., 2013, 110, 792–802 CrossRef PubMed.
- S. M. Harwood, K. Höffner and P. I. Barton, Numerische Mathematik, 2015, 1–31 Search PubMed.
- J. A. Gomez, K. Höffner and P. I. Barton, BMC Bioinf., 2014, 15, 409 CrossRef PubMed.
- L. Rodolfi, G. Chini Zittelli, N. Bassi, G. Padovani, N. Biondi, G. Bonini and M. R. Tredici, Biotechnol. Bioeng., 2009, 102, 100–112 CrossRef CAS PubMed.
- G. Breuer, P. P. Lamers, D. E. Martens, R. B. Draaisma and R. H. Wijffels, Bioresour. Technol., 2012, 124, 217–226 CrossRef CAS PubMed.
- P. J. Williams and L. M. Laurens, Energy Environ. Sci., 2010, 3, 554–590 CAS.
- L. Jiang, S. Luo, X. Fan, Z. Yang and R. Guo, Appl. Energy, 2011, 88, 3336–3341 CrossRef CAS.
- E. Becker, Microalgae: Biotechnology and Bioengineering, Cambridge Univ Press, 1994 Search PubMed.
- Y. Chisti, Microalgal Biotechnology: Potential and Production, ed. C. Posten and C. Walter, 2012 Search PubMed.
- J. D. Harper, Int. Rev. Cytol., 1999, 189, 131–176 Search PubMed.
- E. H. Harris, The Chlamydomonas sourcebook: introduction to Chlamydomonas and its laboratory use, Academic Press, 2009, vol. 1 Search PubMed.
- N. C. Boelee, H. Temmink, M. Janssen, C. J. Buisman and R. H. Wijffels, Water, 2012, 4, 460–473 CrossRef CAS.
- L. M. Brown, Energy Convers. Manage., 1996, 37, 1363–1367 CrossRef CAS.
- R. L. Chang, L. Ghamsari, A. Manichaikul, E. F. Hom, S. Balaji, W. Fu, Y. Shen, T. Hao, B. Ø. Palsson and K. Salehi-Ashtiani, et al. , Mol. Syst. Biol., 2011, 7, 518 CrossRef PubMed.
- J. L. Harwood and I. A. Guschina, Biochimie, 2009, 91, 679–684 CrossRef CAS PubMed.
- N. C. Duarte, M. J. Herrgård and B. Ø. Palsson, Genome Res., 2004, 14, 1298–1309 CrossRef CAS PubMed.
- S. Papanikolaou, A. Chatzifragkou, S. Fakas, M. Galiotou-Panayotou, M. Komaitis, J.-M. Nicaud and G. Aggelis, Eur. J. Lipid Sci. Technol., 2009, 111, 1221–1232 CrossRef CAS.
- G. Zhang, W. T. French, R. Hernandez, E. Alley and M. Paraschivescu, Biomass Bioenergy, 2011, 35, 734–740 CrossRef CAS.
- X.-W. Zhang, F. Chen and M. R. Johns, Process Biochem., 1999, 35, 385–389 CrossRef CAS.
- G. M. Walker, Yeast physiology and biotechnology, John Wiley & Sons, 1998 Search PubMed.
- I. Tang, M. R. Okos and S.-T. Yang, et al. , Biotechnol. Bioeng., 1989, 34, 1063–1074 CrossRef CAS PubMed.
- A. R. Franco, J. Cárdenas and E. Fernández, Mol. Gen. Genet., 1987, 206, 414–418 CrossRef CAS.
- Q.-X. Kong, L. Li, B. Martinez, P. Chen and R. Ruan, Appl. Biochem. Biotechnol., 2010, 160, 9–18 CrossRef CAS PubMed.
- R. Jongbloed, J. Clement and G. Borst-Pauwels, Physiol. Plant., 1991, 83, 427–432 CrossRef CAS.
- M. Tsuzuki, Z. Pflanzenphysiol. Bd., 1983, 110, 29–37 CrossRef CAS.
- M. Hein, M. F. Pedersen and K. Sand-Jensen, Mar. Ecol.: Prog. Ser., 1995, 118, 247–253 CrossRef.
- A. Galván, A. Quesada and E. Fernández, J. Biol. Chem., 1996, 271, 2088–2092 CrossRef.
- R. Robinson and R. Stokes, Electrolyte Solutions, Butterworths Scientific Publications, London, 1959 Search PubMed.
- R. Agrawal, N. R. Singh, F. H. Ribeiro and W. N. Delgass, Proc. Natl. Acad. Sci. U. S. A., 2007, 104, 4828–4833 CrossRef CAS PubMed.
- R. Turton, R. C. Bailie, W. B. Whiting and J. A. Shaeiwitz, Analysis, synthesis and design of chemical processes, Prentice Hall, 3rd edn, 2010 Search PubMed.
- W. L. McCabe, J. C. Smith and P. Harriott, Unit operations of chemical engineering, McGraw-Hill, New York, 7th edn, 2005 Search PubMed.
- G. Towler and R. K. Sinnott, Chemical engineering design: principles, practice and economics of plant and process design, Elsevier, 2012 Search PubMed.
- N. Arifeen, R. Wang, I. Kookos, C. Webb and A. A. Koutinas, Biotechnol. Prog., 2007, 23, 872–880 CrossRef CAS PubMed.
- M. F. Ruth and R. J. Wooley, 4th Annual Green Chemistry & Engineering Conference, 2000, p. 109.
- R. Davis, A. Aden and P. T. Pienkos, Appl. Energy, 2011, 88, 3524–3531 CrossRef.
- Indicative Chemical Prices A–Z, http://www.icis.com/chemicals/channel-info-chemicals-a-z/, 2008.
- Electric Power Monthly, http://www.eia.gov/electricity/monthly/epm_table_grapher.cfm?t=epmt_5_6_a, 2015.
- I. Rawat, R. R. Kumar, T. Mutanda and F. Bux, Appl. Energy, 2013, 103, 444–467 CrossRef CAS.
- K. A. Khan and P. I. Barton, Journal of Optimization Theory and Applications, 2014, 163, 355–386 CrossRef.
- K. Höffner, K. A. Khan and P. I. Barton, Automatica Search PubMed , Accepted.
Footnote |
| † Electronic supplementary information (ESI) available. See DOI: 10.1039/C5GC01843A |
| This journal is © The Royal Society of Chemistry 2016 |