 Open Access Article
Creative Commons Attribution 3.0 Unported Licence
Compounds from Caesalpinia sappan with anti-inflammatory properties in macrophages and chondrocytes
Monika
Mueller
*a,
Daniela
Weinmann
b,
Stefan
Toegel
b,
Wolfgang
Holzer
c,
Frank M.
Unger
a and
Helmut
Viernstein
a
aDepartment of Pharmaceutical Technology and Biopharmaceutics, University of Vienna, Althanstrasse 14, A-1090 Vienna, Austria. E-mail: monika.mueller@univie.ac.at; Fax: +43 (0)1 4277 9554; Tel: +43 (0)1 4277 55414
bKarl Chiari Lab for Orthopaedic Biology, Department of Orthopaedics, Medical University of Vienna, Währinger Gürtel 18-20, A-1090 Vienna, Austria
cDepartment of Pharmaceutical Chemistry – Division of Drug Synthesis, University of Vienna, Althanstrasse 14, A-1090 Vienna, Austria
First published on 8th March 2016
Abstract
The heartwood of Caesalpinia sappan is a traditional ingredient of food and beverages in South East Asia and has been used in traditional medicine as an analgesic and anti-inflammatory drug or to promote blood circulation. Scientific studies have confirmed different bioactivities associated with its use. Here, five fractions were isolated from the ethanolic extract of C. sappan heartwood, including episappanol (1), protosappanin C (2), brazilin (3), (iso-)protosappanin B (4) and sappanol (5) using high-performance liquid chromatography (HPLC). All compounds were tested for their anti-inflammatory effects in two different cell lines. Cytokine concentrations in the cell supernatant were determined using enzyme-linked immunosorbent assay (ELISA), and mRNA levels were measured using reverse-transcription quantitative polymerase chain reaction (RT-qPCR). In lipopolysaccharide-stimulated macrophages, all compounds significantly inhibited the secretion of the pro-inflammatory cytokines interleukin (IL-6) and tumor necrosis factor-alpha (TNF-α). Sappanol (5) increased the secretion of the anti-inflammatory IL-10. In IL-1β-stimulated chondrocytes, all fractions reduced the mRNA expression and the secretion of the pro-inflammatory cytokines IL-6 and TNF-α. The highest anti-inflammatory effect was found for brazilin (3) in both cell lines. Of note, this is the first study which shows the anti-inflammatory effect of sappanol and episappanol. This study provides evidence for the efficacy of the traditional use of C. sappan as an anti-inflammatory remedy. Given the high prevalence of inflammation-related pathologies including arthritis, and the urgent need to clinically intervene with these diseases, the anti-inflammatory activity of diverse compounds from C. sappan may be of interest for the development of complementary and alternative treatment strategies.
1. Introduction
The heartwood of Caesalpinia sappan L. (Leguminosae), a plant native to South East Asia and South India, has been used as a natural red dye, as a traditional ingredient of food and beverages and in traditional Chinese medicine as an analgesic and anti-inflammatory drug or to promote menstruation and blood circulation.1 Scientific studies have confirmed different bioactivities of this medicinal plant including vasorelaxation,2 anti-atherosclerotic,3 antioxidant,4 antibacterial,5 anti-inflammatory6 or anti-arthritic effects.7In addition to the major compound brazilin, several compounds have been isolated and identified including protosappanins, chalcones and homoisoflavones.8–10 Most studies have been published on the bioactivity of brazilin showing vasorelaxation in endothelial cells in vitro,2 hypoglycemic activity in diabetic mice,11 and antibacterial activity.12 More recently, it has been shown that brazilin reduces high glucose-induced vascular inflammation,13 and exhibits anti-thrombotic properties,14 anti-cancer activities as shown in liver, breast, lung and gingival cancer cells15 and anti-allergic activities in a murine asthma model.16
A limited number of studies have been conducted on other compounds from C. sappan. As such, protosappanin A, B and brazilein exhibited antioxidative activity.4,17 Brazilein, sappanchalcone, protosappanin C, D and E showed anti-inflammatory effects in lipopolysaccharide (LPS)-induced macrophages (J774.1) as indicated by a reduction of nitric oxide (NO) or prostaglandin E2 (PGE2) production.10,17 Sappanone A or protosappanin E inhibited IL-6 secretion in LPS-stimulated macrophages (RAW 264.7).18 Brazilein, protosappanin A, and sappanchalcone exerted inhibitory effects on a drug target for influenza treatment.19 Protosappanin A was found to be an immunosuppressive agent in heart-transplanted rats and exhibited anti-rejection activity.20
Inflammation plays a major role in a broad range of diseases including asthma, atherosclerosis, cancer, and arthritis. IL-1β stimulated chondrocytes serve as a joint inflammation model for arthritis. Previously, we have shown the anti-inflammatory activity of the ethanolic extract of C. sappan (CSE) in chondrocytes as indicated by the inhibited expression of the pro-inflammatory cytokines IL-1β and TNF-α and the inhibition of the synthesis of NO and COX-2 expression in primary chondrocytes.21 Furthermore, CSE inhibited IL-1β-induced overexpression of matrix metalloproteinases in human chondrocytes, and thus may attenuate the progression of osteoarthritis.22 Brazilin was suggested to be the major active compound of CSE, however, the contribution of other chemical entities to the suggested anti-arthritic activity of C. sappan is currently unknown. Furthermore, the anti-inflammatory effect of only a few compounds from C. sappan has been elucidated so far, while the effect of most compounds is still not clear. Additionally, the literature is not consistent on the biological activities of several of the isolated compounds.
The present study aimed to assess the anti-inflammatory activity of episappanol, protosappanin C, brazilin, (iso-)protosappanin B and sappanol isolated from CSE in macrophages and chondrocytes in vitro. Three cytokines indicating the inflammatory response were chosen, two cytokines which enhance inflammation (IL-6 and TNF-α) and one which counteracts inflammation (IL-10).
2. Materials and methods
2.1. Chemicals and reagents
Lipopolysaccharides from E. coli and thiazolyl blue tetrazolium bromide (MTT) were obtained from Sigma-Aldrich (St. Louis, MO, USA). Acetonitrile (HPLC grade) was purchased from Promochem (Wesel, Germany). Dulbecco's modified Eagle's medium (DMEM), foetal bovine serum (FBS), L-glutamine, gentamicin, penicillin and streptomycin were purchased from Life Technologies (Carlsbad, CA, USA). Fetal calf serum (FCS) was obtained from Biochrom (Cambridge, UK). 12-Well microplates were obtained from Iwaki (Asahi glass, Chiyoda, Japan). The kits for enzyme-linked immunosorbent assays (ELISA, Ready-SET-Go!) of mouse and human TNF-α, IL-6, and IL-10 were purchased from eBioscience (San Diego, CA, USA). All other chemicals were purchased from Sigma-Aldrich (St. Louis, MO, USA) and Merck (Darmstadt, Germany).2.2. Plant material and extraction
The heartwood of Caesalpinia sappan was collected in Chiang Mai province, Thailand in 2013, and identified by comparison with the voucher specimen (no. 87-1631) at the Herbarium Section, Faculty of Pharmacy, Chiang Mai University. Powdered heartwood was extracted with ethanol for 24 h under stirring and the resulting extract was filtered and concentrated under vacuum to yield a solid extract.2.3. Characterization of the extract
The extract was dissolved in 20% ethanol and characterized using HPLC with ultraviolet detection (HPLC-UV) on an UltiMate 3000 HPLC system (Thermo Fisher Scientific, Waltham, MA, USA) connected to a security guard cartridge followed by a Kinetex C-18 column (5 μm C18, 4.6 × 150 mm, Phenomenex, Torrance, CA, USA). The mobile phase consisted of solvent A (water–acetonitrile 95![[thin space (1/6-em)]](https://www.rsc.org/images/entities/char_2009.gif) :
:![[thin space (1/6-em)]](https://www.rsc.org/images/entities/char_2009.gif) 5, 0.1% trifluoroacetic acid, TFA in water) and solvent B (acetonitrile, 0.1% TFA). The gradient profile was as follows: from 0–5 min, 100% A; 5–30 min, from 0 to 17.5% B; 30–33 min from 17.5 to 50% B; 33–34 min, 50 to 100% B; 34–35 min, 100% B; 36–38 min, 100% A. A flow rate of 0.5 ml min−1 was used. The elution profile was recorded using a photodiode array detector PDA-100 (Dionex) set at 280 nm.
5, 0.1% trifluoroacetic acid, TFA in water) and solvent B (acetonitrile, 0.1% TFA). The gradient profile was as follows: from 0–5 min, 100% A; 5–30 min, from 0 to 17.5% B; 30–33 min from 17.5 to 50% B; 33–34 min, 50 to 100% B; 34–35 min, 100% B; 36–38 min, 100% A. A flow rate of 0.5 ml min−1 was used. The elution profile was recorded using a photodiode array detector PDA-100 (Dionex) set at 280 nm.
2.4. Preparative scale separation of the extract
The extract was separated using UltiMate 3000 HPLC system with a Hypersil Gold preparative guard column and HPLC column (5 μ C18, 21 × 250 mm, Thermo Scientific). The same gradient profile and eluents as for analytical HPLC were used with a flow rate of 20 ml min−1. Isolated fractions were lyophilized using a Heto Power Dry LL3000 freeze-dryer (Thermo Scientific).Due to the instability of fractions 1 and 5 under acidic conditions, the preparative separation of these fractions was performed using solvent A (5% acetonitrile in water) and solvent B (acetonitrile) without TFA, but with the same gradient as described before.
2.5. Identification of isolated fractions using NMR
NMR spectra were recorded from acetone-d6 solutions on a Bruker Avance III 400 instrument (Bruker, Germany) at 25 °C using a directly detecting BBFO probe (400 MHz for 1H, 100 MHz for 13C). The solvent (residual) signals served as an internal standard which were related to TMS with δ 2.05 ppm (1H) and δ 29.84 ppm (13C). The unambiguous assignment of NMR resonances was achieved by the combined application of standard NMR spectroscopic techniques such as APT, COSY, TOCSY, NOESY, gs-HSQC and gs-HMBC using standard Bruker software.2.6. Identification of the compounds by high resolution mass spectrometry (HR-MS)
HR-MS was performed using a MaXis ESI (electrospray ionization) Q-TOF (quadrupole time of flight) mass spectrometer (Bruker Daltonics, Bremen, Germany). All measurements were performed in positive mode, with a capillary voltage of 4500 V, nebulizer pressure of 0.4 bar, dry gas flow of 4 L min−1, dry temperature of 180 °C. The quadrupole ion energy was set at 4 eV and the collision cell energy at 6 eV and a mass range between 50 and 2500 m/z was screened. Data were analyzed using a Bruker Compass Data Analysis 4.0.2.7. Analysis of the anti-inflammatory activity in macrophages
The analysis of the anti-inflammatory activity in LPS-stimulated murine macrophages (RAW 264.7, American Type Culture Collection, ATCC-TIB-71) was performed as previously described by Mueller et al. (2010).23 In brief, cells were seeded at a density of 2 × 10⁶ cells per well in 12-well plates. After 24 h incubation at 37 °C, cells were pretreated with test substances for 3 h before LPS was added at a final concentration of 1 μg ml−1. After further 24 h of incubation, the medium was removed, centrifuged and stored at −20 °C prior to analysis by ELISA.The secretion of TNF-α, IL-6, and IL-10 in the cell supernatant was analyzed using ELISA kits according to the manufacturer's protocol. The optical density at 450 nm, corrected by the reference wavelength 570 nm, was measured using an Infinite M200 microplate reader (Tecan, Crailsheim, Germany).
The viability of the cells was tested using a MTT assay as previously described.23 If the viability was 25% below the control, a compound was considered cytotoxic. The ELISA results indicating the cytokine secretion were normalized to the MTT values to reduce any variation arising from the differences in the cell density. Cells treated with only LPS served as a positive control and the amount of secreted cytokines was defined as 100%. All the results from the tested compounds were then calculated as a percent of this value. Dexamethasone was used as the reference drug. The assay was performed in triplicate on separate days. The mean and standard deviation are presented in the figures.
Total RNA extraction was carried out using the NucleoSpin RNA II Kit (Macherey-Nagel, Dueren, Germany) according to the manufacturer's instructions. Each sample was run on the Agilent 2100 Bioanalyzer Nano LabChip (Santa Clara, CA, USA) for quality control and quantification of total RNA prior to reverse transcription into cDNA using the high capacity cDNA reverse transcription kit (Life Technologies). RNA integrity numbers were between 9.3 and 9.9.
SYBR-green-based RT-qPCR assays for IL6, TNFA and IL10 expression were used as previously described21,22 and with respect to the MIQE guidelines.24 The mRNA levels of the target genes were calculated as quantities relative to the untreated control group, considering both amplification efficiencies and normalization to succinate dehydrogenase complex, subunit A (SDHA). Details on primers are given in Table 1.
| Gene | Species | Accession number | Forward primer | Reverse primer | Efficiency (%) |
|---|---|---|---|---|---|
| IL6 | Human | NM_000600 | ATAGGACTGGAGATGTCTGAGG | AGGCAACTGGACCCGAAGG | 93.5 |
| SDHA | Human | NM_004168 | TGGGAACAAGAGGGCATCTG | CCACCACTGCATCAAATTCATG | 94.6 |
| TNFA | Human | NM_000594 | TCAGCAAGGACAGCAGAGG | CAGTATGTGAGAGGAAGAGAACC | 100 |
| IL6 | Mouse | NM_031168 | CTGTCTATACCACTTCAC | CATCATCGTTGTTCATAC | 90.6 |
| SDHA | Mouse | NM_023281 | CCAGGACTTAGAATTTGT | TTGACTGTTGATGAGAAT | 94.5 |
| TNFA | Mouse | NM_013693 | TTCTGTCTACTGAACTTC | CCATAGAACTGATGAGAG | 83.8 |
2.8. Analysis of the anti-inflammatory activity in chondrocytes
As an established in vitro model for human chondrocytes, SW1353 cells (ATCC-HTB-94) were cultured as previously described.22 In brief, cells were seeded at a density of 2 × 104 cm−2 in 6-well plates and cultured in DMEM containing 10% FCS and 100 μg per ml gentamicin at 37 °C.Prior to treatment, SW1353 cells were starved overnight in serum-free DMEM supplemented with gentamicin. Then, cells were pretreated for 1 h with the isolated fractions in serum-free medium followed by the addition of 10 ng per ml IL-1β and further incubation for 24 h. As a negative control, cells were left untreated, and as a positive control, cells were treated only with IL-1β. Afterwards, cell supernatants were collected, centrifuged and stored at −80 °C. All treatments were performed in duplicate and were repeated three times. ELISA assays were conducted according to the manufacturer's protocol (Ready-SET-Go! ELISA, eBioscience). SYBR-green-based RT-qPCR assays for IL6 and TNFA expression were conducted as described above (section 2.7). Details on primers are given in Table 1. Concomitantly, MTT assays were performed as indicated above (section 2.7) to determine cell viability.
2.9. Statistics
Statistics were performed using one way analysis of variance using Tukey's test comparing all study groups (95% confidence interval). P-Values <0.05 were considered as significant. The IC50 values were determined using Table Curve 2D (Systat Software, San Jose, CA, USA).3. Results
3.1. Separation of the plant extract
Five fractions were separated from CSE as shown in the chromatogram of the preparative separation (Fig. 1). After lyophilization, the fractions were dissolved in 20% ethanol and analyzed by analytical HPLC. Fractions 2, 3 and 4 showed single peak purity. Fractions 1 and 5 were not stable when isolated under acidic conditions and showed 2–3 peaks. We changed the solvent system for preparative HPLC to solvent A (5% acetonitrile in water) and solvent B (acetonitrile) and applied the same gradient as described in the Materials and methods section. Finally, fractions 1 and 5 were obtained with one peak purity.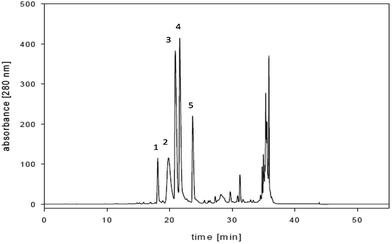 | ||
| Fig. 1 Chromatogram of the preparative HPLC used for separation of the 20% ethanolic extract of C. sappan. | ||
3.2. Identification of the compounds using NMR
The isolated compounds were identified as episappanol (1), protosappanin C (2), brazilin (3), a mixture of protosappanin B and isoprotosappanin B (4) and sappanol (5) using NMR. The structures are shown in Fig. 2.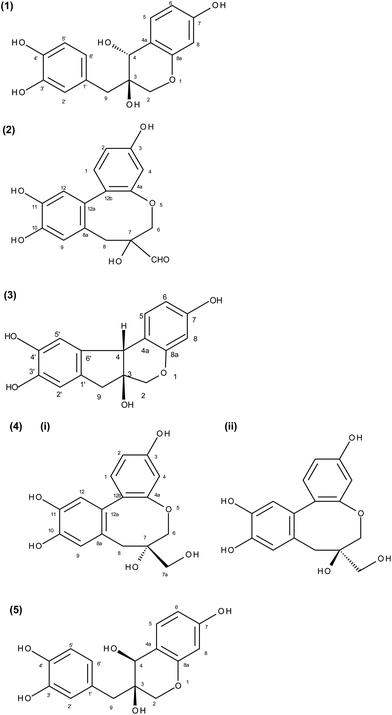 | ||
| Fig. 2 Structure of the five isolated fractions: (1) episappanol, (2) protosappanin C, (3) brazilin, (4) (i) protosappanin B, (ii) isoprotosappanin B and (5) sappanol. | ||
13 C-NMR (100 MHz, acetone-d6): δ 158.9 (C-7), 155.7 (C-8a), 145.2 (C-3′), 144.3 (C-4′), 132.2 (C-5), 129.0 (C-1′), 123.2 (C-6′), 119.0 (C-2′), 117.0 (C-4a), 115.5 (C-5′), 108.9 (C-6), 103.0 (C-8), 71.2 (C-3), 70.0 (C-4), 69.2 (C-2), 39.0 (C-9).
The 1H-NMR data are in agreement with Namikoshi et al. (1987).8
13
C-NMR (100 MHz, acetone-d6): δ 204.0 (7-![[C with combining low line]](https://www.rsc.org/images/entities/char_0043_0332.gif) HO), 158.9 (C-4a), 158.6 (C-3), 145.0 (C-10), 144.7 (C-11), 133.4 (C-1), 132.4 (C-12a), 125.3 (C-8a), 123.0 (C-12b), 119.9 (C-9), 117.2 (C-12), 111.5 (C-2), 108.0 (C-4), 75.1 (C-7), 74.4 (C-6), 37.1 (C-8).
HO), 158.9 (C-4a), 158.6 (C-3), 145.0 (C-10), 144.7 (C-11), 133.4 (C-1), 132.4 (C-12a), 125.3 (C-8a), 123.0 (C-12b), 119.9 (C-9), 117.2 (C-12), 111.5 (C-2), 108.0 (C-4), 75.1 (C-7), 74.4 (C-6), 37.1 (C-8).
13 C-NMR (100 MHz, acetone-d6): δ 157.6 (C-7), 155.5 (C-8a), 145.1 (C-3′), 144.8 (C-4′), 137.4 (C-6′), 132.0 (C-5), 131.5 (C-1′), 115.6 (C-4a), 112.6 (C-2′), 112.3 (C-5′), 109.6 (C-6), 103.9 (C-8), 77.7 (C-3), 70.8 (C-2), 51.1 (C-4), 42.9 (C-9).
The numbering of the brazilin ring system used here (Fig. 3C) is the one introduced by Fu et al. (2008).9 Fuke et al. and Kim et al. used a different numbering system.25,26
13 C-NMR (100 MHz, acetone-d6): δ 159.2 (C-4a), 158.7 (C-3), 144.4 (C-10 and C-11), 133.3 (C-1), 132.3 (C-12a), 127.3 (C-8a), 123.3 (C-12b), 119.6 (C-9), 117.2 (C-12), 111.0 (C-2), 108.0 (C-4), 75.8 (C-6), 72.1 (C-7), 67.9 (C-7a), 39.8 (C-8).
Minor isomer (protosappanin B): 1 H-NMR (400 MHz, acetone-d6): δ 7.00 (d, 1 H, 3J1,2 = 8.1 Hz, H-1), 6.85 (br s, 1 H, H-9), 6.71 (br s, 1 H, H-12), 6.62 (m, 1 H, H-2), 6.56 (m, 1 H, H-4), 4.35 (d, 1 H, 2J6,6′ = 11.7 Hz, H-6), 3.57 (m, 2 H, H-6′ and H-7a), 3.38 (d, 1 H, 2J7a′,7a = 10.9 Hz, H-7a′), 2.74 (A-part of an AB-system, 1 H, 2J8,8′ = 13.5 Hz, H-8), 2.67 (B-part of an AB-system, 1 H, 2J8′,8 = 13.5 Hz, 1 H, H-8′).
13 C-NMR (100 MHz, acetone-d6): δ 160.6 (C-4a), 158.7 (C-3), 144.4 (C-10 and C-11), 132.3 (C-1), 131.7 (C-12a), 128.3 (C-8a), 125.2 (C-12b), 118.9 (C-9), 117.4 (C-12), 111.7 (C-2), 108.8 (C-4), 77.2 (C-6), 72.6 (C-7), 65.6 (C-7a), 42.5 (C-8).
The 1H and 13C-NMR data are in agreement with Fu et al. (2008).9
13 C-NMR (100 MHz, acetone-d6): δ 159.3 (C-7), 155.6 (C-8a), 145.2 (C-3′), 144.5 (C-4′), 132.7 (C-5), 129.0 (C-1′), 122.9 (C-6′), 118.7 (C-2′), 116.4 (C-4a), 115.4 (C-5′), 109.4 (C-6), 103.1 (C-8), 70.2 (C-3), 69.4 (C-4), 67.8 (C-2), 40.7 (C-9).
The 1H-NMR data are in agreement with Namikoshi et al. (1987).8
3.3. Identification of the compounds using HR-MS
As shown in Table 2, the results of the HR-MS were consistent with the NMR data.| Fraction | Compound | [M + H] | MW [g] |
|---|---|---|---|
| 1 | Episappanol | 305.1020 | 304.0941 |
| 2 | Protosappanin C | 303.0863 | 302.0784 |
| 3 | Brazilin | 287.0914 | 286.0835 |
| 4 | Protosappanin B + isoprotosappanin B | 305.1020 | 304.0941 |
| 5 | Sappanol | 305.1020 | 304.0941 |
3.4. Anti-inflammatory activity in LPS-stimulated macrophages
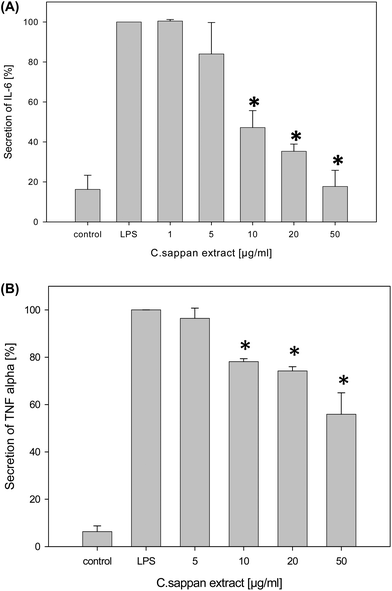
Brazilin (3) was significantly cytotoxic at a concentration of ≥20 μg ml−1 as determined by the MTT assay and could therefore only be analyzed at lower concentrations. The remaining fractions were not cytotoxic up to 100 μg ml−1 and tested up to this concentration. The entire extract was cytotoxic at a concentration of 100 μg ml−1, but not at a concentration of 50 μg ml−1 and thus it was only applied up to 50 μg ml−1 in subsequent bioactivity assays.The absolute level of IL-6 secretion was up to 5000 pg ml−1 for the positive control and up to 100 pg ml−1 for the negative control. The values for the TNF-α secretion were up to 2500 pg ml−1 for the positive control and up to 300 pg ml−1 for the negative control, respectively. CSE significantly exerted anti-inflammatory effects down to a concentration of 10 μg ml−1 as indicated by a reduction of the IL-6 and TNF-α secretion with an IC50 of 8 and 36 μg ml−1, respectively (Fig. 3). No significant effect on IL-10 was observed.
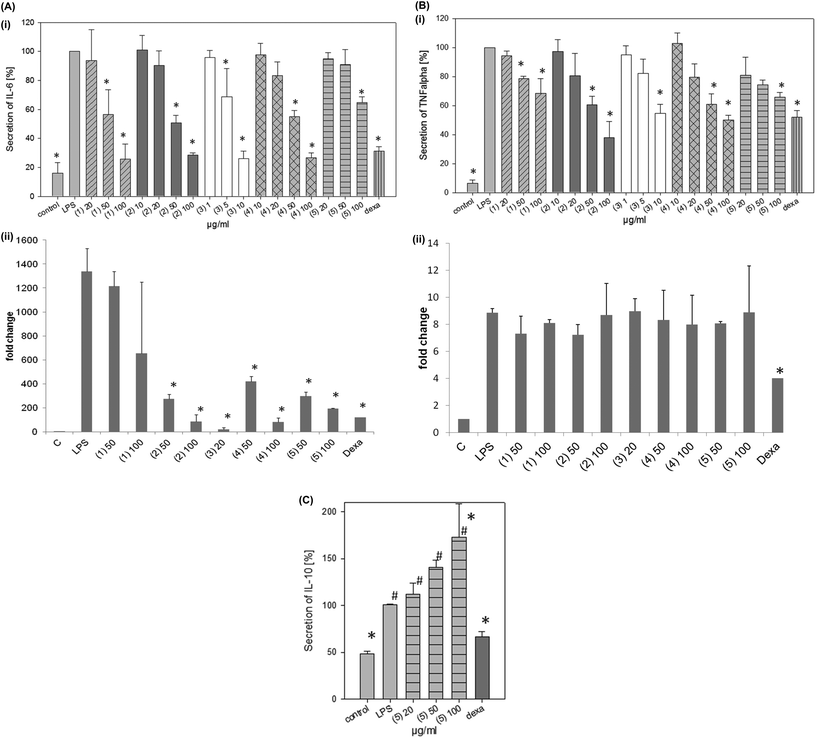
All the isolated fractions (1–5) induced a significant and dose-dependent change in the cytokine secretion profile as indicated by a decrease of the pro-inflammatory cytokines IL-6 (Fig. 4Ai) and TNF-α (Fig. 4Bi) (Table 3) at the cytokine level. At the mRNA level, the decrease of IL6 was significant whereas the decrease of TNFA was not significant (Fig. 4Aii and 4Bii). Fraction 5 increased the secretion of the anti-inflammatory IL-10 (Fig. 4C), whereas the other fractions had no significant effect on this cytokine. Brazilin (3) exerted the highest anti-inflammatory effect with a significant inhibition of the IL-6 secretion down to 5 μg ml−1 and a significant inhibition of the TNF-α secretion down to 10 μg ml−1. The IC50 values were 18 μM for IL-6 and 29 μM for TNF-α, respectively. Episappanol (1), protosappanin C (2), and (iso-)protosappanin B (4) significantly inhibited the IL-6 and TNF-α secretion at 50 μg ml−1. Sappanol (5) significantly reduced the IL-6 and TNF-α secretion at the highest concentration tested (100 μg ml−1). Besides brazilin, protosappanin C (2) and (iso-)protosappanin B (4) were the most effective fractions with IC50 values of 123 μM and 128 μM as indicated by IL-6 secretion (Table 3).
| Macrophages | Chondrocytes | |||
|---|---|---|---|---|
| Sample | IL-6 | TNF-α | IL-6 | TNF-α |
| 1 | 155 μM | >164 μM | >33 μM | 24 μM |
| 2 | 123 μM | 121 μM | 21 μM | 16 μM |
| 3 | 18 μM | 29 μM | 5 μM | 3 μM |
| 4 | 128 μM | >164 μM | >33 μM | 22 μM |
| 5 | >164 μM | >164 μM | >33 μM | >33 μM |
| CSE | 8 μg ml−1 | 36 μg ml−1 | >10 μg ml−1 | 1.6 μg ml−1 |
| Dexamethasone | 2 nM | 1 μM | 65 nM | 66 nM |
3.5. Anti-inflammatory activity in IL-1β-stimulated chondrocytes
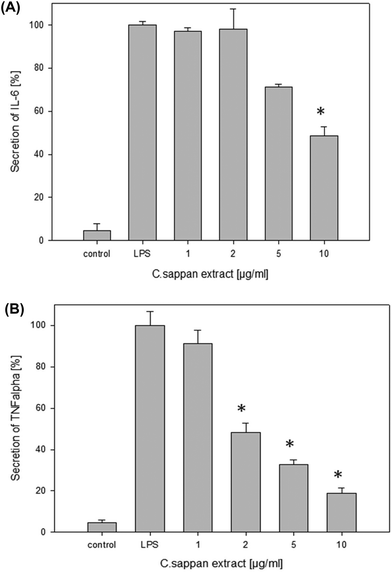
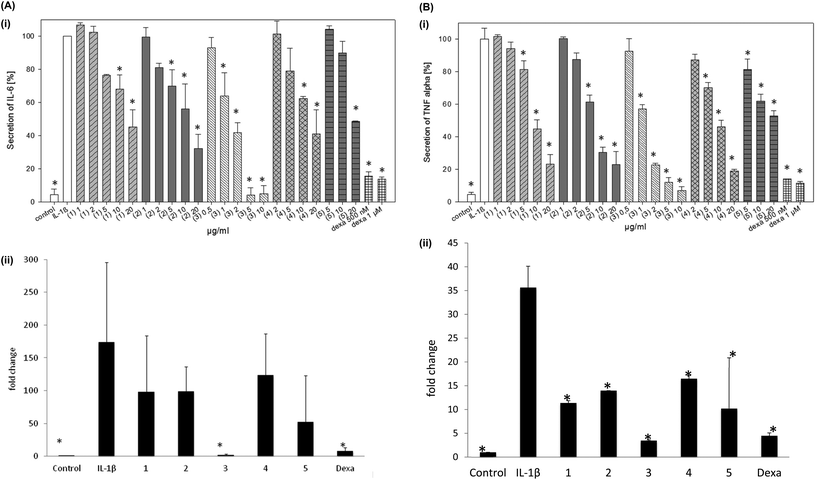
Based on the results of preceding MTT experiments (data not shown), brazilin and CSE were tested up to a concentration of 10 μg ml−1 and fractions 1, 2, 4 and 5 up to 20 μg ml−1 to avoid cytotoxic effects. The absolute level of IL-6 secretion was up to 110 pg ml−1 for the positive control and up to 10 pg ml−1 for the negative control. The values for the TNF-α secretion were up to 150 pg ml−1 for the positive control and up to 12 pg ml−1 for the negative control, respectively. CSE significantly inhibited the IL-6 secretion at 10 μg ml−1 and the TNF-α secretion at 2 μg ml−1 (Fig. 5). All the isolated fractions (1–5) significantly inhibited the IL-6 secretion in chondrocytes (Fig. 6A, Table 3). Brazilin (3) was most effective in this cell line also and significantly inhibited the IL-6 secretion at 5 μg ml−1 and an IC50 of 3 μM. Fractions 2 and 4 showed a significant effect on the IL-6 secretion at 10 μg ml−1 and fractions 1 and 5 at 20 μg ml−1. The IC50 values for IL-6 ranged between 5 μM for brazilin and >33 μM for sappanol (Table 3). IL-10 was not secreted by chondrocytes at detectable levels and was therefore not analyzed in this cell line.All the fractions (1–5) exerted a significant reduction of the TNF-α secretion at a concentration of 10 μg ml−1 or lower (Fig. 6B, Table 3). Brazilin (3) was effective at 1 μg ml−1 also. The IC50 values for TNF-α ranged between 3 μM for brazilin and >33 μM for sappanol (Table 3). These findings are in agreement with the qPCR results, showing that the fractions (1–5) significantly inhibited IL6 and TNFA mRNA expression levels at a concentration of 10 μg ml−1 (Fig. 6ii) with the highest effect observed for brazilin.
4. Discussion
The anti-inflammatory and anti-arthritic effects of the extract of C. sappan have been shown previously.6,21,22 However, the anti-inflammatory effect of several compounds from CSE has not been fully elucidated and the anti-arthritic effect of isolated compounds from C. sappan besides brazilin has not been previously shown.In this study, five fractions were isolated from the ethanolic (20%) extract of C. sappan, namely episappanol (1), protosappanin C (2), brazilin (3), (iso-)protosappanin B (4) and sappanol (5). The occurrence of the isolated compounds in C. sappan has already been shown previously.8,9,27
To the best of our knowledge, this is the first study showing the anti-inflammatory effect of sappanol and episappanol. Interestingly, sappanol even increases the secretion of the anti-inflammatory, IL-10. The anti-inflammatory effect of protosappanin C and protosappanin B (2, 4) in macrophages has been described previously. Our result showing a moderate effect of protosappanin C is in agreement with Washiyama et al. (2009)10 and Sasaki et al. (2007)17 who showed the effect on PGE2 or NO reduction in J774.1 macrophage cells. Our results on the anti-inflammatory effects of protosappanin B are in contrast to those of Washiyama et al. (2009)10 who found no activity of protosappanin B in J774.1 macrophage cells. Of note, the literature is not consistent on the anti-inflammatory activity of different protosappanins. Sasaki et al.17 found a slight anti-inflammatory activity of protosappanin B and in J774.1 cells as indicated by the inhibition of NO production and iNOS expression. The compounds isolated from C. sappan are unstable which may contribute to the inconsistency of the literature.
The anti-inflammatory effect of CSE and brazilin in RAW 264.7 macrophages in this study is consistent with the literature. Hong et al. showed an inhibition of COX-2 and iNOS expression of the methanolic extract in RAW 264.7 macrophages.6 Brazilin exhibits anti-inflammatory activity via various mechanisms such as inhibition of NO production and regulation of nuclear factor kappa-B (NF)-κB and activator protein-1 in RAW 264.7 cells28–30 or via inducing heme oxygenase-1 expression and inhibition of the production of PGE2, TNF-α and IL1-β.29
Here, we also show the bioactivity of 1–5 in human SW1353 chondrocytes. To the best of our knowledge, this is the first report that demonstrates the anti-inflammatory effect of protosappanin B and C, sappanol and episappanol in chondrocytes. The in vitro and in vivo anti-inflammatory activity of CSE was shown previously.7,21 We also showed the anti-arthritic effect of brazilin previously.21,22 Thus, this study elucidates the anti-arthritic effect of other constituents besides brazilin.
Furthermore, this study confirms that C. sappan exerts an anti-inflammatory effect and might therefore provide an explanation for the analgesic effect via the reduction of swelling and inflammation according to its traditional use.1
5. Conclusion
CSE and the five isolated fractions, episappanol (1), protosappanin C (2), brazilin (3), (iso-)protosappanin B (4) and sappanol (5) showed significant anti-inflammatory properties in two different cell lines, macrophages and chondrocytes. Thus, CSE and its fractions may be potent candidates for complementary and alternative treatment of inflammation and associated diseases such as arthritis. The study confirms the traditional use of C. sappan to reduce inflammation, swelling and pain.References
- Chinese Pharmacopoeia Commission, Medical Science Press, Beijing, 2010 Search PubMed.
- C. M. Hu, J. J. Kang, C. C. Lee, C. H. Li, J. W. Liao and Y. W. Cheng, Eur. J. Pharmacol., 2003, 468, 37–45 CrossRef CAS PubMed.
- G. Taeg Oh, J. Hoon Choi, J. Joo Hong, D.-Y. Kim, S.-B. Lee, J.-R. Kim, C.-H. Lee, B.-H. Hyun, S. Ryang Oh, S.-H. Bok and T.-S. Jeong, Atherosclerosis, 2001, 159, 17–26 CrossRef.
- J. Hu, X. Yan, W. Wang, H. Wu, L. Hua and L. Du, Tsinghua Sci. Technol., 2008, 13, 474–479 CrossRef CAS.
- K.-J. Kim, H.-H. Yu, S.-I. Jeong, J.-D. Cha, S.-M. Kim and Y.-O. You, J. Ethnopharmacol., 2004, 91, 81–87 CrossRef PubMed.
- C. H. Hong, S. K. Hur, O. J. Oh, S. S. Kim, K. A. Nam and S. K. Lee, J. Ethnopharmacol., 2002, 83, 153–159 CrossRef PubMed.
- Y.-Z. Wang, S.-Q. Sun and Y.-B. Zhou, J. Ethnopharmacol., 2011, 136, 271–278 CrossRef PubMed.
- M. Namikoshi, H. Nakata, H. Yamada, M. Nagai and T. Saitoh, Chem. Pharm. Bull., 1987, 35, 2761–2773 CrossRef CAS.
- L. Fu, X. Huang, Z. Lai, Y. Hu, H. Liu and X. Cai, Molecules, 2008, 13, 1923–1930 CrossRef CAS PubMed.
- M. Washiyama, Y. Sasaki, T. Hosokawa and S. Nagumo, Biol. Pharm. Bull., 2009, 32, 941–944 CAS.
- C. Moon, S. Lee, M. Lee and S. Kim, Life Sci., 1993, 53, 1291–1297 CrossRef CAS PubMed.
- H. Xu and S. Lee, Phytother. Res., 2004, 18, 647–651 CrossRef CAS PubMed.
- T. Jayakumar, C. Chang, S. Lin, Y. Huang, C. Hu, A. Elizebeth, S. Lin and C. Choy, Biomed. Res. Int., 2014, 2014 Search PubMed , 403703.
- Y. Chang, S. Huang, W. Lu, C. Chung, W. Chen, S. Lu, K. Lin and J. Sheu, J. Biomed. Sci., 2013, 20 Search PubMed.
- C.-T. Yen, K. Nakagawa-Goto, T.-L. Hwang, P.-C. Wu, S. L. Morris-Natschke, W.-C. Lai, K. F. Bastow, F.-R. Chang, Y.-C. Wu and K.-H. Lee, Bioorg. Med. Chem. Lett., 2010, 20, 1037–1039 CrossRef CAS PubMed.
- C. Lee, C. Wang, J. Kang, J. Liao, B. Chiang, H. Chen, C. Hu, C. Lin, S. Huang and Y. Lai, J. Agric. Food Chem., 2012, 60, 9405–9414 CrossRef CAS PubMed.
- Y. Sasaki, T. Hosokawa, M. Nagai and S. Nagumo, Biol. Pharm. Bull., 2007, 30, 193–196 CAS.
- M.-J. Chu, Y.-Z. Wang, K. Itagaki, H.-X. Ma, P. Xin, X.-G. Zhou, G.-Y. Chen, S. Li and S.-Q. Sun, J. Ethnopharmacol., 2013, 148, 37–44 CrossRef CAS PubMed.
- A. Liu, S. Shu, H. Qin, S. Lee, Y. Wang and G. Du, Planta Med., 2009, 75, 337–339 CrossRef CAS PubMed.
- J. Wu, M. Zhang, H. Jia, X. Huang, Q. Zhang, J. Hou and Y. Bo, Naunyn-Schmiedeberg's Arch. Pharmacol., 2010, 381, 83–92 CrossRef CAS PubMed.
- S. Q. Wu, M. Otero, F. M. Unger, M. B. Goldring, A. Phrutivorapongkul, C. Chiari, A. Kolb, H. Viernstein and S. Toegel, J. Ethnopharmacol., 2011, 138, 364–372 CrossRef PubMed.
- S. Toegel, S. Wu, M. Otero, M. Goldring, P. Leelapornpisid, C. Chiari, A. Kolb, F. Unger, R. Windhager and H. Viernstein, Genes Nutr., 2012, 7, 307–318 CrossRef PubMed.
- M. Mueller, S. Hobinger and A. Jungbauer, Food Chem., 2010, 987–996 CrossRef CAS.
- S. A. Bustin, J. F. Beaulieu, J. Huggett, R. Jaggi, F. S. Kibenge, P. A. Olsvik, L. C. Penning and T. S. Toegel, BMC Mol. Biol., 2010, 74 CrossRef PubMed.
- C. Fuke, J. Yamahara, T. Shimokawa, J.-E. Kinjo, T. Tomimatsu and T. Nohara, Phytochemistry, 1985, 24, 2403–2405 CrossRef CAS.
- D. S. Kim, N.-I. Baek, S. R. Oh, K. Y. Jung, I. S. Lee and H.-K. Lee, Phytochemistry, 1997, 46, 177–178 CrossRef CAS.
- K. Mitani, F. Takano, T. Kawabata, A. Allam, M. Ota, T. Takahashi, N. Yahagi, C. Sakurada, S. Fushiya and T. Ohta, Planta Med., 2013, 79, 37–44 CAS.
- I.-K. Bae, H.-Y. Min, A.-R. Han, E.-K. Seo and S. K. Lee, Eur. J. Pharmacol., 2005, 513, 237–242 CrossRef CAS PubMed.
- C. M. Hu, Y. H. Liu, K. P. Cheah, J. S. Li, C. S. K. Lam, W. Y. Yu and C. S. Choy, J. Ethnopharmacol., 2009, 121, 79–85 CrossRef CAS PubMed.
- B. S. Min, T. D. Cuong, T. M. Hung, B. K. Min, B. S. Shin and M. H. Woo, Bioorg. Med. Chem. Lett., 2012, 22, 7436–7439 CrossRef CAS PubMed.
| This journal is © The Royal Society of Chemistry 2016 |

