
Integrating a microbial electrochemical system into a classical wastewater treatment configuration for removing nitrogen from low COD effluents†
Sara
Tejedor-Sanz
ab,
Tristano
Bacchetti de Gregoris
a,
Juan José
Salas
c,
Laura
Pastor
d and
Abraham
Esteve-Núñez
*ab
aIMDEA Water, Alcalá de Henares, Madrid, Spain
bDepartment of Chemical Engineering, Universidad de Alcalá de Henares, Alcalá de Henares, Madrid, Spain. E-mail: abraham.esteve@uah.es
cFoundation Center for New Water Technologies (CENTA), Carrión de los Césdedes, Seville, Spain
dDepuración de Aguas del Mediterraneo (DAM), Paterna, Valencia, Spain
First published on 6th July 2016
Abstract
The scaling-up process of microbial electrochemical technologies (METs) may require an initial investment for constructing completely new infrastructure. In contrast, adapting METs to equipment already present in wastewater treatment plants (WWTP) can be an attractive alternative to accelerate their implementation. In this study we evaluated the viability of adapting a classical oxic–anoxic chamber system to a membrane-free microbial electrochemical system in order to remove both nitrogen and organic matter. We simulated this configuration on a 22 L reactor with two chambers in the absence of any separation membrane. The working electrode acted as the electron source for denitrifying microorganisms and was placed in the first chamber. The system was able to support the nitrifying activity without external aeration and at oxygen levels below 2 mg L−1. The influent, a synthetic medium with ammonium as the sole nitrogen source, was fed at COD/N ratios from 2 to 4. Up to 19 g NO3− N m−3 TCC per day were reduced at a COD/N ratio of 4, with a denitrification efficiency of 93% and a nitrogen removal efficiency of 81%. The system's capacity for nitrifying and denitrifying was strongly dependent on both the COD/N ratio and the working electrode potential. A massive sequencing study revealed the greater abundance of denitrifying genera such as Opitutos, Methyloversa and Zoogloea at the cathode. Nitrifying genera such as Nitrosomonas and Nitrospira were found in the reactor, the latter being enriched at the anode. In this study we demonstrate that the classical configuration of activated sludge systems can be turned into a MET to treat wastewater. We suggest the implementation of this air-free hybrid configuration in WWTP as an alternative method to remove nutrients from effluents with low levels of organic matter.
Water impactMETs have been extensively shown in laboratory studies as a potential technology for wastewater treatment. The scaling-up of these systems in WWTP can be accelerated if real-world experiences with economic and easy set-up prototypes can be tested. We investigated the viability of operating a classical activated sludge configuration with MET integration. Using this hybrid reactor with large volumes of wastewater can provide conclusions from real experiences for developing optimized designs of METs. Our results show the viability of using these configurations for removing nitrogen and organic matter in wastewaters with low COD/N, while reducing sludge production. |
1. Introduction
Biological nitrogen removal is widespread, but the classical nitrification/heterotrophic denitrification process involves two major problems associated with wastewater treatment today: the large operational cost to aerate the nitrifying system and the need for electron donors (typically organic matter) for denitrification. In addition, the sludge produced from the heterotrophic aerobic metabolism needs to be properly managed, treated and disposed of, which increases the operational costs. The requirements of new environmental legislation on municipal and industrial wastewater treatment have driven researchers to find more efficient technologies for wastewater treatment that minimize both the energy demand and the final waste while reusing the by-products generated. In this regard, new lines of research focus on novel forms of microbial metabolisms (e.g. anammox1 and microbial electrochemistry2) while others try to optimize the already existing configurations. Modern WWTP dealing with high loads of organic matter typically operate under anaerobic conditions, with low operational costs and limited sludge production, while generating biogas as a reusable energy source.3 However, these technologies require the implementation of post-treatments, like serial aerated and anoxic tanks, or an anammox reactor, for the removal of nutrients, such as nitrogen.4 Another possible configuration is partial aerobic nitritation to nitrite followed by anaerobic ammonium oxidation to dinitrogen gas, which is economically more viable than nitrification/denitrification. The limitations of implementing this system are the lack of practical experience on treating digester effluents, the long start-up periods needed for enriching a reactor with anammox bacteria due to the low growth rate of these microorganisms and the low amounts of biomass achieved inside the reactor.5 One of the newest and most promising technologies discovered over a decade ago is the use of electroactive bacteria, which have been extensively reported as having large potential for wastewater treatment.6–9 METs have the potential of removing a wide range of organic compounds through the use of microorganisms that use an anode as their terminal electron acceptor.10 Likewise, electroactive bacteria can also use a cathode as the electron donor for reducing substrates like nitrate, nitrite, sulphate, CO2, tetrachloroethane, etc.11–13 Regarding nitrogen removal in METs, several studies have investigated the fundamentals of this process and new designs have been proposed for simultaneous aerobic nitrification/bioelectrochemical denitrification,14,15 or in separate steps.16 Bioelectrochemical denitrification presents several advantages compared to the classical heterotrophic denitrification, for instance, the unlimited electron source of a cathode (supplied by an electric flux) while avoiding the need for the addition of external organic matter. Since the electron flux through the MET electrodes can be tuned, fine control over the rate of reduction reactions can be performed in these systems so that treatment requirements can be achieved. All of these features make a microbial electrochemical system a potential alternative for removing nitrogen from wastewaters with low organic matter content, or even from groundwater.17,18 The scalability of METs in wastewater treatment plants is the main challenge in this innovative field. The success of this process requires optimizing the microbial reactions and minimizing the energy demand of the system, to reduce the electrochemical losses.8 Another factor for implementing METs in WWTP is the reactor design and the cost of the initial investment. The fact that some aspects of a novel technology are still not well understood at the lab scale can be a detriment at the time of performing real experiences with up-scale prototypes. In this regard, it can be economically advantageous to reuse already constructed designs to assess, at a large scale, novel technologies that otherwise are confined at the lab scale. Among the infrastructures that may become obsolete within the next decades, the classical 2 chamber activated sludge configuration may be the first candidate.In this study we have investigated the treatment of low organic matter wastewater for removing nitrogen and carbon in a configuration that simulates a typical activated sludge reactor from a WWTP but using an air-free microbial electrochemical system operating in the electrolysis mode.
2. Materials and methods
2.1 Reactor set-up
The reactor consisted of a methacrylate vessel of 380 × 290 × 238 mm. It was divided into two compartments by a vertical plastic separator. The total working volume (TRV) was 22 L. One of the compartments occupied 1/3 of the total volume and the other 2/3. The separator (290 × 238 mm) had a 20 × 50 mm hole at the bottom in order to let the media circulate through it from one compartment to the other when the system operated at continuous mode. Each compartment was mixed with a vertically rotating stirrer. The effluent outlet port was located in the second compartment, above the reactor liquid level. The effluent was directed to a rectangular-shape sedimentation unit (14 L) in order to collect the sludge produced.The working electrode (WE) consisted of a 450 × 200 mm U-shaped carbon fiber cloth (Resinas Castro, 450 g m−2) consisting of a continuous structure of 2 faces. The counter or auxiliary electrode (AE) was made of a carbon fiber cloth of 230 × 230 mm. A grade 1 titanium mesh was used as a structural element and current collector for each electrode. The WE was placed in the smallest compartment with a total cathodic compartment (TCC) volume of 7.33 L, and the AE in the other (parallel to the bottom wall of the reactor and in contact with air). Two reference electrodes of Ag/AgCl 3M KCl sat. (HANNA) (approx. +200 mV versus the standard hydrogen electrode (SHE)) were used: one located in the vicinity of the WE, and the other one close to the AE). All the potentials in this study are reported versus the SHE. The WE was polarized with a Nanoelectra Nev4 potentiostat when the system worked under potentiostatic mode as a 3-electrode microbial electrolysis cell (MEC). We used a μAutolab II to perform the galvanostatic assay (2-electrode configuration).
The reactor media (RM) contained 0.07 g L−1 NaCl, 0.02 g L−1 CaCl2·H2O, 0.01 g L−1 MgSO4·7H2O, 0.08 g L−1 K2HPO4, 0.02 g L−1 NaHCO3 and 0.1 mL L−1 mineral stock solution and a vitamin stock solution as previously described.19 The inoculum consisted of 2.5 L of the liquor from an activated sludge reactor from a WWTP at CENTA (Carrión de los Céspedes, Sevilla, Spain). The medium from the second chamber (2C) (simulating the oxic zone of an activated sludge system) was recirculated to the first chamber (1C) (simulating the anoxic zone, where denitrification is performed) through a peristaltic pump (Heidolph PD5006). The internal recirculation flux was 2-fold the influent flow at continuous mode (ca. 9.2 L d−1). The influent was synthetic water obtained from a concentrated solution (25-fold) of the RM described above, supplemented with acetate and ammonium (see Table 1), and diluted with tap water just before the inlet port. The influent was fed continuously with a peristaltic pump (Heidolph PD5006) into the first compartment of the reactor. Samples were taken periodically from the two chambers. The effluent samples were taken from the second chamber close to the outlet port. The reactor was operated at room temperature (from 20 to 25 °C).
| Parameter | COD/N ratio | ||
|---|---|---|---|
| a b.d.l: below detection limit. | |||
| Ratio COD/N (mass) | 2 | 3 | 4 |
| COD influent (mg L−1) | 80 | 120 | 161 |
| N influent (mg L−1) | 37 | 37 | 37 |
| Organic load (gacetate m−3 reactor per d) | 17.9 | 26.9 | 35.8 |
| N load (g N m−3 reactor per d) | 8.1 | 8.1 | 8.1 |
| Flow rate (L d−1) | 5.5 | 5.5 | 5.5 |
| HRT (d) | 4.6 | 4.6 | 4.6 |
| COD effluent (mg L−1) | 33.6 ± 21 | 38.3 ± 12 | 39 ± 13 |
| N effluent (mg L−1) | 14.1 ± 4.0 | 13.0 ± 1.8 | 7.2 ± 1.7 |
| NH4+–N effluent (mg L−1) | 3.6 ± 1.5 | 4.4 ± 4.1 | 4.9 ± 2.9 |
| NO3−–N effluent (mg L−1) | 10.6 ± 2.6 | 8.6 ± 5.1 | 2.2 ± 1.5 |
| NO2−–N effluent (mg L−1) | b.d.l | b.d.l | b.d.l |
| Nitrification (%) | 90.4 ± 3.9 | 88.1 ± 11.0 | 86.7 ± 7.8 |
| Denitrification (%) | 68.1 ± 8.7 | 75.1 ± 13.5 | 93.4 ± 4.1 |
| N removal (%) | 61.8 ± 10.7 | 64.8 ± 4.8 | 80.6 ± 4.6 |
| COD removal (%) | 58.2 ± 33.5 | 68.2 ± 21.4 | 75.7 ± 25.2 |
| N removal rate (g N m−3 TCC per d) | 14.3 ± 2.5 | 15.0 ± 1.1 | 18.7 ± 1.1 |
| COD removal rate (g COD m−3 reactor per d) | 9.8 ± 5.4 | 17.1 ± 5.3 | 25.4 ± 8.4 |
| I consumed (A m−2) | −0.10 ± 0.07 | −0.29 ± 0.02 | −0.39 ± 0.19 |
| DO on 1st chamber (mg L−1) | 0.9–1.5 | 0.2–0.5 | 0.1–0.4 |
| DO on 2nd chamber (mg L−1) | 1–4 | 0.6–1.4 | 0.3–0.8 |
2.2 Measurements and analyses
Nitrate and nitrite were measured in a Dionex DX120 ion chromatograph equipped with a conductivity detector, a cation suppressor and an IonPac 4 × 250 mm AS9-HC column. Ammonia was measured in a Metrohm 861 Advance Compact IC equipped with a METROSEP C3 250 column of 4 mm × 250 mm.The soluble organic matter in the effluent was measured in terms of chemical oxygen demand according to standard methods.20 The dissolved oxygen (DO) was measured in both 1C and 2C (Pyro Science instrument). pH was determined with a 25+ probe (Crison).
The sludge production was determined at the end of the experimental period by collecting the particulate matter settled in the sedimentation unit. Biomass was dried in an oven at 50 °C for 5 days. Afterwards, the dried biomass was cooled at room temperature in a desiccator and then weighted until a constant weight was reached (given as total solids (TS)).
Scanning electron microscopy (SEM) was used to observe the bacterial colonization in both WE and AE. For visualizing the internal layers of the WE, several individual carbon fibers were rinsed with deionized water to remove the thick outermost biomass. All the samples were fixed with 5% (v/v) glutaraldehyde in cacodylate buffer (0.2 M, pH 7.2) and dehydrated through a graded series of ethanol solutions (25, 50, 70, 90 and 100%; 10 minutes each stage). Subsequently, the samples were rinsed two times in acetone for 10 minutes and immersed in anhydrous acetone at 4 °C overnight. Finally, the samples were dried in CO2 at the critical point and coated with gold. Micrographs were processed using a scanning electron microscope DSM-950 (Zeiss).
The biofilm thickness and mass from the WE was estimated from thermogravimetric analysis in a simultaneous thermal analyser Mettler Toledo TGA/SDTA851e, under an anoxic atmosphere of N2. The thermogravimetric curves were taken from 25 °C to 970 °C at an increasing gradient of 10 °C min−1. Two samples of the WE were analysed in this equipment: first, a bare sample of electrode of 14.3 mg that served as a control to elucidate the thermal stability of the electrode; second, a sample of WE of 4.1 mg colonized with biofilm, which was submerged in deionized water to remove the non-attached biomass. The biofilm thickness was estimated following the calculations reported elsewhere.21
2.3 Sampling, DNA extraction and 16S rDNA sequencing
Three samples were prepared to determine the composition of their microbial community: 1) biomass from the initial inoculum; 2) biomass from the WE and 3) biomass from the AE. The samples from the electrodes were taken by cutting a piece of the electrodes and then, with tweezers, dipped in three consecutive sterile 0.5 M of EDTA–Na2 solutions in order to remove loosely attached bacteria. The samples from the inoculum were centrifuged (10![[thin space (1/6-em)]](https://www.rsc.org/images/entities/char_2009.gif) 000g, 2 min) and then washed with a sterile buffer solution twice. Each piece of electrode and pellet was placed into PowerBear tubes and vortexed for 1 min twice. DNA was extracted with PowerSoil spin columns (MO BIO Laboratories), suspended in 60 μL of sterile MilliQ water and quantified with PicoGreen (Invitrogen). The rDNA sequencing methodology and analysis are described in the ESI.†
000g, 2 min) and then washed with a sterile buffer solution twice. Each piece of electrode and pellet was placed into PowerBear tubes and vortexed for 1 min twice. DNA was extracted with PowerSoil spin columns (MO BIO Laboratories), suspended in 60 μL of sterile MilliQ water and quantified with PicoGreen (Invitrogen). The rDNA sequencing methodology and analysis are described in the ESI.†
2.4 Experimental procedures
A summary of the assays performed and the operating conditions at each one can be seen in Table S1.†3. Results and discussion
3.1 Start-up of the system
A schematic of the reactor set-up can be seen in Fig. 1. For selecting and growing an electroactive population adapted to use the electrode (1C) as an electron source, the system was initially operated under galvanostatic conditions. Right after inoculating the reactor, the current was fixed at −0.044 A m−2 and the cathode potential gradually decreased until nitrate started to be reduced (see Fig. S1†). Due to the drop of the cathode potential to values as low as −1.1 V, the fixed current consumption was decreased to −0.006 A m−2 in order to keep the cathode potential over −0.8 V to avoid the production of hydrogen in the electrode, an electron donor competitor. Interestingly, the WE potential shifted to higher values when nitrate was spiked in the media, indicating that nitrate was acting as a terminal electron acceptor for microbes. With higher nitrate concentrations in the media, higher cathode potentials were observed. On the contrary, when nitrate was not detected in the media, the potential of the electrode tended to decrease. This means that the set value of current consumption could only be supported by the reduction of other electron acceptors in the media (such as water) with a reduction potential lower than the one for the microbial nitrate reduction. This behavior of the WE is proof of the bioelectrochemical reduction of nitrate using the electrode as an electron donor. Nitrate was reduced at increasing rates from 41 mg L−1 reactor per d to 533 mg L−1 reactor per d at potentials ranging from −1 to −0.8 V, whereas at potentials from −0.6 V to −0.4 V the rate of removal of nitrate was slower, 22 mg L−1 reactor per d. By day 6.7, the system was switched to potentiostatic mode and the cathode potential (WE) was fixed at −0.6 V. As a result, the current instantly decreased to −0.05 A m−2 until the nitrate was depleted and the current reached a baseline of −0.007 A m−2. Nitrite was detected in the medium as an intermediate of nitrate reduction. A rapid return of current consumption was observed whenever nitrate was added to the media. This was an indication of the successful enrichment of electroactive bacteria able to reduce nitrate in the working electrode. After this enrichment stage, nitrate, ammonium and acetate were repeatedly added to the medium for 6 additional days while the system was in potentiostatic mode. Afterwards, the system started to operate under continuous feeding.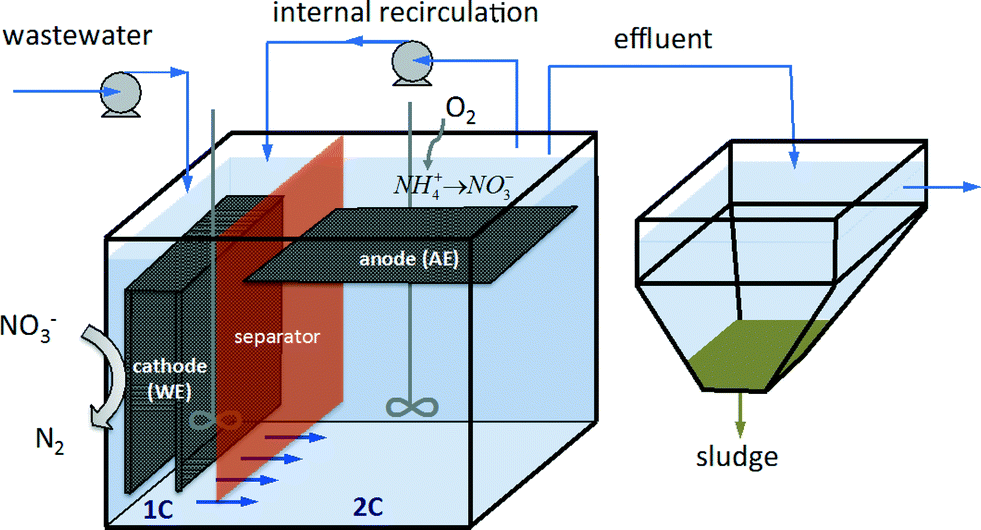 | ||
| Fig. 1 Schematic of the reactor design and experimental set-up. | ||
3.2 Assessment of different COD/N ratios in the influent under continuous mode
No external aeration was required in our system to remove nitrogen. The DO in the influent and the oxygen that diffused into the reactor media was enough for microbial ammonium oxidation. For all the ratios tested, the nitrification was over 86% (Table 1). It was remarkable that DO levels <1 mg L−1 could support the nitrifier's activity, especially at the ratio of COD/N = 4, at which DO reached values as low as 0.3 mg L−1. Under this microaerobic environment the nitrification process did not need an external oxygen supply like in classical aerobic activated sludge systems that operate at DO over 2 mg L−1. No nitrite, a nitrification intermediate that is commonly present in low oxygen environments,23 was detected at any COD/N ratio assayed. This indicates that both nitritation and nitratation reactions were perfectly coupled so that the whole nitrification process was completely accomplished. As the COD/N ratio was increased, the nitrification efficiency decreased (Fig. 2). We hypothesize that this led to the proliferation of heterotrophic microorganisms, which have been reported to inhibit the activity of nitrifiers.24 The fact that the oxidation of ammonium had a similar trend to the DO in the media indicates that oxygen was serving as the electron acceptor for nitrification. When nitrogen was bubbled into the system, the ammonium in the effluent increased suggesting that in the absence of oxygen the nitrification was inhibited (Fig. S2†). Since the influent inlet was located in 1C, most of the 1C DO was consumed by aerobic heterotrophs oxidizing the organic matter. This caused a difference in the DO levels in both chambers (see Table 1). To study the role of the biomass attached to the AE electrode, the electrode was temporally replaced by an electrode of titanium mesh (abiotic AE). The nitrification efficiency started to decrease (Fig. S3†) and the DO levels increased in the reactor, which suggests that the oxygen was no longer being utilized by microorganisms. These results confirmed to us that most of the nitrifying activity was performed by the biomass of the AE. Denitrification was significantly improved when the organic matter in the influent was increased to a ratio of 4, achieving an efficiency of 93%. Probably the lower levels of DO in the first chamber allowed a better reduction of nitrate because oxygen could not inhibit this reaction, and the concentration of this electron acceptor competitor was lower. This increase in the denitrification efficiency could also be related to the higher availability of electron donor (organic matter). Since denitrification was performed at COD/N = 2 under DO levels from 0.9 to 1.5 mg O2 L−1, denitrifying microorganisms may be aerotolerant. However, these denitrifiers could be located at the most internal layers of the biofilm attached to the WE and therefore be exposed to lower oxygen concentrations than measured in the bulk media. No significant changes were found between the ratio COD/N = 2 and COD/N = 3 in terms of % denitrification, % of nitrification and % of total nitrogen removal (see Table S2† for the statistical analysis). However, when the COD/N ratio was increased to 4 by enhancing the COD concentration in the influent, the denitrification and the total nitrogen removal were significantly enhanced. Under this condition, the nitrogen removal efficiency achieved was 81%, corresponding to a rate of 18.7 g N m−3 TCC per d. This value is slightly lower than others reported in similar studies for removing nitrogen in METs15 but those required external aeration to oxidize the ammonium. In contrast, it is similar to the rates achieved by Sayess et al., who accomplished nitrification with a rotating cathode that allowed the oxygen diffuse into the media14 and used higher organic matter concentrations in the influent. In our study, with a COD in the influent as low as 80 mg L−1, 62% of the nitrogen could be removed. In contrast, when the system was operated with no electrodes in the chambers and with a ratio COD/N = 4 in the influent, only 12% of the total nitrogen was eliminated. In this case, the nitrification efficiency accounted for 69% and denitrification for 17%. The main limiting step was found to be the reduction of nitrate, as this compound accumulated in the media. Nitrite was detected at trace levels (<1.1 mg NO2 N L−1) indicating that nitrification was not completely performed, and the presence of the electrodes probably stimulates the activity of nitrite oxidizing bacteria (NOB). This showed that the presence of the electrodes was necessary for reducing nitrate under the conditions tested and their absence resulted in a system with a very low capacity for removing nitrogen, but still able to oxidize some ammonia to nitrate. | ||
| Fig. 2 Performance of the system in terms of nitrification, denitrification and total nitrogen removal at the different COD/N ratios and scenarios tested. | ||
When working in electrolysis mode, no significant changes in the COD of the effluent were observed among the three ratios tested, although the removal slightly increased as the COD load did. This could indicate a limitation of the substrate for the heterotrophic microorganisms. Regarding the current density consumption in the WE, it was due to two simultaneously competing reactions (the reduction of oxygen and nitrate) and therefore the coulombic efficiency cannot be calculated without knowing the current consumption term due to oxygen reduction. Our results suggest that the bioelectrochemical electron utilization for reducing nitrate was favored as the organic matter in the influent was increased. Both the current density consumption and the total N removal tended to increase as the COD/N ratio increased. In contrast, the DO in 1C decreased probably due to its consumption by heterotrophs. This enhancement in the utilization of the cathode as an electron donor as the organic matter in the influent increased is in concord with previous studies which observed that the consumption of oxygen by heterotrophs and nitrifiers benefits the reduction of nitrate with the cathode because the electron acceptor competition in the media is reduced.16
3.3 Operation of the system without internal recirculation at COD/N = 4
Next, the configuration of the reactor was switched to test the reactor's ability to remove nitrogen in the absence of internal recirculation. The circulation in classical reactors moves the nitrate-rich contents of an aerated tank to the anoxic chamber that contains higher levels organic matter (the electron donor). In our case, the electron source was the WE and thus no organic matter was required for denitrifying. Fig. 2 shows that, in the new configuration without internal recirculation, the nitrification process was significantly inhibited, probably due to the presence of organic matter in the new first chamber (2C in the other configuration). The denitrification process could be almost completely performed, although we should keep in mind that the denitrification rate was lower since ca. 40% of the nitrogen fed remained in the form of ammonium. Overall, this new configuration presented the lowest nitrogen removal among all the bioelectrochemical conditions tested due to the limitations in the nitrification step. Nevertheless, at a ratio of COD/N = 4 and without any external aeration or internal recirculation, this system was able to remove 63% of N.3.4 Effect of the electrode polarization on the nitrogen removal process
As a control for analyzing the effect of the working electrode potential on the nitrate reduction, the reactor was operated under open circuit conditions with a ratio of COD/N = 4 (Fig. 3A). During this period, nitrate accumulated in the effluent. When the WE electrode was repolarized, an instant reduction of nitrate was observed. The nitrate drop was linear (r2 = 0.972) within the first 9 hours, and during this time the system was able to reach a constant bioelectrochemical nitrate reduction rate of 48 g NO3 N m−3 TCC per d. After that period, the rate gradually decreased until the nitrate concentrations reached values of ca. 10 mg NO3 L−1. This suggests that the electroactive bacteria did not lose their electron transfer ability under this period of cathodic electron starvation. Indeed, the electroactive biomass was able to rapidly uptake electrons again from the cathode once this electrode was repolarized. This assay confirmed to us the role of the WE not just as a simple carrier for biomass retention but also as an electron source for denitrifying microorganisms. The effect of the electrode polarization on the nitrification process was also analyzed (see Fig. S4†). The ammonium removal rate was not affected by the electrode polarization. Higher trace levels of nitrite were measured when the system was operating under OC conditions when compared to the electrolysis mode. Nitrite accumulation was accompanied by a lower nitrate conversion during the first hours. This means that the nitrification process was being performed incompletely during the first hours at OC. Under the conditions tested, the potential of the AE varied between 1.3 and 1.6 V vs. SHE. The formation of oxygen from water oxidation may have been occurring and thus ammonium oxidizing microorganisms could have benefited from it. Since the specific affinity of ammonium oxidizing bacteria (AOB) for oxygen is higher than that of nitrite oxidizing bacteria (NOB),25 under a low oxygen scenario, this electron acceptor is mostly used by AOB. We hypothesize that the production of oxygen at the AE interface could have been supplying oxygen for NOB. In this case, the nitrification process would have been partially assisted by the electrodes. | ||
| Fig. 3 A. Effect of the polarization of the WE on nitrate reduction. B. Performance of the system in terms of nitrification, denitrification and total nitrogen removal at several fixed WE potentials (all the potentials are reported vs. SHE). C. Current density consumed at the different WE potentials and the dissolved oxygen measured in the WE chamber (1C). All the assays were performed at a COD/N ratio of 4. | ||
Finally, at continuous mode (influent with COD/N = 4), the effect of the WE potential on the TN removal was tested (Fig. 3B). Both nitrification and denitrification were affected by altering the polarization of the electrodes. The highest denitrification rates were achieved when the electrode had a potential of −790 and −900 mV, reaching values of 96 ± 0.8% and 98 ± 0.3%, respectively. As a general trend, the highest denitrification efficiencies were achieved at the lowest WE potentials. From the potential of −800 mV to lower values, the nitrification process was slightly inhibited, probably because the oxygen available was being electrochemically reduced at the electrode faster than it diffused into the media. Actually, both the DO and the current consumption decreased as the WE potential decreased (Fig. 3C), whereas the nitrate reduction was barely affected. The nitrification step limited the system's capacity to remove nitrogen when the system was operated at the lowest WE potentials tested. On the contrary, at higher potentials, the denitrification was the limiting step in the system's performance.
In general, decreasing the WE potential favored nitrogen removal because the denitrification process was more sensitive to changes in this parameter than nitrification.
3.5 Sludge production
After all the experimental periods, the sludge from the settling tank of the reactor was collected. The wet sludge had a volume of 0.5 L, and, after being dried, the dried matter weighted a total of 10 g TS (picture shown in Fig. S5†). The COD consumption was estimated considering the total COD added to the reactor, the average COD removal efficiencies for each condition tested and the length of the experiment. With this data we calculated the dry weight produced from all the organic matter consumed, which was 0.06 kg TSS kg−1 CODremoved. The sludge produced in our system was more than 3-fold less the sludge produced in a similar configuration of activated sludge treating settled wastewater mixed with synthetic wastewater (low TSS content), which was reported to be around 0.2 kg TSS kg−1 CODremoved.26 This notable difference in sludge production between the systems could be due to several factors. First, the sludge produced in our reactor comes from the growth of aerobic heterotrophs and from other microorganisms such as anaerobes and electrogens that have lower growth yields.27 Second, the low substrate load (organic matter, oxygen and nitrogen) in our system might have oriented the metabolism of the cells towards a state in which most of the energy from the oxidative reactions is dedicated to cell maintenance. In addition, the presence of the electrodes played a role, not only as an electron donor or acceptor but also as a carrier facilitating high concentrations of biomass in the reactor and thus, a high sludge retention time. These two factors also contribute to the establishment of a maintenance metabolism for microorganisms in a system operating under substrate-limiting conditions in a continuous culture. Actually, forcing the biomass to a metabolism primarily for maintenance in wastewater treatment reactors is a known strategy used for reducing biomass production in activated sludge systems.283.6 Biofilm characterization and microbial community analysis
The micrographs of the working electrode showed a thick biofilm composed of microorganisms with very different morphologies (Fig. 4A). The outermost layer appeared to be colonized by a dense network of filamentous bacteria (Fig. 4Aa and b). The images of the individual carbon fibers of the WE (Fig. 4Ac and d) showed the inner most layers of the biofilm, where the morphology was predominantly bacilli. These microorganisms seemed to be interconnected by a matrix of polysaccharides. Information regarding the quantity of the biofilm colonizing the electrode was obtained by thermogravimetric (TG) analysis of a sample of the WE. According to the thermal stability of the main components, the electrode with biofilm can be separated into adsorbed water, organic matter, elemental carbon of the electrode, and mineral salts. The TG profile of the electrode with biofilm showed several weight loss processes as the temperature increased (Fig. S6†). The first (until 150 °C) can be attributed to water loss. Further temperature increase provoked the oxidation of the organic matter with the release of CO2, H2O and nitrogen oxides. Finally, when the temperature was high enough, the carbon of the electrode burned via combustion with the release of CO2, leaving a residue of ash. All these three processes appeared as weight losses in the TG curve and the % of dry weight (dw) of the biofilm colonizing the electrode would be the sum of the weight losses associated with the oxidation of the organic matter plus a fraction of the weight of the ashes left at high temperatures (mineral phase). Comparative examination of the TG curves of the bare electrode and the electrode with biofilm helped to better identify the weight loss associated with the combustion of the electrode itself. The comparison of the two TG curves also told us that the biofilm was the only source of the ashes. The density of biofilm on the working electrode was of 152 g dw m−2 electrode, and its estimated thickness was approximately 148 μm. This thickness is significantly higher than those reported in other studies about denitrifying biocathodes.29 Due to this thick layer of biomass, the DO in the media did not probably completely penetrate the biofilm, as Van Loosdrecht and Jetten reported.30 Thus, a variety of microbial communities might have colonized the electrode at different depths of the biofilm as a function of the distance from the electrode, and the oxygen, nitrate and ammonium concentrations. Virdis et al. showed this stratification of nitrifying and denitrifying microorganisms over a biocathode surface with a biofilm 15-fold thinner than the one in this study.29 In fact, SEM micrographs revealed a bacilli morphology only at the innermost zone of the electrode. The thick biomass layer located the outermost zones of the biofilm, with filamentous microorganisms (Fig. 4a and b), was probably using the working electrode as a simple carrier rather than as an electron donor. | ||
| Fig. 4 A. Micrographs of the biofilm formed on the working electrode surface. B. Microbial community diversity at the genera level in the initial inoculum and in the biomass attached to the working and counter electrodes. | ||
In order to gain more information about the biofilm that colonized the electrodes, we sequenced the 16S rDNA of the different communities present in the different environments of the reactor. Several differences were revealed between the microbial composition of the sludge used as the initial inoculum and selected communities in the reactor. The more pronounced changes were found at the bacterial genera level (Fig. 4B), which allowed us to go deeper into the metabolic activities in the reactor. Starting with the initial inoculum, Thauera spp., Alishewanella spp., Rheinheimera spp., Ensifer spp., Methylophilus spp., Rhodobacter spp. and Fusibacter spp. virtually disappear from selected communities in the reactor. Interestingly, some bacteria that did not have a significant presence in the initial sludge were selected for in the reactor. Among them, Prosthecobacter comes to dominate the community in the anoxic chamber with 11.45%. Bacteria from this genus are capable of producing prosthecae, extensions of the cell wall and cytoplasmic membrane. They present aerobic and oligotrophic metabolism31 and they have been found in sludge from the treatment of wastewater. Our results suggest that oxygen and nitrogen species influenced the selection of the microbial community. Aerobic microorganisms were also enriched in the reactor, of which many are able to reduce nitrates to molecular nitrogen, like Aromatoleum, Azohydromonas and Thermomonas.32,33 Other bacterial genera enriched in the reactor that play a role in the nitrogen cycle are Solibacter, which reduces nitrate to ammonium,34Nitrosomonas, responsible for autotrophically oxidizing ammonium to nitrite, and Nitrospira, capable of oxidizing nitrite.35 Interestingly, the Nitrospira genus was notably more abundant in the AE electrode, located at 2C, where the highest levels of oxygen were measured. This confirms that most of the nitrification activity was concentrated in the AE chamber. Denitrifying genera such as Opitutos, Methyloversa36 and Zoogloea were enriched in the reactor, the last two being more abundant in the working electrode biofilm. The genus Zoogloea is known to be capable of reducing both oxygen and nitrate. They also form gelatinous matrixes and flocs that could be related to the matrix observed on the micrographs from the working electrode.37 Interestingly, although this genus is typically found in sewage samples, some studies have found it in iron sediments or in paddy soils and is reported to play a role in the iron cycle.38,39 The presence of this denitrifying genus in the biofilm of the working electrode could be an indication of this genus's ability to accept electrons from the cathode. The denitrifying bacteria constituted from 4.5 to more than 7% of the community, confirming a high activity of nitrate reduction therein. Other differences among communities in the WE and the AE were found in Chondromyces (from 2 to 0.53%), Chthoniobacter (from 0.68 to 1.44%) and Prosthecobacter (from 18 to 0.2%). Regarding the phyla-level changes, after 18 months of operation Firmicutes almost disappeared, going in the initial sludge from 2.6 to 0.2–0.3%, while the Verrucomicrobia (1.4 to 5.5–15%) and Nitrospirae (0.2 to 1.7–4.5%) were enriched in the reactor (Fig. S7A†). Firmicutes are known for their ability to degrade and ferment complex carbohydrates, which were not in the synthetic sewage. The increase of the other three phyla can be explained by the presence of a higher concentration of nitrates in the media and a decrease of nutrients, when compared to regular wastewater. Meanwhile, the main classes that were enriched in the reactor were Sphingobacteria (in both the WE and AE), Deltaproteobacteria (in the WE), Planctomycea and Nitrospira (both in the AE) (Fig. S7B†). Although this analysis can provide us with information about the microbial activity in our reactor, it is difficult to place the specific role of the different electrode-attached populations due to the large thickness of the biofilm. Likely, only a reduced section of the biofilm was directly or indirectly interacting with the electrode.
4. Conclusions
This study demonstrates the viability of reusing or converting a classical activated sludge reactor into a membrane-free MET reactor for removing nitrogen and carbon from low organic matter wastewater. This would allow the reuse of infrastructure already build decades ago and that are currently being replaced by new advance bioreactors for treating wastewaters. One the main benefits of converting an activated sludge system into a MET system is that the investment costs of this technology are limited to the electrochemical equipment because the energy consumption during the operation is highly reduced due to the elimination or minimization of the need for supplied oxygen. We propose our system as a third treatment of effluents that come from a previous carbon removal step, which is unable to remove nutrients (like an anaerobic digester). The nitrogen removal was feasible due to the presence of a biocathode, which served as the electron source for denitrifying microorganisms. In our 2-chamber system with internal recirculation, the nitrification process, not mediated by the electrodes, could be coupled to the electrogenic denitrification step. Our reactor was able to remove nitrogen from a low organic matter influent with no external aeration and no membrane separation between the two electrode chambers, all while reducing sludge production. Further research should work towards optimizing some of the key system parameters, such as the working electrode potential, the recirculating flow, and the design of the electrodes (the area, the material and the position within the chambers). Besides, it is recommended to perform a control on the AE potential in order to avoid the oxidation of chloride ions to chlorine gas, which would negatively affect the biomass in the reactor. This study shows that it is possible to adapt METs to already built activated-sludge reactors and integrate them into urban wastewater treatment plants with no extra infrastructure costs beyond electrode installation. The energy demand in this system was from 0.12 to 0.7 kW h m−3 wastewater (0.005 kW h g−1 N to 0.024 kW h g−1 N) and highly varied depending on the system performance (see the ESI†). These values are higher than others reported for nitrogen removal technologies40 as activated sludge configurations. However, in our system the low sludge production can highly reduce the extra costs associated with its management. The economic viability of this system relies on the reduction of the energy demanded by the potentiostat or power source used in the MET, which implies minimizing the internal resistance and the electrode overpotential (optimization of its area and material).Acknowledgements
This work is supported by the initiative Aquaelectra, funded through the programme INNPACTO from the Spanish Ministry of Science and Innovation.References
- A. Mulder, A. A. van de Graaf, L. A. Robertson and J. G. Kuenen, FEMS Microbiol. Ecol., 1995, 16, 177–183 CrossRef CAS.
- D. R. Lovley, Nat. Rev. Microbiol., 2006, 4, 497–508 CrossRef CAS PubMed.
- J. B. van Lier, A. Tilche, B. K. Ahring, H. Macarie, R. Moletta, M. Dohanyos, L. W. Pol, P. Lens, W. Verstraete and Management Committee of the IWA Anaerobic Digestion Specialised Group, Water Sci. Technol., 2001, 43, 1–18 CAS.
- C. A. L. Chernicharo, Rev. Environ. Sci. Biotechnol., 2006, 5, 73–92 CrossRef CAS.
- C. Fux and H. Siegrist, Water Sci. Technol., 2004, 50, 19–26 CAS.
- Z. Du, H. Li and T. Gu, Biotechnol. Adv., 2007, 25, 464–482 CrossRef CAS PubMed.
- O. Modin and D. J. I. Gustavsson, Water Sci. Technol., 2014, 69, 1359–1372 CrossRef CAS PubMed.
- R. A. Rozendal, H. V. M. Hamelers, K. Rabaey, J. Keller and C. J. N. Buisman, Trends Biotechnol., 2008, 26, 450–459 CrossRef CAS PubMed.
- Z. Borjas, J. M. Ortiz, A. Aldaz, J. Feliu and A. Esteve-Núñez, Energies, 2015, 8, 14064–14077 CrossRef CAS.
- S. Jung and J. M. Regan, Appl. Microbiol. Biotechnol., 2007, 77, 393–402 CrossRef CAS PubMed.
- P. Clauwaert, K. Rabaey, P. Aelterman, L. de Schamphelaire, T. H. Pham, P. Boeckx, N. Boon and W. Verstraete, Environ. Sci. Technol., 2007, 41, 3354–3360 CrossRef CAS PubMed.
- M. Coma, S. Puig, N. Pous, M. D. Balaguer and J. Colprim, Bioresour. Technol., 2013, 130, 218–223 CrossRef CAS PubMed.
- S. M. Strycharz, T. L. Woodard, J. P. Johnson, K. P. Nevin, R. A. Sanford, F. E. Loffler and D. R. Lovley, Appl. Environ. Microbiol., 2008, 74, 5943–5947 CrossRef CAS PubMed.
- R. R. Sayess, P. E. Saikaly, M. El-Fadel, D. Li and L. Semerjian, Water Res., 2013, 47, 881–894 CrossRef CAS PubMed.
- B. Virdis, K. Rabaey, R. A. Rozendal, Z. Yuan and J. Keller, Water Res., 2010, 44, 2970–2980 CrossRef CAS PubMed.
- H. Yan, T. Saito and J. M. Regan, Water Res., 2012, 46, 2215–2224 CrossRef CAS PubMed.
- N. Pous, S. Puig, M. Coma, M. D. Balaguer and J. Colprim, J. Chem. Technol. Biotechnol., 2013, 88, 1690–1696 CrossRef CAS.
- Y. Tong and Z. He, J. Hazard. Mater., 2013, 262, 614–619 CrossRef CAS PubMed.
- J. S. Geelhoed and A. J. M. Stams, Environ. Sci. Technol., 2011, 45, 815–820 CrossRef CAS PubMed.
- A. D. Eaton and M. A. H. Franson, Standard Methods for the Examination of Water & Wastewater, American Public Health Association, 2005 Search PubMed.
- J. Kramer, S. Soukiazian, S. Mahoney and J. Hicks-Garner, J. Power Sources, 2012, 210, 122–128 CrossRef CAS.
- N. Pous, S. Puig, M. Dolors Balaguer and J. Colprim, Chem. Eng. J., 2015, 263, 151–159 CrossRef CAS.
- G. Ciudad, A. Werner, C. Bornhardt, C. Muñoz and C. Antileo, Process Biochem., 2006, 41, 1764–1772 CrossRef CAS.
- K. Hanaki, C. Wantawin and S. Ohgaki, Water Res., 1990, 24, 289–296 CrossRef CAS.
- J. G. Jones, Advances in Microbial Ecology, Springer Science & Business Media, 2013 Search PubMed.
- P. Ginestet, Comparative Evaluation of Sludge Reduction Routes, IWA Publishing, 2007 Search PubMed.
- J. R. Sokatch, Bacterial Physiology and Metabolism, Academic Press, 2014 Search PubMed.
- Y. Wei, R. T. Van Houten, A. R. Borger, D. H. Eikelboom and Y. Fan, Water Res., 2003, 37, 4453–4467 CrossRef CAS PubMed.
- B. Virdis, S. T. Read, K. Rabaey, R. A. Rozendal, Z. Yuan and J. Keller, Bioresour. Technol., 2011, 102, 334–341 CrossRef CAS PubMed.
- M. C. M. Van Loosdrecht and M. S. M. Jetten, Water Sci. Technol., 1998, 38, 1–7 CrossRef CAS.
- B. P. Hedlund, J. J. Gosink and J. T. Staley, Int. J. Syst. Bacteriol., 1996, 46, 960–966 CrossRef CAS PubMed.
- J. Mergaert, M. C. Cnockaert and J. Swings, Int. J. Syst. Evol. Microbiol., 2003, 53, 1961–1966 CrossRef CAS PubMed.
- C.-H. Xie and A. Yokota, Int. J. Syst. Evol. Microbiol., 2005, 55, 2419–2425 CrossRef PubMed.
- N. L. Ward, J. F. Challacombe, P. H. Janssen, B. Henrissat, P. M. Coutinho, M. Wu, G. Xie, D. H. Haft, M. Sait, J. Badger, R. D. Barabote, B. Bradley, T. S. Brettin, L. M. Brinkac, D. Bruce, T. Creasy, S. C. Daugherty, T. M. Davidsen, R. T. DeBoy, J. C. Detter, R. J. Dodson, A. S. Durkin, A. Ganapathy, M. Gwinn-Giglio, C. S. Han, H. Khouri, H. Kiss, S. P. Kothari, R. Madupu, K. E. Nelson, W. C. Nelson, I. Paulsen, K. Penn, Q. Ren, M. J. Rosovitz, J. D. Selengut, S. Shrivastava, S. A. Sullivan, R. Tapia, L. S. Thompson, K. L. Watkins, Q. Yang, C. Yu, N. Zafar, L. Zhou and C. R. Kuske, Appl. Environ. Microbiol., 2009, 75, 2046–2056 CrossRef CAS PubMed.
- S. Lücker, M. Wagner, F. Maixner, E. Pelletier, H. Koch, B. Vacherie, T. Rattei, J. S. S. Damsté, E. Spieck, D. Le Paslier and H. Daims, Proc. Natl. Acad. Sci. U. S. A., 2010, 107, 13479–13484 CrossRef PubMed.
- V. Baytshtok, H. Lu, H. Park, S. Kim, R. Yu and K. Chandran, Biotechnol. Bioeng., 2009, 102, 1527–1536 CrossRef CAS PubMed.
- Y. Shao, B. S. Chung, S. S. Lee, W. Park, S.-S. Lee and C. O. Jeon, Int. J. Syst. Evol. Microbiol., 2009, 59, 526–530 CrossRef CAS PubMed.
- J. D. Coates, D. J. Ellis, E. L. Blunt-Harris, C. V. Gaw, E. E. Roden and D. R. Lovley, Appl. Environ. Microbiol., 1998, 64, 1504–1509 CAS.
- T. Watanabe, H. Sumida, N. M. Do, K. Yano, S. Asakawa and M. Kimura, Soil Sci. Plant Nutr., 2013, 59, 337–346 CrossRef CAS.
- A. Mulder, Water Sci. Technol., 2003, 48, 67–75 CAS.
Footnote |
| † Electronic supplementary information (ESI) available. See DOI: 10.1039/c6ew00100a |
| This journal is © The Royal Society of Chemistry 2016 |