
Characterization, fate and transport of floc aggregates in full-scale flocculation tanks†
Yamuna S.
Vadasarukkai
and
Graham A.
Gagnon
*
Department of Civil and Resource Engineering, Dalhousie University, Halifax, NS B3J 1Z1, Canada. E-mail: graham.gagnon@dal.ca; Fax: 902 494 3108; Tel: 902 494 3268
First published on 4th January 2016
Abstract
Floc size distribution is of high operational importance as it governs the transport and removal of contaminants from drinking water. The complex nature of turbulent flow in treatment plants has limited the research to quantify the dynamics of flocculation. This paper describes the use of a submersible digital in-line holographic microscopy (DIHM) technique for the measurement of the spatial distribution of floc sizes in a direct filtration treatment facility. The DIHM tool was positioned at thirteen different locations in a flocculation tank and holograms were recorded for at least 10 minutes at each location. The acquisition of morphological details of flocs (e.g., floc counts, size distributions and floc velocities relative to the fluid motion) from the reconstructed DIHM images is discussed. The results of the spatial distribution of floc sizes indicated that the volume equivalent floc diameter measured in the flocculation tank was mostly of large-sized aggregates greater than 100 μm, which can have adverse impacts on the performance of a direct filtration process. The relative motion of flocs calculated from the DIHM analysis ranged from 0.002 to 0.008 m s−1. Results showed that the investigated DIHM technique could be used as an operational tool to evaluate flocculation performance in terms of floc sizes, which is otherwise difficult to characterize in most treatment plants. The information acquired from this tool is important to understand the fate and transport of flocs during flocculation for process optimization that can lead to minimize chemical and energy usage in treatment plants.
Water impactThe ability to obtain details on floc morphology from in-line measurements will significantly advance our understanding of the fate and transport of flocs with their associated contaminants in treatment plants. In this study floc counts, floc size distributions, and floc velocities are characterized relative to hydrodynamics in a hydraulic flocculation tank. The results demonstrated that large, irregular shaped floc aggregates were formed in flocculation due to limited supply of active mixing in the tank. Accumulation of large flocs on filters has an economical impact on the plant performance. In a broader context, the ability to understand floc formation in real-time has potential to assist in other environmental applications (e.g., wastewater treatment, algal detection). |
1. Introduction
Coagulation is an important treatment process for the removal of mineral and organic particles in water supplies that are typically stable in water.1 Inorganic metal salts added in coagulation causes a change to the surface chemistry of constituent particles in source water mainly by charge neutralization or enmeshment of particles within metal hydroxide precipitates.2 Flocculation that follows coagulation is the gentle mixing phase used to achieve contact between unstable particles in suspension, promoting their aggregation.3 Particles grow in flocculation often leading to aggregates of highly porous, loosely connected, irregular shaped structures, described as flocs.3,4 High molecular weight polymers are at times added as a flocculant aid to increase floc strength and size by adsorption and interparticle bridging mechanisms.5Flocs represent a complex matrix of microbial communities, colloids and suspended materials, and organic and inorganic constituents.6 The size and strength of the developed flocs determines the efficiency of solids removal processes. Preferred floc characteristics differ depending on the solids removal processes used-for instance, relatively small, dense and low-volume flocs are recommended for direct filtration (i.e., no sedimentation step) in order to enhance the effective use of the media depth.7 In contrast, large and dense aggregates with high resistance to breakage are preferred for sedimentation.8 Although the porosity of aggregates often increases with floc size, which affects their settling rates, their volume, and dewatering characteristics of the sludge.9 Therefore a compromise between sedimentation efficiency and sludge filtration characteristics has to be achieved in industrial practice.
Flocculation is a dynamically active process which is directly influenced by its hydrodynamic conditions.8,10 The flow conditions are driven by localized fluid turbulence that depends on both the geometry of the flocculation tank and the impeller speed and type.11 Flocs are transported between zones of varying levels of energy dissipation in a turbulent flow; this results in a continuous process of aggregation and breakage of flocs.10 Hopkins and Ducoste12 showed that the average floc size varied spatially in a flocculation reactor at low mixing speeds with larger flocs sizes and growth rates in the bulk region and a larger variance in the impeller discharge region. A simulation study by Samaras et al.13 showed no large flocs in the region close to the impeller and floc growth in regions of high residence time. Data on spatial variations in floc size distribution is an important parameter to understand the transport and removal of particles in flocculation, sedimentation and filtration of suspensions.14
Measuring floc physical characteristics (e.g. size and morphology) can be achieved by using a number of different techniques such as optical microscopy,15 automated image analysis system,16 coulter counters,17 laser diffraction techniques,18 and photometric dispersion analyzer.19 Most of these techniques (including microscopy, imaging analysis, and laser diffraction) require withdrawal of floc samples through pipetting or pumping and/or dilution of floc samples prior to the measurement. Such sampling procedures can disrupt the floc structure, causing floc breakage.20 In-line methods are advantageous for floc analysis as it eliminates sample collection and/preparation issues. Only few studies have used in-line techniques (e.g., Oliveira et al.,21 Chakraborti et al.22) – for instance, Chakraborti et al.22 used a non-intrusive photographic technique coupled with a digital image processing system to characterize alum floc aggregates formed in a jar test. But all these aforementioned techniques are limited to laboratory workbench only.
Holographic microscopy is a technique that can be used for the characterization of marine particulates and tracking particle motion, such as the swimming behaviour of microscopic organisms,23 and spatial distribution of micrometer and sub-micrometer particles in dense liquid suspensions.24 In the current study, a submersible digital in-line holographic microscopy (DIHM) was used for the non-destructive, direct measurement of floc characteristics (e.g., floc counts, sizes, relative floc velocities) in a three-stage hydraulic flocculation tank at the J. D. Kline Water Supply Plant in Halifax, Canada. The flow characteristics of the flocculation tank were previously modelled using computational fluid dynamics (CFD), as described by Vadasarukkai et al.11 In the previous study, the predicted average velocity gradient (i.e., the G-values) ranged from 2 to 40 s−1 at various inflow conditions in the flocculation tank, which was significantly below the recommended design criteria of 20 to 75 s−1.7
The purpose of the current study was to obtain in-line measurements of floc size distributions and floc velocities relative to the prevailing turbulent flow in hydraulic flocculation tanks. The potential implications of identified floc characters on filter performance are also discussed. It was hypothesized that the use of DIHM tool will improve the understanding of flocs transport in flocculation as it is capable of counting particles, conducting image analysis and tracking particle motion. The present study is its first application to the authors' knowledge in the drinking water industry.
2. Materials and methods
Overview of the study site
The study was carried out at the J. D. Kline Water Supply Plant in Halifax, Canada. The design capacity of the plant is about 220 ML d−1, with an average daily intake of 95 ML d−1. Raw water is pumped into the direct filtration facility through a 1.2 m (48′′) inlet pipe, and flows under gravity into the subsequent treatment processes. As seen in Fig. 1, the treatment process consists of three rapid mix tanks in series, four parallel units of a three-stage tapered hydraulic flocculation tanks, eight direct dual-media filtration units in parallel, and chlorination. Calcium hydroxide (lime) is added for pH adjustment in the first of three premix tanks. Water then passes to the second premix tank, where additional mixing takes place, and then to the final premix tank where carbon dioxide is used to adjust to the coagulation pH of 5.5–6 and an average alum dose of 8 mg L−1 of aluminum sulfate is added for coagulation.25 | ||
| Fig. 1 Schematic overview of the treatment processes of a direct filtration system at the J. D. Kline Water Supply Plant (Halifax, Canada) (adapted from Vadasarukkai et al.11). Note: not to scale. | ||
Flow distributes the water after coagulation into four identical hydraulic flocculation tanks. Each flocculation tank contains three rows of two parallel sets of chambers (i.e., total six). The inlet pipe is located primarily below grade at the site, which divides the incoming water into the first set of chambers (Fig. 1). The length, width, and depth of each flocculation chamber are 5.0 m, 5.0 m, and 8.3 m, respectively. Two tapered vertical shafts are provided for the water to transfer between the three rows of flocculation chambers. Each shaft has a capacity of 11.95 m3 and 18.68 m3 respectively. The water enters at an inclined angle into the first chamber due to the inlet design. After mixing in the first chamber it flows over a weir, then through a vertical shaft, and enters the next cell from the bottom. The design of an up-and-down flow arrangement in the subsequent second and third flocculation chambers provides the tapered G-value for mixing purposes.11 After the flocculation process, the water is distributed to filter units through a floc water conduit.
DIHM set-up and acquisition of images
Fig. 2 shows the main components of the submersible digital in-line holographic microscopy (4deep Inwater Imaging, Halifax, Canada). It consists of a laser source that directs the light (λ = 365 nm) through a 500 nm pinhole. A spherical wave emanates through the pinhole, which acts as the point source. As seen in the schematic in Fig. 2, it has two pressure chambers, one of which houses the laser and the other has a CCD camera (JAI PULNIX Inc., Sunnyvale, CA) connected to a computer source and a power supply. A 3 mm sampling space was provided between the two chambers to allow free circulation of water (medium) between them. The sampling space can be adjusted up to an 8 mm range depending on floc sizes to measure. Interference between the reference wave with a known phase distribution and light scattered from various size range of floc aggregates in the water was recorded as holograms.24 The records of interference patterns contain spatial information about flocs within the imaged volume. | ||
| Fig. 2 A schematic diagram of a submersible digital inline holographic microscope (DIHM). Two pressure chambers – A & B, a 365 nm laser light source, imaged volume, camera sensor, and computer source are shown. Note: not to scale. | ||
The present study was conducted on one parallel set of chambers of a hydraulic flocculation tank. The flow characteristics predicted in the previous CFD study11 were used to select different sampling locations to position the submersible microscope in the tank. According to the model, three distinct regions were identified in the tank – namely, short circuiting, recirculation and stagnant (non-mixing) zones as shown in Fig. 3. The short circuiting path was created by a jet velocity of flow near the inlet which caused some portion of the incoming flow to rapidly exit into the second flocculation chamber. An intense recirculation region was formed at the interior of the first flocculation chamber, where 10.4% of simulated particles were shown trapped in that region for a longer residence time from the particle tracking analysis.11 Stagnant (or non-mixing) zones depicted in Fig. 3 represented those regions in the second and third flocculation chambers where the flow path of particles never visited.
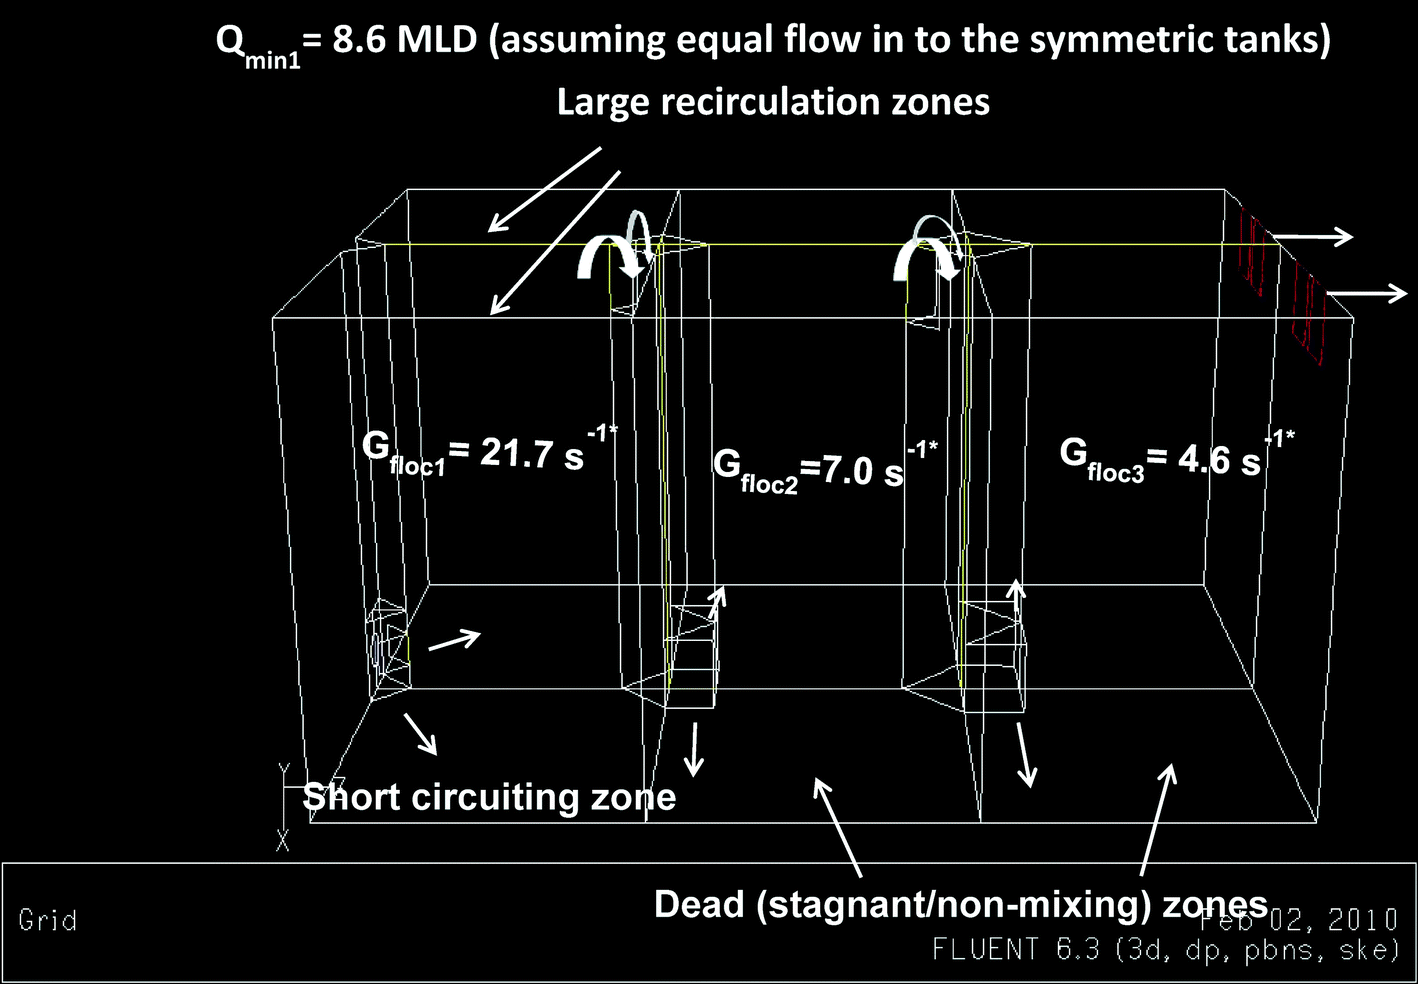 | ||
| Fig. 3 A three dimensional geometry of the three-stage tapered hydraulic flocculation tank along with the flow characteristics. Gfloc1, Gfloc2, Gfloc3 – the average velocity gradient in the first, second and third flocculation chambers, respectively. * The average G-value was 21.7, 7 and 4.6 s−1 in the first, second and third flocculation chambers at a plant flow of 90 MLD was computed from the numerical analysis (Vadasarukkai et al.11). | ||
As illustrated in Fig. 4, the DIHM tool was positioned at thirteen different sampling locations in the flocculation tank to acquire a true representation of the spatial distribution of floc sizes in a turbulent flow. Specifically, eleven locations in section X–X in the first chamber and two locations in section Y–Y in the last chamber were chosen. These locations were selected based on the three regions identified from the flow characteristics described previously. For instance, 1B and 2B were the locations that represented the short circuiting path near the inlet in the first tank; locations 4M and 4B at the center denoted the recirculation region. No sampling location was selected for the second flocculation chamber as the fluid velocity was low in the stagnant zones (Fig. 3). Only two locations, 6T and 6B, were selected for the last (third) flocculation chamber, where location 6T was situated near the peripheral outflow.
 | ||
| Fig. 4 Thirteen sampling locations selected in one parallel set of a flocculation tank for the digital inline holographic microscope (DIHM) analysis – (A) top view of the entire tank (B) sectional view X–X of chamber-1 and (B) sectional view Y–Y of chamber-3. | ||
At each selected location, the DIHM was placed perpendicular to the fluid motion to allow free circulation of water through the sampling space. The instrument was held firmly using a rope, and the holograms were recorded continuously for 10 minutes at 15 fps by the CCD camera as illustrated in Fig. 5. Data was transmitted from the camera to the computer via an underwater cable. All the recorded holograms were stored as bitwise digital images in the computer for further analysis.
 | ||
| Fig. 5 Illustration of holograms recorded at (A) 1B, (B) 1M and (C) 1T locations using the DIHM technique. Note: scale: 100 nm. | ||
Image processing-hologram reconstruction and measuring the floc aggregates
Stored holograms were reconstructed numerically to obtain images of floc aggregates within the imaged volume. Software (Holosuite, 4deep Inwater Imaging) was used to reconstruct each batch of holograms acquired at a sampling location. An example of reconstruction step is illustrated in Fig. 6. Here, two consecutive holograms were paired to remove the background noise. This combined file, called the difference hologram, was then reconstructed with the Kirchhoff–Helmholtz transform26 to obtain images at a particular depth plane in the sample volume. | ||
| Fig. 6 Example of reconstruction step – a difference hologram reconstructed after subtracting the background noise from consecutive hologram pairs at locations (A) 1B; (B) 1M; and (C) 1T (scale: 100 nm). Note: flocs appear as dark spots on the lighter background, the background was changed to a lighter color for better visibility. | ||
The morphological details of flocs, including floc counts and size distribution, were processed from the reconstructed DIHM images. The pixel value of the image was enhanced using the threshold tool to detect the floc aggregates from the background noise. Typically, the pixel value varied between 0 and 255, where 0 was considered as black and 255 signified the white color. Those images with pixel values greater than the adjustable threshold value were recognized as “floc aggregates”; the rest of the image was inferred as background pixels, as suggested by Wu et al., 2010. The threshold value of the original image was adjusted between 110 and 120% by manually examining it for at least 5–10 reconstructed images. The dilation and erosion factors were used to enhance the identified flocs. It was seen that a 10–12 of dilation and 1–3 of erosion were the best suitable values for measuring flocs. The entire sequence of reconstructed DIHM images was then automatically counted, based on the parameter values that were manually adjusted for the first image.
Eqn (1) was used to measure the equivalent circular diameter, d (μm), from the projected area (A in μm2) of a floc detected using the DIHM analysis. The volume and mass distribution of flocs is important for the control of floc sizes in solid–liquid separation process. Thus, floc size distribution was expressed as the volume fraction of floc diameter in each bin using eqn (2).
 | (1) |
 | (2) |
Here, dVi is the volume fraction of flocs in the ith class interval, the term  is the average volume of flocs in the ith class interval by assuming flocs are spherical, the term
  is the frequency of occurrence for the ith class interval with dNi number of flocs, V is the total floc volume.
Floc velocity measurements
Floc velocity was calculated by overlaying two subsequent holograms. Overlaying the reconstructed holograms highlighted only the floc motion relative to the fluid (water) velocity, while the rest of the stationary features were deducted during this process. The distance travelled was manually measured (Fig. 7). The relative magnitude of velocity of a floc was calculated as the ratio of distance travelled and the time between frames. Nearly, 30–50 flocs were tracked to obtain a statistically significant velocity magnitude profile. It was challenging to track flocs, and to calculate their velocities at locations that had minimum fluid velocity (e.g., stagnant zones). | ||
| Fig. 7 Illustration of the relative floc velocity measurement – (A–B) trajectories of a floc aggregate captured using two successive reconstructed holograms (C) superimposing of the two reconstructed holograms to obtain the path travelled by a floc aggregate (D) measurement of the distance travelled (scale: 100 nm). Note: flocs appear as dark spots on the lighter background, the background was changed to a lighter color for better visibility. | ||
3. Results of full-scale data
Floc size distribution
The floc size distribution was evaluated for the thirteen locations in the flocculation tank. Fig. 8 illustrates the volume-based floc equivalent diameter measured at one such sampling location (1B in the first flocculation chamber). The value of the median equivalent diameter was 188 μm at this location, with a 90th percentile of 300 μm. Similar information about the floc size distribution was acquired from the data collected at the remaining locations (1M to 6B). Box and whisker plots were used to demonstrate spatial variations in the equivalent floc diameter as shown in Fig. 9(A) and (B). In Fig. 9(A), the data in the section X–X was arranged into four groups (A, B, C and D) with reference to the flow trajectory. Most distributions were positively skewed, with the median equivalent floc diameter varying from 175 to 225 μm at these locations. A log-normal distribution (α = 0.01) was a suitable fit for the size distribution of floc aggregates, the finding which is in agreement with earlier studies.17 Although five sampling locations (i.e., 1B, 2M, 5B, 5M, and 5T) did not fit any of the models tested, including Weibull, log-normal, exponential, and gamma distributions.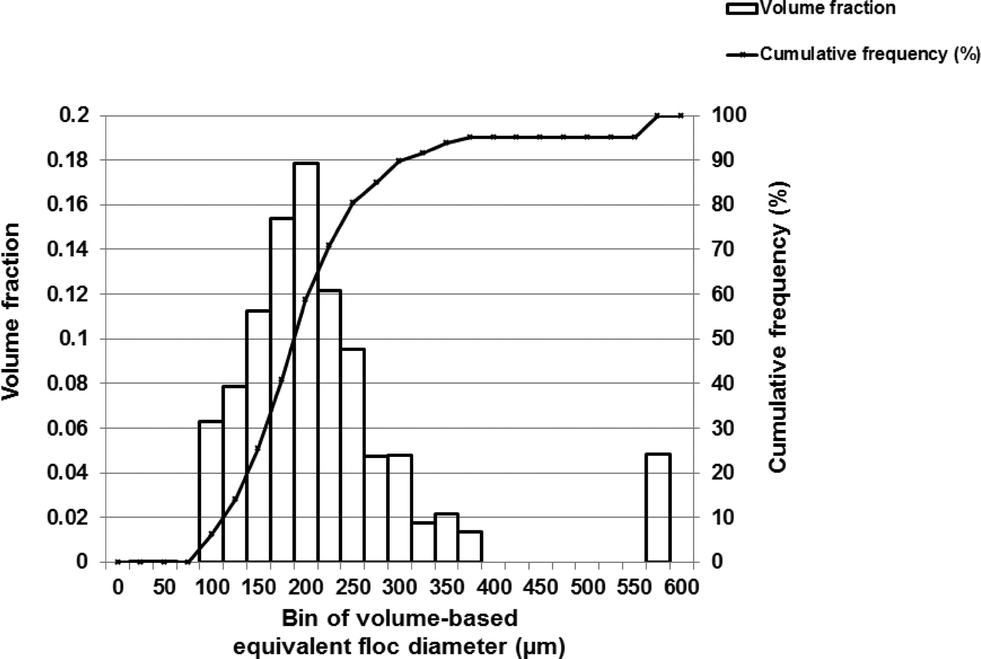 | ||
| Fig. 8 Illustration of the floc size distribution (by volume) with a total floc count of 830 flocs was calculated at the location, 1B, in the flocculation chamber-1. | ||
 | ||
| Fig. 9 Box and whisker plots of the spatial distribution of the volume-based floc equivalent diameter measured at different floc monitoring stations – (A) represents floc sizes formed in chamber-1 and (B) represents floc distribution in chamber-3. | ||
Levene's test (α = 0.05; N > 16) was used to assess the variation in floc size distribution within each group; it showed no significant difference in floc aggregate sizes formed in the section X–X, except for locations in group B (i.e., 2T, 2M and 2B). The spatial distribution of floc size was related to the local velocity of the fluid phase, and the turbulent energy dissipation, as described in previous studies.13,27,28 A detailed description of the predicted velocity distribution for the sections X–X and Y–Y is illustrated in Fig. A(1) in the ESI.† Initially, flocs followed the trajectory of the main inlet flow stream, which was the main source of mixing intensity for flocs to interact in the hydraulic flocculation tank. The actual floc growth was observed more towards the upper middle and top portions of the tank. A few floc aggregates of larger than 550 μm in diameter, identified as outliers in Fig. 9(A), were prominent in group A (i.e., 1T, 1M and 1B) and groups B (i.e., 2T, 2M and 2T). 3M and 4M, situated at the interior of the flocculation tank, had a narrow distribution of floc aggregates with median values between 175 and 200 μm. In these recirculation zones, lower velocities (0 to 0.015 m s−1) were observed, causing fewer particle interaction(s) and limiting floc size.
In the last flocculation chamber, a broader distribution of floc sizes ranging from 100 to 750 μm was observed, as shown in Fig. 9(B). This resulted in a heterogeneous floc suspension near the peripheral outflow, with 95% percent of the volume fraction of floc sizes less than or equal to 674 μm.
Measurements of relative velocity of floc aggregates
The relative motion of individual floc aggregate with respect to the fluid motion was tracked using the recorded holograms. As shown in Fig. 10, median values of the relative velocity of flocs varied significantly from 0.003 to 0.009 m s−1 at each location. A jet inflow velocity of approximately 0.1–0.16 m s−1 near the entrance caused flocs at 1B, 2B and 5B locations to experience a relative floc velocity of up to 0.016 m s−1, following the trajectory of the fluid motion. The sampling locations 5B, 5M and 5T in group D had a clear trend of decreasing values of median floc velocities from 0.007 to 0.004 m s−1 along the depth. This suggested the upward flow of water to the rest of the tank appeared to reduce the floc velocity at the middle and top locations. But, this trend was not consistent in the sampling locations of group A and B, which were situated in a high velocity profile location with the local velocity magnitude ranging between 0.03 and 0.08 m s−1. These locations (1T, 1M, 1B, 2T, 2M and 2B) had median floc velocities ranging between 0.006 and 0.008 m s−1. The low fluid velocity profile of less than 0.015 m s−1 in the recirculation regions (3M and 4M) had the interquartile relative floc velocities ranging from 0.005 to 0.006 m s−1. | ||
| Fig. 10 Box and whisker plots of the relative velocities of flocs with respect to the fluid motion calculated at the sampling locations in the flocculation chamber-1. | ||
The relative motion of flocs calculated from the DIHM analysis was in reasonable agreement with the fluid flow. At large, the predicted fluid velocities (0.02 to 0.055 m s−1) from the CFD analysis were approximately an order of magnitude larger than the DIHM calculated particle velocity (0.002 to 0.008 m s−1). The variation in the average relative velocity of flocs to the fluid motion is attributable to two possible reasons – (i) the actual plant flow was 86.72 ML d−1 at the time of floc analysis, which was less than the modelled flow rate of 90 MLD (ii) floc velocities were tracked for a wide range of flocs sizes from 20 to over 500 μm measured in the flocculation chamber. Saffman and Turner29 found that small agglomerates (<15 μm) in water treatment plants follow the fluid motion completely. The larger floc sizes predominantly found in the flocculation tank exhibited inertia with respect to turbulent flow fluctuations leading to a motion of particles different from that of the fluid, as suggested in Abrahamson's30 work.
4. Practical implications
The DIHM analysis demonstrated a relatively quiescent condition in the flocculation process, which was in agreement with the earlier CFD findings.11 Flocs formed in the hydraulic flocculation tank received a limited supply of active mixing in the chambers, aside from the inlet and small openings in weir columns between the chambers. Median floc sizes of 200–225 μm were formed in the regions that had the local velocity range of 0.035 to 0.07 m s−1. Flocs that were entrained in the recirculation region in locations 3M and 4M of high residence time11 had a narrow distribution of floc aggregates. These regions are recognized to contribute less to floc sizes in the peripheral outflow and are thus less connected to the solid–liquid separation processes (e.g., sedimentation, filtration).13 Approximately 25% of volume fractions of floc sizes measured near the outflow in the present study was larger than 500 μm. As a consequence, bulky and irregular shaped floc aggregates represented the overall floc morphology in the hydraulic flocculation tank.In direct filtration, as the entire solid–liquid separation takes place in the filter itself, the floc size is an important operational parameter.31 Filter beds in direct filtration processes are designed with a large floc holding capacity7 that can retain a considerable volume of floc sizes larger than the effective filter pore size. Alternatively, fine flocs sizes of the order of 1 μm are not readily captured by typical filter grains.32 Their small sizes are more likely to bypass the filters along with the treated effluent, which can pose potential risks to the drinking water quality. The volume equivalent floc diameter measured in the flocculation tank was larger than the optimum sizes recommended in the literature. For instance, the simulation results of Ngo et al.31 indicated that a mean floc diameter of 62 μm was the optimal size for direct filtration. Similar results by Pivokonsky et al.8 demonstrated that small, highly compact and regular aggregates of most probable diameter of 50 μm displayed the best filterability. In the present case, over 98% of the particle count near the peripheral outflow was tied to flocs larger than 100 μm.
The open structure of large floc aggregates can have adverse impacts on the performance of a direct filtration process. Such floc structures are susceptible to breakage during transportation through the floc tunnel to the filtration unit, potentially leading to filter performance issues such as turbidity breakthrough. Jarvis et al.18 showed consistent decrease in floc sizes in three different floc suspensions when exposed to increased rotational speeds, with little re-growth potential after the breakage. Large floc sizes can also reduce the effective filter run times in a direct filtration plants. Pivokonsky et al.8 showed that a high proportion of large (i.e., 155–1330 μm) floc aggregates formed during coagulation/flocculation processes caused a high pressure drop in deep-bed filtration and thereby, significantly shortened filter run time.
5. Conclusions
This study demonstrated the applicability of the submersible digital in-line holographic microscopy (DIHM) technique for the measurement of the spatial distribution of floc sizes in full-scale flocculation tanks. The spatial distribution of floc sizes indicated that the volume equivalent floc diameter measured in the flocculation tank was mostly large-sized aggregates of greater than 100 μm, which was larger than the optimum floc size (∼50 μm) recommended for direct filtration by other studies (e.g., Pivokonsky et al.8). In direct filtration, large flocs can quickly cover the top surface of the filter media, reducing the effective use of the entire media depth. Practical issues of operating at such conditions in a direct filtration facility are rapid clogging of filters, resulting in excessive backwashing due to a high rate of head loss development.The performance of a hydraulic flocculation tanks was evaluated using in-line measurements of floc size distributions, which is otherwise difficult to characterize in treatment plant with respect to the prevailing turbulent flow. The motion of individual floc aggregate tracked in the DIHM showed relative velocities ranging from 0.002 to 0.008 m s−1. At large, the velocity magnitude of fluid motion (0.02 to 0.055 m s−1) from the CFD predictions was approximately an order of magnitude larger than the DIHM calculated particle velocity. Regularly acquiring critical information on the type of flocs formed in flocculation can assist water utilities to take corrective actions (e.g., adjust coagulant dosage, pH, mixing) to improve filter performance. The information from this study is important for understanding the fate and transport of flocs during the flocculation process for process optimization that can lead to minimize chemical and energy usage in treatment plants. The ability of DIHM to measure particles sizes and to compute the relative particle velocities is likely to contribute to the advancement of new technologies for the water and wastewater industry in other environmental applications (e.g., algal, microbial detections).
Acknowledgements
The authors acknowledge the support of the Natural Sciences and Engineering Resource Council of Canada (NSERC) and 4deep Inwater Imaging through an NSERC Engage Grant, as well the financial support of both NSERC and Halifax Water through the NSERC/Halifax Water Industrial Research Chair program. The authors also acknowledge the technical and in-kind support of Dr. Manfred H. Jericho, Stefan Jericho and John Samson from the department of Physics at Dalhousie University during the initial design and implementation phase of the study. The authors also thank the J. D. Kline Water Supply Plant Authority, Nova Scotia, Canada for providing access to conduct sample collections in the hydraulic flocculation tanks.Notes and references
- J. K. Edzwald, Water Sci. Technol., 1993, 27, 21–35 CAS.
- J. M. Duan and J. Gregory, Adv. Colloid Interf. Sci., 2003, 100, 475–502 CrossRef.
- J. Bridgeman, B. Jefferson and S. Parsons, Chem. Eng. Res. Des., 2008, 86, 941–950 CrossRef CAS.
- S. H. Kim, B. H. Moon and H. I. Lee, Microchem. J., 2001, 68, 197–203 CrossRef CAS.
- R. D. Letterman, A. Amirtharajah and C. R. O'Melia, Coagulation and flocculation, American Water Works Association, McGraw Hill, New York, 5th edn, 1999 Search PubMed.
- I. G. Droppo, G. G. Leppard, D. T. Flannigan and S. N. Liss, Water Air Soil Pollut., 1997, 99, 43–53 CAS.
- AWWA and ASCE, Mixing, coagulation, and flocculation, American Water Works Association and American Society of Civil Engineering, McGraw Hill, New York, 5th edn, 2012 Search PubMed.
- M. Pivokonsky, P. Bubakova, L. Pivokonska and P. Hnatukova, Environ. Technol., 2011, 32, 1355–1366 CrossRef CAS PubMed.
- B. Gorczyca and J. Ganczarczyk, Water Qual. Res. J. Can., 1999, 34, 653–666 CAS.
- A. J. Manning and K. R. Dyer, Mar. Geol., 1999, 160, 147–170 CrossRef.
- Y. S. Vadasarukkai, G. A. Gagnon, D. R. Campbell and S. C. Clark, J. - Am. Water Works Assoc., 2011, 103, 66–80 CAS.
- D. C. Hopkins and J. J. Ducoste, J. Colloid Interface Sci., 2003, 264, 184–194 CrossRef CAS PubMed.
- K. Samaras, A. Zouboulis, T. Karapantsios and M. Kostoglou, Chem. Eng. J., 2010, 162, 208–216 CrossRef CAS.
- M. C. Kavanaugh and J. O. Leckie, Particulates in water: characterization, fate, effects, and removal, American Chemical Society, Washington D.C., 1980 Search PubMed.
- B. Gorczyca and J. Ganczarczyk, Environ. Technol., 1996, 17, 1361–1369 CrossRef CAS.
- B. Gorczyca and P. Klassen, Water Qual. Res. J. Can., 2008, 43, 239–247 Search PubMed.
- D. H. Li and J. Ganczarczyk, Res. J. Water Pollut. Control Fed., 1991, 63, 806–814 CAS.
- P. Jarvis, B. Jefferson and S. Parsons, Water Sci. Technol., 2004, 50, 63–70 CAS.
- M. A. Yukselen and J. Gregory, Int. J. Miner. Process., 2004, 73, 251–259 CrossRef CAS.
- R. J. Gibbs and L. N. Konwar, Environ. Sci. Technol., 1982, 16, 119–121 CrossRef CAS.
- A. L. de Oliveira, P. Moreno, P. A. G. da Silva, M. De Julio and R. B. Moruzzi, Desalin. Water Treat., 2015, 1–12 CAS.
- R. K. Chakraborti, J. F. Atkinson and J. E. Van Benschoten, Environ. Sci. Technol., 2000, 34, 3969–3976 CrossRef CAS.
- J. Garcia-Sucerquia, W. B. Xu, S. K. Jericho, P. Klages, M. H. Jericho and H. J. Kreuzer, Appl. Opt., 2006, 45, 836–850 CrossRef PubMed.
- J. Sheng, E. Malkiel and J. Katz, Appl. Opt., 2006, 45, 3893–3901 CrossRef PubMed.
- A. K. Stoddart and G. A. Gagnon, J. - Am. Water Works Assoc., 2015, 107, E638–E647 CrossRef.
- K. Nakamura, H. J. Kreuzer and A. Wierzbicki, Quantum Control and Measurement, 1993, pp. 271–276 Search PubMed.
- D. L. Marchisio, R. D. Vigil and R. O. Fox, Chem. Eng. Sci., 2003, 58, 3337–3351 CrossRef CAS.
- O. P. Prat and J. J. Ducoste, Chem. Eng. Sci., 2006, 61, 75–86 CrossRef CAS.
- P. G. Saffman and J. S. Turner, J. Fluid Mech., 1956, 1, 16–30 CrossRef.
- J. Abrahamson, Chem. Eng. Sci., 1975, 30, 1371–1379 CrossRef CAS.
- H. H. Ngo, S. Vigneswaran and H. B. Dharmappa, Environ. Technol., 1995, 16, 55–63 CrossRef CAS.
- J. Gregory, Filtration & Separation, 1998, 35, 367–371 CAS.
Footnote |
| † Electronic supplementary information (ESI) available. See DOI: 10.1039/c5ew00259a |
| This journal is © The Royal Society of Chemistry 2016 |