 Open Access Article
Creative Commons Attribution 3.0 Unported Licence
First demonstration of direct hydrocarbon fuel production from water and carbon dioxide by solar-driven thermochemical cycles using rhodium–ceria†
Fangjian
Lin
a,
Matthäus
Rothensteiner
bc,
Ivo
Alxneit
*a,
Jeroen A.
van Bokhoven
bc and
Alexander
Wokaun
d
aSolar Technology Laboratory, Paul Scherrer Institute, CH-5232 Villigen PSI, Switzerland. E-mail: ivo.alxneit@psi.ch; Fax: +41 56 310 2688; Tel: +41 56 310 4092
bLaboratory for Catalysis and Sustainable Chemistry, Paul Scherrer Institute, CH-5232 Villigen PSI, Switzerland
cInstitute for Chemical and Bioengineering, ETH Zürich, Vladimir-Prelog-Weg 2, 8093 Zürich, Switzerland
dGeneral Energy Research Department, Paul Scherrer Institute, CH-5232 Villigen PSI, Switzerland
First published on 24th May 2016
Abstract
Solar-driven thermochemical cycles (STCs) are one of the direct pathways to store solar energy in the chemical bonds of energy-rich molecules. By utilizing a redox material like ceria (CeO2) as reactive medium, STCs can produce the chemical fuels hydrogen and carbon monoxide from water and carbon dioxide. The produced syngas, a mixture of hydrogen and carbon monoxide, can be upgraded to hydrocarbon fuels by the Fischer–Tropsch process. Here, we explore a new concept of producing hydrocarbon fuels directly from water and carbon dioxide by incorporating a catalytic process into STCs. To achieve this, a starting material of ceria doped with a catalyst is used as reactive medium. The primary role of the catalyst is to catalyze the formation of hydrocarbon molecules during the reoxidation of ceria by water and carbon dioxide. In this study, nickel-doped ceria and rhodium-doped ceria were investigated for their methane formation activity after being activated by chemical or thermal reduction. Both materials, after being reduced by hydrogen at 600 °C, are active in producing methane during their reoxidation by water and carbon dioxide at 500 °C. After being thermally reduced at extreme temperatures of 1400 °C and 1500 °C, metallic rhodium is formed in rhodium-doped ceria. The activated rhodium–ceria produces methane directly from water and carbon dioxide during reoxidation. The long-term methane formation activity of rhodium–ceria for 59 cycles with thermal reduction is reported. With rhodium–ceria, this study demonstrates for the first time the concept of producing hydrocarbon fuels, i.e. methane, directly from water and carbon dioxide by realistic STCs. In contrast, nickel-doped ceria is not active in producing methane after thermal activation, owing to rapid sintering and loss of nickel at high temperatures. This underlines the importance of evaluating the effect of thermal reduction on the redox material used. The material's physicochemical properties could be rapidly and significantly altered at the extreme temperatures required for the thermal reduction of ceria. Such changes may render a material that is active and stable at low temperatures inactive when used under realistic conditions of STCs.
Broader contextProjected increase of global energy consumption and the need to drastically reduce greenhouse gas emissions demand a transition of the world's energy supply from fossil fuels to renewable sources. In this context, storing solar energy, a clean and abundant, yet dilute and intermittent energy source, in the form of versatile energy carriers represents potentially the ultimate solution to the energy-environment challenge that mankind faces. Solar-driven thermochemical cycles (STCs) utilize a redox material to split water and carbon dioxide, producing chemical fuels hydrogen and carbon monoxide. These fuels can be directly consumed or further converted to hydrocarbon fuels by catalytic processes. This study explores and demonstrates a new concept of producing hydrocarbon fuels directly from water and carbon dioxide by STCs. Any direct conversion of water and carbon dioxide into hydrocarbon fuels instead of syngas is one of the major goals in solar fuel research. This proof-of-principle study that we provide identifies direct hydrocarbon fuel synthesis by STCs as a real opportunity. |
Introduction
Thermochemical cycles based on redox active materials driven by concentrated solar radiation are an attractive and sustainable pathway to produce clean and carbon-neutral chemical fuels such as hydrogen and carbon monoxide from water and carbon dioxide.1–4 This process makes the intermittent and dilute solar energy available on demand. Among all the redox materials studied for solar-driven thermochemical cycles (STCs), ceria (CeO2) is a promising candidate due to the relative ease to remove oxygen from its lattice and to refill the oxygen vacancies formed in response to changes in temperature or oxygen partial pressure.5–7 Additional advantages of ceria include high mobility of oxygen ions in its lattice, high melting temperature and relative abundance. The working principle of a ceria-based STC consists of two steps. In the first endothermic solar step (eqn (1)), ceria is exposed to high temperatures generated by concentrated solar radiation. As a result, some oxygen ions are removed from the lattice, forming oxygen that is removed by a constant flow of inert gas. The material is thus partially reduced and activated.Thermal reduction by concentrated solar radiation:
| CeO2 → CeO2−δ + δ/2 O2 | (1) |
Reoxidation, typically at lower temperatures:
| CeO2−δ + δ H2O → CeO2 + δ H2 | (2a) |
| CeO2−δ + δ CO2 → CeO2 + δ CO | (2b) |
In the second exothermic non-solar step a gas flow containing water (and/or carbon dioxide) is introduced. Ceria is reoxidized to its original state by incorporating oxygen from water, respectively carbon dioxide. Formation of hydrogen, respectively carbon monoxide completes the cycle (eqn (2)). The net reaction of the cycle is water/carbon dioxide splitting. Unlike in the direct thermolysis of water/carbon dioxide, the hydrogen/carbon monoxide and oxygen are formed in separate steps. Thus, their recombination is avoided. The syngas (a mixture of hydrogen and carbon monoxide) produced can be converted to higher grade fuels such as methane and liquid hydrocarbons via methanation and Fischer–Tropsch processes. The entire production chain to renewable jet fuel from water and carbon dioxide by a two-stage conversion process, first STCs and then the Fischer–Tropsch process, was recently demonstrated by the European consortium SOLARJET.8
The first demonstration of STCs based on ceria was reported by Abanades and Flamant.9 Ceria was thermally reduced to cerium(III) oxide at 2000 °C under concentrated radiation at reduced pressures (100–200 mbar). The reduced ceria was collected and reacted with water producing hydrogen. Due to the very high reduction temperature, significant sublimation losses (∼50 wt%) occurred. To avoid the extreme temperature for reduction and to suppress sublimation, similar cycles based on non-stoichiometric ceria were investigated by Chueh et al.10,11 and Furler et al.,12 showing great potential of ceria as the redox material for STCs.
Most research efforts in designing redox materials for STCs are devoted to improving syngas production. This can be achieved by doping ceria with heterocations,13–17 or by fabricating porous structures to facilitate mass/heat transfer and improve the redox kinetics.18–20 A very attractive route is the direct production of hydrocarbon fuels from water and carbon dioxide by realistic STCs.21 This new concept, if high selectivity for hydrocarbons is achieved, inherently bypasses a second stage conversion, such as methanation or Fischer–Tropsch processes. This could potentially make the solar fuel production chain much more economical. In addition, storage and transportation of syngas would not be required. Encouragingly, Chueh and Haile reported the direct formation of methane from water and carbon dioxide by thermochemical cycles using 10 wt% nickel supported on samarium-doped ceria.22 However, ceria was chemically reduced with hydrogen at 800 °C or 900 °C, a much lower temperature than required for the thermal reduction of ceria.
With the aim to produce hydrocarbon fuels directly from water and carbon dioxide, we propose a strategy of incorporating a catalytic process into STCs by adding a catalyst to ceria. This study shows that direct methane production in STCs is possible. The primary role of the catalyst is to drive the formation of hydrocarbon molecules (Fig. 1). The formation of these hydrocarbon fuels can be either from the conversion of the syngas generated by water and carbon dioxide splitting, or directly from water and carbon dioxide without the intermediate formation of syngas, or from a combination of both.
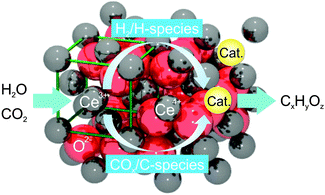 | ||
| Fig. 1 Schematic illustration of direct hydrocarbon (CxHyOz) formation from water and carbon dioxide during the reoxidation of reduced ceria doped with a catalyst (Cat.). | ||
In this study, we have prepared nickel-doped ceria and rhodium-doped ceria by incorporating cationic nickel and, respectively rhodium into the ceria lattice using a simple co-precipitation method. By incorporation instead of impregnation of the catalyst, a better dispersion of the catalyst on ceria can be achieved in the event of phase segregation potentially occurring during STCs. Nickel is well known as an active methanation catalyst due to its activity for carbon monoxide dissociation and hydrogenation.23–25 Rhodium was chosen since oxide-supported rhodium is an active Fischer–Tropsch catalyst for the conversion of syngas to methane, methanol and other oxygenates.26,27 Rhodium-doped ceria has been reported previously,28–30 with advantages such as atomic dispersion and thus potentially large number of active reaction sites.28,29 Atomically dispersed and nanosized rhodium particles supported on ceria–alumina are an active and stable catalyst for methane steam reforming.31 Here, we demonstrate the concept of producing a hydrocarbon fuel directly from water and carbon dioxide during the reoxidation of thermally reduced rhodium–ceria under realistic conditions. Long-term activity of the material for 59 cycles is reported. In contrast, nickel-doped ceria is not active in producing methane when thermally activated.
Experimental
Synthesis
1 mol% rhodium-doped ceria and 10 mol% nickel-doped ceria (XRh = 0.01 and XNi = 0.1, balance cerium) were synthesized by a simple co-precipitation method as described earlier.32 Cerium(III) nitrate hydrate and rhodium(III) (respectively nickel(II)) nitrate hydrate from Sigma Aldrich were used as precursors. Appropriate amounts of the nitrate salts were dissolved in excess amount of de-ionized water. Aqueous ammonia solution (28 vol%) was added drop-wise to the precursor solution under vigorous stirring. After the pH was stabilized at 9, the precipitates were aged for 24 h under stirring, followed by settling for another 24 h. The precipitates were filtered, rinsed, and dried before they were crushed into fine powders and calcined at 500 °C for 5 h.Thermochemical activity tests
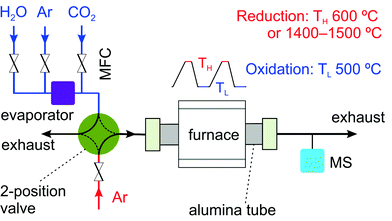
A home-built setup, similar as reported in another study,33 was used to carry out thermochemical cycling experiments with rhodium-doped and nickel-doped ceria as the redox materials (Fig. 2). The whole setup consists of three major parts. The first part is a gas delivery system with digital mass flow controllers (Bronkhorst), a temperature-controlled evaporator (Bronkhorst), and a two-position valve (Vici). This valve allows quick switches between reducing and oxidizing atmospheres. The second part is an alumina tube passing through a programmable tube furnace (Heraeus Thermicon P or Ulvak VHT E44). The last part is a gas analysis system with a mass spectrometer (MS, Pfeiffer Vacuum D-35614 Asslar GSD 301 O1 or Ominstar GSD 320).Typically, unless otherwise indicated, about 150 mg of material in the form of a pressed pellet was used in each test. The sample pellet was contained in an alumina sample holder,33 placed inside the alumina tube. Activation of the material was achieved by thermal reduction at 1400 °C or 1500 °C under argon at a flow rate of 100 Nml min−1. The reoxidation was carried out at 500 °C. The reoxidation gas condition was varied by mixing argon (100 Nml min−1) with one or both of the two oxidants: carbon dioxide at 6.2 Nml min−1 and water at 0.6 g h−1 (12.4 Nml min−1). The molar ratio of water to carbon dioxide was 2. The concentrations of hydrogen (m/z = 2), oxygen (m/z = 32), carbon dioxide (m/z = 44), carbon monoxide (m/z = 28 and 12) and methane (m/z = 15) in the effluent gas were continuously monitored by the mass spectrometer at a time resolution of a few seconds. In the preliminary studies, 10 mol% H2/Ar at a total flow rate of 100 Nml min−1 was used to chemically reduce ceria at 600 °C. The reoxidation was carried out with a gas mixture of argon (70 Nml min−1), carbon dioxide (10 Nml min−1) and water (1 g h−1). 500 mg of each material diluted with 1000 mg sea sand in the form of loose powder was used to form a packed-bed in a quartz tube.
Characterization
A PANalytical X'Pert X-ray powder diffractometer was used to identify crystalline phases of selected materials after thermochemical cycles. The diffractometer was operated at 45 kV and 20 mA in continuous scanning mode with Cu Kα radiation (λ = 1.5405 Å) as the X-ray source. An integration time of 10 s and a step size of 0.05° were chosen. For sample preparation, the materials after reaction were finely ground in ethanol and the slurry was manually deposited on clean glass substrates. X-ray fluorescence (XRF) data presented in the ESI† were obtained using an EDAX ORBIS micro X-ray fluorescence analyser. The details can be found elsewhere.34Results and discussion
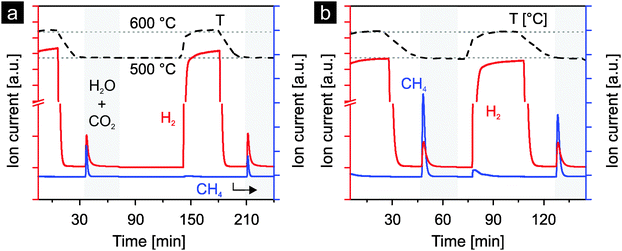
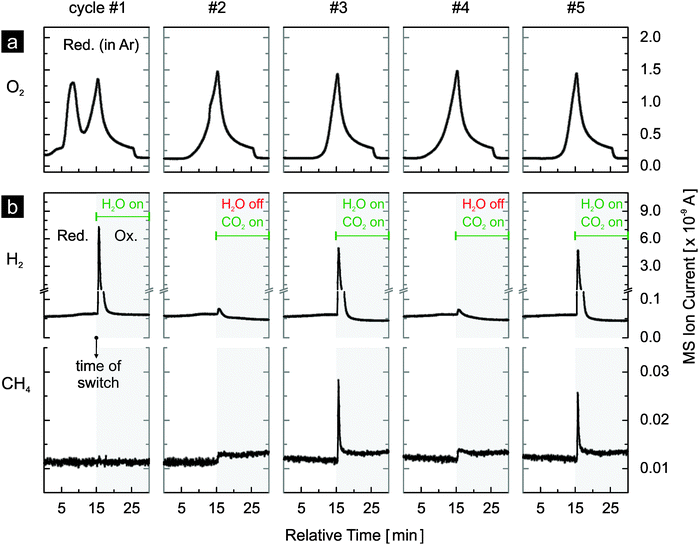
To screen ceria doped with various heterocations for their use in the thermochemical production of hydrocarbons directly from water and carbon dioxide under realistic conditions, preliminary studies were carried out. The materials were activated by reduction with a mixture of hydrogen and argon at 600 °C. The reoxidation was carried out with a mixture of water, carbon dioxide and argon at 500 °C. Fig. 3 presents the results for 10 mol% nickel-doped ceria and 1 mol% rhodium-doped ceria. After reduction, hydrogen and methane are produced during the reoxidation steps by both materials. More methane is produced with rhodium-doped ceria than with nickel-doped ceria. However, for both materials, less methane is produced in the second cycle, likely due to sintering of the materials. Nonetheless, these preliminary results indicate the potential of nickel-, respectively rhodium-doped ceria for direct methane production from water and carbon dioxide during the reoxidation steps in realistic thermochemical cycles.Both materials were further evaluated in realistic thermochemical cycles, in which they were activated by thermal reduction. The materials were reduced in argon at 1400 °C and subsequently reoxidized by either water or carbon dioxide, or both at 500 °C. In Fig. 4 we report the first five cycles of 1 mol% rhodium-doped ceria. Very similar oxygen evolution profiles during thermal reduction are observed in all cycles except for the first (Fig. 4a). The additional oxygen peak observed at about 1100 °C is attributed to the irreversible reduction of the Rh3+ precursor during the first reduction step. Excluding the first cycle at 108.2 μmol O2 g−1, the amount of oxygen released per cycle is in the range of 59 to 74 μmol g−1 (Table 1). With an estimated oxygen partial pressure of about 40 ppm during reduction, these values are in general agreement with the ceria non-stoichiometry established by Panlener et al.7 A closer examination of the oxygen evolution profiles of cycles #2 to #5 reveals that oxygen evolution starts at a lower temperature in cycles #2 and #4 compared to cycles #3 and #5, leading to larger amounts of oxygen released (Table 1). Note that in cycles #3 and #5, the material was previously reoxidized by carbon dioxide only, while in cycles #2 and #4 water was present during the preceding reoxidation. This suggests that the reoxidation is more complete when water is present as oxidant. Thus, the true oxygen release capacity can be obtained by averaging the amounts of oxygen released during the reduction steps following complete reoxidation (i.e. by water). On average 72.6 μmol O2 g−1 can be released, based on cycles #2, #4 and #6. Looking at the reoxidation steps (Fig. 4b), when the reoxidation is performed with water as the oxidant such as in cycle #1, only hydrogen is produced (130 μmol H2 g−1). A H2/O2 molar ratio of approximately 1.2 is observed in cycle #1. This value is much lower than 2 because Rh3+ is reduced during the first reduction but the reduced rhodium cannot be reoxidized by water. This suggests that the initially single-phased rhodium-doped ceria21 is transformed into rhodium on ceria, which is confirmed later by X-ray powder diffraction. When carbon dioxide is used as the oxidant as in cycles #2 and #4, as expected essentially no hydrogen is produced (carbon dioxide splitting results discussed later). The very small hydrogen peaks observed are likely due to the reaction of ceria with traces of water from the previous cycle remaining in the gas-delivery system before the reactor. When both water and carbon dioxide are used as oxidants (cycles #3 and #5), in addition to hydrogen, methane is produced. Compared to the average release of 72.6 μmol O2 g−1, a H2/O2 molar ratio of approximately 1.85 is observed. Again this value is lower than 2, likely due to the presence of carbon dioxide as a second oxidant and the consumption of some of the produced hydrogen to form methane.21 Indeed, based on the signal of m/z = 15 (methane), the formation of methane is clearly observed when both oxidants are used (cycles #3 and #5). The slightly larger background of the methane signal when carbon dioxide is introduced is due to traces of methane in the carbon dioxide feed. The methane signal is slightly smaller in cycle #5 compared to cycle #3, indicating some deactivation as the experiment progresses and consistent with the results of Fig. 3.
| Cycle # | Oxidation | H2 (μmol g−1) | H2 (ml g−1) | O2 (μmol g−1) | O2 (ml g−1) | H2/O2 ratioa |
|---|---|---|---|---|---|---|
| a The amount of oxygen used in this calculation is the average value (72.6 μmol O2 g−1) of cycles #2, #4 and #6. In these reduction steps, the material is assumed to be fully reoxidized in the previous cycle by water. | ||||||
| 1 | H2O | 130.0 | 2.91 | 108.2 | 2.42 | — |
| 2 | CO2 | — | — | 70.6 | 1.58 | — |
| 3 | CO2 + H2O | 134.6 | 3.01 | 59.4 | 1.33 | 1.85 |
| 4 | CO2 | — | — | 73.0 | 1.64 | — |
| 5 | CO2 + H2O | 135.1 | 3.03 | 59.4 | 1.33 | 1.86 |
| 6 | CO2 | — | — | 74.1 | 1.66 | — |
Fig. 5 shows the results of carbon dioxide splitting for three cycles (#2, #3 and #4 as in Fig. 4), in the presence and in the absence of water, with a, b and c representing the evolution profiles of m/z = 44 (CO2+), 28 (CO+) and 12 (C+), respectively. Nitrogen (N2), also at m/z = 28, is excluded from discussion as constant and negligible contribution from the nitrogen background is expected. The abundance of nitrogen, estimated at about 150 ppm based on the level of background oxygen, is irrelevant as it only affects the baseline level of the m/z = 28 signal. It is not the baseline but the peak above it that matters. Note that in mass spectrometry, the ionization of carbon dioxide molecules results in smaller fragments of CO+ and C+ at lower relative abundance compared to the parent ion CO2+. Similarly, the ionization of carbon monoxide molecules results in the parent ion CO+ and smaller fragments including C+. When carbon dioxide is introduced to the reactor at room temperature and no carbon dioxide splitting occurs, the MS signals of m/z = 28 and m/z = 12 exhibit a step increase in a manner identical to the signal of m/z = 44 (see Fig. S1, ESI†). However, the signals of m/z = 28 and m/z = 12 during the reoxidation steps of cycles #2 to #4 as shown in Fig. 5b and c clearly differ from the one of m/z = 44 shown in Fig. 5a. In particular, when carbon dioxide is used as the sole oxidant (cycles #2 and #4), both the m/z = 28 and m/z = 12 signals rise to levels clearly exceeding the baseline values (stabilized ion currents as indicated by the horizontal dashed lines). These two dashed lines represent the contribution of CO2 ionization to the current of CO+ and C+, respectively (Fig. S1, ESI†). A simple estimation reveals the cause of the difference between the signals of m/z = 44 (CO2+) and m/z = 28 (CO+). The relative abundance of CO+ from the ionization of carbon dioxide is about 11% of the parent ion CO2+, as calculated from Fig. S1 (ESI†) and from the dashed lines of Fig. 5a and b. Thus, the consumption of carbon dioxide by carbon dioxide splitting leading to 1 arbitrary unit (a.u.) decrease of the CO2+ signal would also result in 0.11 a.u. decrease of the CO+ signal. However, the consumption of carbon dioxide produces carbon monoxide at 1 to 1 molar ratio, which leads to an increase of 1 a.u. of the CO+ signal assuming that carbon monoxide has the same ionization probability as carbon dioxide. Thus, the result of combining these two effects is an increase by 0.89 a.u. of the CO+ (m/z = 28) signal. Thus, the difference between the instantaneous CO+ signal when carbon dioxide is introduced and its corresponding baseline value is due to the carbon monoxide produced by carbon dioxide splitting. A similar estimation can be made for the C+ signal. In comparison to m/z = 28, the difference between the instantaneous signal and the baseline value observed for m/z = 12 is much more pronounced. This is due to a much smaller contribution to C+ current from carbon dioxide ionization (less than 0.025% calculated from the dashed lines of Fig. 5a and c). Thus, the area beneath the instantaneous signal of m/z = 12 and above the baseline value is indicative of carbon monoxide production from carbon dioxide splitting. Comparing cycle #3 with cycles #2 and #4, it is clear that much less carbon monoxide is produced when water is present, indicating much faster oxidation with water although double the amount of water was used, and the consumption of carbon monoxide to form methane. The much higher reactivity of the material with water relative to carbon dioxide is further supported when one compares the hydrogen signals of cycles #1, #3 and #5 in Fig. 4b to the m/z = 12 signals of cycles #2 and #4 in Fig. 5c. The reoxidation is finished in about 2 min when water is present but not completely finished in 15 min (duration of the reoxidation step) when only carbon dioxide is used. This observation also explains the lower amount of oxygen released when water is not used as an oxidant in the previous cycle to reoxidize the material (Table 1).
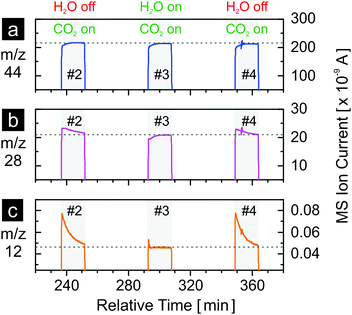 | ||
| Fig. 5 MS signals of m/z = 44 (CO2+), 28 (CO+), and 12 (C+) during the reoxidation steps cycles #2, #3 and #4 in Fig. 4. The horizontal dashed lines indicate the levels of the signals once they have stabilized. | ||
Fig. S2 (ESI†) shows the results of 10 mol% nickel-doped ceria for the same experiment. No methane is produced during the reoxidation steps in cycles #3 and #5, during which both oxidants are used. However, during the heating up of the sample in argon after the reoxidation of cycle #3 (at about 240 min and 1200 °C), hydrogen and methane peaks are observed. However, the same is not observed again after the 5th reoxidation, suggesting a rapid deactivation of the material. The deactivation is supported as less hydrogen is produced in cycle #5 than in cycle #3. Generally in this study, nickel-doped ceria exhibits poor dynamic redox capacity. While in the first cycle a relatively significant amount of oxygen is released, the following reoxidation with water produces a much smaller amount of hydrogen. This is confirmed when one compares cycles #1 and #3, which show similar amounts of hydrogen produced but very different amounts of oxygen released. In fact, only very small amounts of oxygen are released from the second cycle onwards. Part of the spent material was further tested for 11 thermochemical cycles, during which the thermal reduction was performed at 1500 °C. Similarly, the material exhibits a relatively large amount of oxygen released during the first reduction step, while in the following cycles much less oxygen is observed (Fig. S3, ESI†). No methane is observed in any of the reoxidation steps. According to X-ray fluorescence measurements, the material after this experiment contains no nickel while in the fresh material large amounts of nickel are present (Fig. S4, ESI†). Thus, essentially all nickel is lost after the eleven cycles. The loss of nickel is further supported by the observation that the alumina sample holder became blue after the experiment. Thus, it is concluded that nickel-doped ceria is not chemically stable at the extreme temperatures required for realistic STCs. This makes nickel-doped ceria unsuitable for direct hydrocarbon fuel production by STCs, although nickel-doped ceria and nickel supported by ceria are active for the formation of methane after they have been reduced by hydrogen at low temperatures, as shown in Fig. 3 and as reported previously by Chueh and Haile,22 respectively. Therefore, assessing the thermochemical activity of a redox material at low temperatures by chemical reduction is insufficient to predict its performance under the harsh conditions of realistic STCs. In addition, with pure ceria (without modification of a catalyst) as reactive medium, essentially no methane is produced when both water and carbon dioxide are used simultaneously as oxidants (Fig. S5, ESI†).
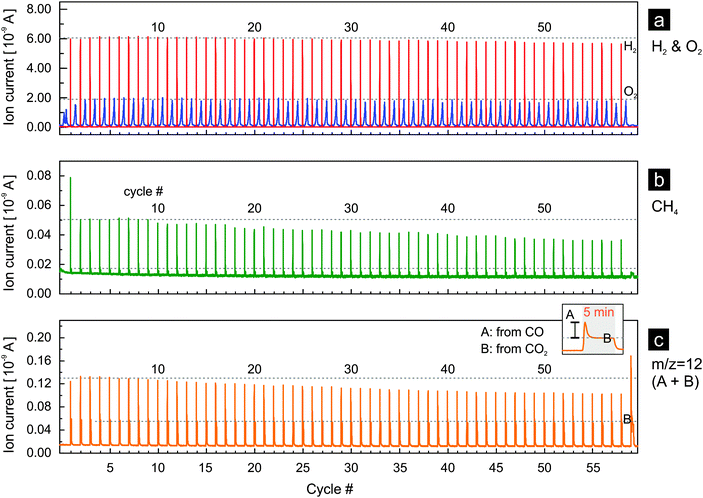
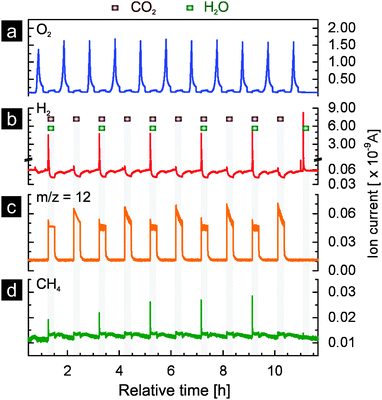
If the thermochemical process based on rhodium-doped ceria is to become significant on an industrial scale, the activity of the material for hydrogen and methane production must be sustained over a large number of cycles. Activity here implies the fuel yield (i.e. the amount of fuel produced per cycle per unit mass of oxide used) and fuel yield per unit time (fuel production rate). In Fig. 6 we present the results of rhodium-doped ceria for 59 thermochemical cycles with reduction at 1400 °C. Both water and carbon dioxide were used as oxidants for the first 58 cycles while only carbon dioxide was used in the last cycle. At first glance, rhodium-doped ceria exhibits a very stable oxygen release, and the peak hydrogen production rate decreases only very slightly during the experiment (Fig. 6a). This is confirmed when one compares the oxygen as well as the hydrogen evolution profiles between the 5th, 15th, 25th, 35th, 45th, and 55th cycle (Fig. S6a and b, ESI†). The amounts of oxygen released, estimated from the area beneath the oxygen evolution curves, stay relatively constant. The oxygen evolution, however, shifts slightly towards the isothermal segments of 1400 °C, indicating a slightly decreased rate of reduction. This could be due to the gradual loss of surface area caused by sintering that occurs as the thermochemical cycling progresses. The peak hydrogen ion current, proportional to peak hydrogen concentration and production rate, decreases only slightly as discussed earlier, and the decay of the hydrogen signal becomes slightly slower (Fig. S6b, ESI†). Thus, the redox kinetics of the materials is stable during the 59 cycles. In comparison, the signals for methane (m/z = 15, Fig. 6b) and carbon monoxide (m/z = 12, Fig. 6c) appear rather different: the peak values decrease gradually and significantly with increasing number of cycles. However, a slowing of the reaction for carbon monoxide and methane production is not observed (Fig. S6c and d, ESI†). Both signals decay to their background values within the same length of time in the 5th and in the 55th cycle. Decreasing amounts of carbon monoxide and methane are produced with increasing number of cycles.
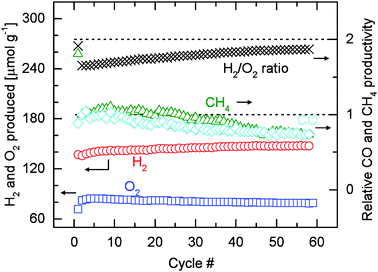
Fig. 7 shows the amounts of hydrogen and oxygen produced per unit mass of oxide (including the H2/O2 molar ratio), and the relative carbon monoxide and methane productivities over 59 or 58 cycles. Quantification is based on the data presented in Fig. 6. Integration of the signals is performed after subtraction of the background. The first cycle is excluded from the discussion as the amount of O2 released also includes the irreversible reduction of Rh3+ (Fig. 4). Consistent with the discussion earlier, the amount of oxygen released over all 59 cycles remains relatively constant at about 80 μmol O2 g−1. The average amount of oxygen released of the first ten cycles is 83.8 μmol g−1. This value slightly decreases to 79.1 μmol g−1, the average of the last ten cycles. These values are, however, slightly higher the average value of 72.6 μmol g−1 reported in Table 1. This small difference is most likely due to the fact that different gas mixtures of oxygen and argon were used in the calibration for the two experiments. Despite that, the hydrogen production rate decreases very slightly as discussed earlier (Fig. S6b, ESI†), increasing amounts of hydrogen are produced over the course of 58 cycles. The average amount of hydrogen produced in the first three cycles is about 136 μmol H2 g−1, consistent with the values reported in Table 1. The amount of hydrogen produced stabilizes at about 147 μmol g−1 for the last twenty cycles. Combined with a relatively constant amount of oxygen evolved, the H2/O2 molar ratio increases from an initial value of about 1.6 to about 1.8 in the last cycle. The shift of the product selectivity of the reoxidation reaction towards hydrogen is reflected by the gradual decrease in the amounts of methane and carbon monoxide produced (Fig. 7). The relative methane and carbon monoxide productivities are calculated by normalizing the integrated areas of the background-subtracted m/z = 15 and m/z = 12 signals by their corresponding values of the second cycle (the first cycle excluded from discussion). The methane and carbon monoxide productivities are relatively stable during approximately the first 10 cycles. After 59 cycles the productivities are at about 75% of their initial values. It is estimated based on the H2/O2 molar ratio that methane is produced at low quantities and hydrogen is the main product (see ESI† for details of estimation). However, selectivity to methane can be enhanced significantly by simply adjusting the molar ratio of water to carbon dioxide in the reoxidation gas feed (Fig. S7, ESI†). The average amount of methane produced increases by 227% when the molar ratio of water to carbon dioxide is decreased to 0.015 from 2.35, a value close to the ratio in the gas used in all previous experiments. Although this particular experiment was carried out with a different setup (see ESI† for details), the comparison was made within the same system, and thus the results are applicable to the main setup we used (Fig. 2). Fig. S7 (ESI†) also shows that much less methane is produced when relatively little amount of water or carbon dioxide is used. Thus it is not unrealistic to infer that carbon monoxide and hydrogen could be the intermediates for the formation of methane. However, to elucidate the reaction mechanism for methane formation, further studies with dedicated systems are required.
As in the case of nickel-doped ceria, part of the rhodium-doped ceria material used in the 1400|500 °C cycles (results presented in Fig. 4) was also further tested for additional eleven cycles, during which the reduction temperature was increased to 1500 °C. Carbon dioxide was used in the first ten reoxidation steps, while water was switched on and off in alternating cycles. In the last cycle, only water was used as oxidant. These results are presented in Fig. 8. As clearly shown in Fig. 8a and b, the oxygen evolution and hydrogen production are stable. This is consistent with the results obtained with the experiment at the lower reduction temperature (Fig. 6). Unlike in the first cycle of Fig. 4 and of Fig. 6, where two peaks are observed in the oxygen evolution profile, only one peak is observed in the first cycle of Fig. 8. This suggests that no further segregation of rhodium from the ceria lattice occurs at 1500 °C during reduction after the material is first reacted at 1400|500 °C. The m/z = 12 signal (Fig. 8c, indicative of carbon monoxide) exhibits similar evolution profiles as the ones presented earlier (Fig. 5, cycling at 1400|500 °C). The methane signal exhibits a clear increase over the tested cycles.
Fig. 9 shows the quantitative results of the hydrogen and oxygen released based on Fig. 8. Relative carbon monoxide and methane productivities are not presented here as the results of Fig. 6 and 7 suggest that the productivities can be indicated directly by the corresponding peak ion currents. Consistent with Fig. 4 and Table 1, higher or lower amounts of oxygen are observed depending on whether water is switched on or off in the preceding reoxidation steps. Due to the incomplete reoxidation when only carbon dioxide is used as oxidant as discussed earlier, the true oxygen release at 1500 °C is calculated from the values of even-numbered cycles. During these cycles, the material is assumed to be completely reoxidized in the preceding cycles as water is present. On average about 121 μmol g−1 of oxygen (O2) can be released. The amount of hydrogen (H2) produced decreases from an initial value of 199 μmol g−1 to 186 μmol g−1 as cycling progresses. Since a constant amount of oxygen released is assumed, the H2/O2 ratio also decreases due to the decrease in the amount of hydrogen produced. The decrease in the amount of hydrogen produced is accompanied by an increase of the methane signal (Fig. 8), illustrating the role of hydrogen as an intermediate towards methane formation. It is very encouraging that increasing amounts of methane are produced as the material undergoes cycling between 1500 °C and 500 °C.
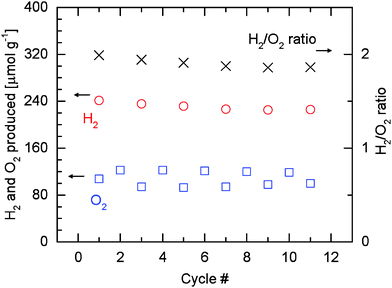 | ||
| Fig. 9 Amounts of hydrogen and oxygen evolved per gram of rhodium-doped ceria, and corresponding H2/O2 molar ratios during eleven cycles at 1500|500 °C. As in Table 1, the amount of oxygen used in calculating the H2/O2 ratios is the average value of the amount of oxygen released in even-numbered cycles, during which the material is assumed to be fully reoxidized in the preceding cycles by water. | ||
The phase composition of the rhodium-doped ceria after it underwent thermochemical cycles was characterized by X-ray powder diffraction. Fig. 10 shows the results. Apart from the main phase of fluorite ceria, an additional peak is observed at about 2θ = 41.6° in the sample that was subjected to six cycles at 1400|500 °C, and in the sample after additional eleven cycles at 1500|500 °C. The additional peak is identified as the (111) reflection of metallic rhodium, which is likely the active catalyst for methane formation. The relative intensity of this rhodium peak for the sample subjected to the additional cycles is essentially of the same magnitude as the one just subjected to the cycles at 1400|500 °C. This suggests that, at 1500 °C, sintering of the metallic rhodium originating from the irreversible reduction of Rh3+ is minimal. The XRD results are encouraging as they indicate thermal stability of the dispersed rhodium particles at extreme temperatures.
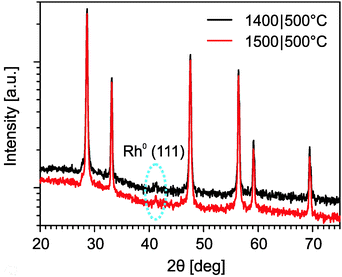 | ||
| Fig. 10 XRD diffraction patterns of rhodium-doped ceria samples after six cycles at 1400|500 °C and after additional eleven cycles at 1500|500 °C. | ||
Conclusions
This study proves the concept of producing hydrocarbon fuels directly from water and carbon dioxide with solar-driven thermochemical cycles (STCs). The strategy is to incorporate a catalytic process into the reoxidation steps of STCs. For this purpose, nickel-doped and rhodium-doped ceria have been synthesized by a simple co-precipitation method. Both materials are active in producing methane from water and carbon dioxide after being chemically reduced with hydrogen at 600 °C. Nickel-doped ceria, however, is not active anymore in producing methane during reoxidation after being activated at extreme temperatures up to 1500 °C. This is attributed to the loss of nickel by sublimation as revealed by X-ray fluorescence. These results with nickel-doped ceria underline the importance of evaluating potential changes of a material's physicochemical properties at extreme temperatures, when thermochemical activity results obtained at low temperatures are used to predict its performance during realistic STCs.With rhodium on ceria, this study demonstrates for the first time that direct and sustained production of methane from water and carbon dioxide by realistic STCs can be achieved. This material exhibits methane, hydrogen and carbon monoxide formation activity during 58 cycles with the activation of the material carried out at 1400 °C. Under these conditions the material exhibits constant amounts of oxygen released during activation and stable hydrogen productivity during reoxidation. Some decrease in the carbon monoxide and methane productivity is observed. Encouragingly, the material exhibits steady increase of activity for methane production when activated at 1500 °C. X-ray diffraction reveals the presence of metallic rhodium in the materials after cycling at 1400|500 °C and after additional cycling at 1500|500 °C, indicating metallic rhodium as the active catalyst for methane formation. This proof-of-principle study leaves significant room for improvement and may stimulate a new research area of solar thermochemical fuel production. Future research efforts shall be directed towards improving the product selectivity to methane and potentially to other hydrocarbons, preferably liquid hydrocarbons like oxygenates.
Acknowledgements
Funding for this work from the Indo Swiss Joint Research Program (grant #138852) and CCEM is gratefully acknowledged. The authors would like to thank Mr Alwin Frei and Dr Camelia N. Borca for assistance.References
- T. Kodama and N. Gokon, Chem. Rev., 2007, 107, 4048–4077 CrossRef CAS PubMed.
- M. Roeb, M. Neises, N. Monnerie, F. Call, H. Simon, C. Sattler, M. Schmuecker and R. Pitz-Paal, Materials, 2012, 5, 2015–2054 CrossRef CAS.
- J. E. Miller, A. H. McDaniel and M. D. Allendorf, Adv. Energy Mater., 2014, 4, 1300469 Search PubMed.
- J. R. Scheffe and A. Steinfeld, Mater. Today, 2014, 17, 341–348 CrossRef CAS.
- A. Trovarelli, Comments Inorg. Chem., 1999, 20, 263–284 CrossRef CAS.
- D. Wang, Y. Kang, V. Doan-Nguyen, J. Chen, R. Kügas, N. L. Wieder, K. Bakhmutsky, R. J. Gorte and C. B. Murray, Angew. Chem., Int. Ed., 2011, 50, 4378–4381 CrossRef CAS PubMed.
- R. J. Panlener, R. N. Blumenthal and J. E. Garnier, J. Phys. Chem. Solids, 1975, 36, 1213–1222 CrossRef CAS.
- D. Marxer, P. Furler, J. Scheffe, H. Geerlings, C. Falter, V. Batteiger, A. Sizmann and A. Steinfeld, Energy Fuels, 2015, 29, 3241–3250 CrossRef CAS.
- S. Abanades and G. Flamant, Sol. Energy, 2006, 80, 1611–1623 CrossRef CAS.
- W. C. Chueh and S. M. Haile, Philos. Trans. R. Soc., A, 2010, 368, 3269–3294 CrossRef CAS PubMed.
- W. C. Chueh, C. Falter, M. Abbott, D. Scipio, P. Furler, S. M. Haile and A. Steinfeld, Science, 2010, 330, 1797–1801 CrossRef CAS PubMed.
- P. Furler, J. Scheffe and A. Steinfeld, Energy Environ. Sci., 2012, 5, 6098 CAS.
- H. Kaneko, T. Miura, H. Ishihara, S. Taku, T. Yokoyama, H. Nakajima and Y. Tamaura, Energy, 2007, 32, 656–663 CrossRef CAS.
- S. Abanades, A. Legal, A. Cordier, G. Peraudeau, G. Flamant and A. Julbe, J. Mater. Sci., 2010, 45, 4163–4173 CrossRef CAS.
- A. Le Gal and S. Abanades, J. Phys. Chem. C, 2012, 116, 13516–13523 CAS.
- J. R. Scheffe, R. Jacot, G. R. Patzke and A. Steinfeld, J. Phys. Chem. C, 2013, 117, 24104–24114 CAS.
- M. Kang, X. Wu, J. Zhang, N. Zhao, W. Wei and Y. Sun, RSC Adv., 2014, 4, 5583–5590 RSC.
- N. D. Petkovich, S. G. Rudisill, L. J. Venstrom, D. B. Boman, J. H. Davidson and A. Stein, J. Phys. Chem. C, 2011, 115, 21022–21033 CAS.
- S. G. Rudisill, L. J. Venstrom, N. D. Petkovich, T. Quan, N. Hein, D. B. Boman, J. H. Davidson and A. Stein, J. Phys. Chem. C, 2013, 117, 1692–1700 CAS.
- P. Furler, J. Scheffe, D. Marxer, M. Gorbar, A. Bonk, U. Vogt and A. Steinfeld, Phys. Chem. Chem. Phys., 2014, 16, 10503–10511 RSC.
- F. Lin, A. Wokaun and I. Alxneit, Energy Procedia, 2015, 69, 1790–1799 CrossRef CAS.
- W. C. Chueh and S. M. Haile, ChemSusChem, 2009, 2, 735–739 CrossRef CAS PubMed.
- D. W. Goodman, R. D. Kelley, T. E. Madey and J. T. Yates, J. Catal., 1980, 63, 226–234 CrossRef CAS.
- C. H. Bartholomew, R. B. Pannell and J. L. Butler, J. Catal., 1980, 65, 335–347 CrossRef CAS.
- Y. Soong, K. Krishna and P. Biloen, J. Catal., 1986, 97, 330–343 CrossRef CAS.
- S. C. Chuang, R. Stevens Jr. and R. Khatri, Top. Catal., 2005, 32, 225–232 CrossRef CAS.
- J. J. Spivey and A. Egbebi, Chem. Soc. Rev., 2007, 36, 1514–1528 RSC.
- A. Gayen, K. R. Priolkar, P. R. Sarode, V. Jayaram, M. S. Hegde, G. N. Subbanna and S. Emura, Chem. Mater., 2004, 16, 2317–2328 CrossRef CAS.
- M. S. Hegde, G. Madras and K. C. Patil, Acc. Chem. Res., 2009, 42, 704–712 CrossRef CAS PubMed.
- M. Kurnatowska and L. Kepinski, Mater. Res. Bull., 2013, 48, 852–862 CrossRef CAS.
- R. B. Duarte, F. Krumeich and J. A. van Bokhoven, ACS Catal., 2014, 4, 1279–1286 CrossRef CAS.
- F. Lin, I. Alxneit and A. Wokaun, CrystEngComm, 2015, 17, 1646–1653 RSC.
- M. Rothensteiner, S. Sala, A. Bonk, U. Vogt, H. Emerich and J. A. van Bokhoven, Phys. Chem. Chem. Phys., 2015, 17, 26988–26996 RSC.
- F. Lin, R. Delmelle, T. Vinodkumar, B. M. Reddy, A. Wokaun and I. Alxneit, Catal. Sci. Technol., 2015, 5, 3556–3567 CAS.
Footnote |
| † Electronic supplementary information (ESI) available. See DOI: 10.1039/c6ee00862c |
| This journal is © The Royal Society of Chemistry 2016 |

