
 Open Access Article
 This Open Access Article is licensed under a
 Creative Commons Attribution 3.0 Unported Licence
How simple are the models of Na intercalation in aqueous media?†
Jeongsik
Yun
a,
Jonas
Pfisterer
a and
Aliaksandr S.
Bandarenka
*ab
aPhysik-Department ECS, Technische Universität München, James-Franck-Straße 1, 85748 Garching, Germany. E-mail: bandarenka@ph.tum.de; Tel: +49(0) 89289 12531
bNanosystems Initiative Munich (NIM), Schellingstraße 4, 80799 Munich, Germany
First published on 16th December 2015
Abstract
Intercalation is among interesting phenomena changing everyday life with a remarkable speed. Numerous generations of modern batteries use it and markedly contribute to the portfolio of energy materials for future sustainable energy provision. Na-ion batteries operating in aqueous media, being presumably the “number two” compared to other alternatives for portable and automotive applications, are probably among potential leaders in the case of future larger-scale energy storage schemes, specifically because of safety and sustainability issues. However, there is a certain lack of detailed understanding of such systems. In this work, using model electrodes we further emphasise that it is not only the electrode materials themselves that determine the performance of intercalation electrodes. Surprisingly, comparatively slight changes in the electrolyte composition and solvation effects can very radically control intercalation of alkali metal cations. Therefore, it would be stimulating to adjust existing strategies in designing future aqueous battery systems. Several examples are given using one of the state-of-the-art cathode materials, Na2Ni[Fe(CN)6], with model electrodes prepared as quasi-uniform thin films.
Broader contextNa-ion batteries operating in aqueous media are among the most promising candidates to contribute to the solution of the so-called generation vs. consumption problem in future sustainable energy provision schemes, perhaps even at the “TW-level”. However, in order to improve existing electrode materials in these devices, deeper fundamental understanding of processes governing their performance is necessary. In this work, it is shown that the interfacial transfer of sodium between one of the best cathode materials and aqueous electrolytes likely involves at least three stages. These stages are significantly influenced by the electrolyte properties and composition. The findings of this work can be used to design ever better Na-ion aqueous batteries, taking into account that the specific capacity of the optimised cathode systems in this work is just 5% lower compared to the theoretical one at a C-rate as high as 180 C. Additionally, the role of solvation effects is emphasized. |
Introduction
Solar and wind energy systems already significantly contribute to energy provision schemes nowadays.1–4 However, more effective solutions of the so-called “generation versus consumption” problem are required to facilitate their further development. Rechargeable batteries are a part of the answer to this challenge as they are, in general, very convenient means for energy storage thanks to their relative affordability, flexibility, high energy conversion efficiency and simple maintenance.5,6Intercalation materials for lithium ion batteries remain probably among the most attractive ones for portable devices and automotive applications.7–9 Nevertheless, for larger-scale stationary energy storage systems, several key issues should be additionally considered. For instance, one of them is related to sustainability factors.10 It has been roughly estimated that in order to address the so-called “TW-challenge” using just Li-ion batteries, ∼160 years of current lithium production would be necessary.11 While there is a certain capability to increase the rate of production of this metal substantially, it is nowadays clear that its fast accumulation for various stationary applications might be problematic. A second issue is associated with the current use of flammable organic electrolytes in Li-ion batteries. Safety problems upon scaling up are often of non-trivial complexity, increasing the maintenance costs and the total system price in this case.12–16
A viable alternative for stationary large-scale storage applications is to use Na-ion batteries, where electrode materials operate in aqueous media.17–24 These types of devices have attracted great attention with an increasing amount of publications, as thoroughly reviewed recently by Kim et al.25 Accumulation of Na in amounts necessary to address the TW-challenge seems to be more than one order of magnitude faster compared with lithium.11 Additionally, aqueous electrolytes would gradually minimise safety risks. However, further development and optimisation of functional electrode materials in this area require detailed understanding of processes which control Na intercalation and de-intercalation, including interfacial charge transfer. For this, model systems and electrodes as well as their comprehensive in situ characterisation are necessary.
In this work, using model electrodes consisting of electrochemically deposited thin films of one of the state-of-the-art cathode materials, namely Na2Ni[Fe(CN)6] (a typical representative of so-called Prussian blue analogues),26,27 we demonstrate that intercalation of Na and its reversibility in cathodic and anodic cycles are largely influenced by the nature of anions present in the electrolytes. On the other hand, the electrode potential required for intercalation is determined not only by the electrode material itself: it is directly proportional to the hydration (solvation) energy of cations. Implications for the development of new Na-ion battery systems are briefly discussed.
Experimental
Na2Ni[Fe(CN)6] thin films were deposited onto AT-cut Au quartz crystal wafers (Stanford Research Systems) from a solution of 0.25 M Na2SO4 containing 0.5 mM K3Ni[Fe(CN)6] and 0.5 mM NiCl2·6H2O by cycling the potential in the range from 0.05 V to 0.85 V at a scan rate of 50 mV s−1 for ∼60 cycles, as shown in Fig. 1A and B. All chemicals and solvents utilised in this work were used without further treatments and are listed with full details in the ESI.† The experiments were performed in a typical glass cell exploiting a three-electrode setup using a Bio-Logic VSP-300 potentiostat and a QCM 200 (Stanford Research Systems) electrochemical quartz crystal microbalance (EQCM). Electrode potentials were referred to an Ag/AgCl (SSC) reference electrode. A Pt wire was used as a counter electrode.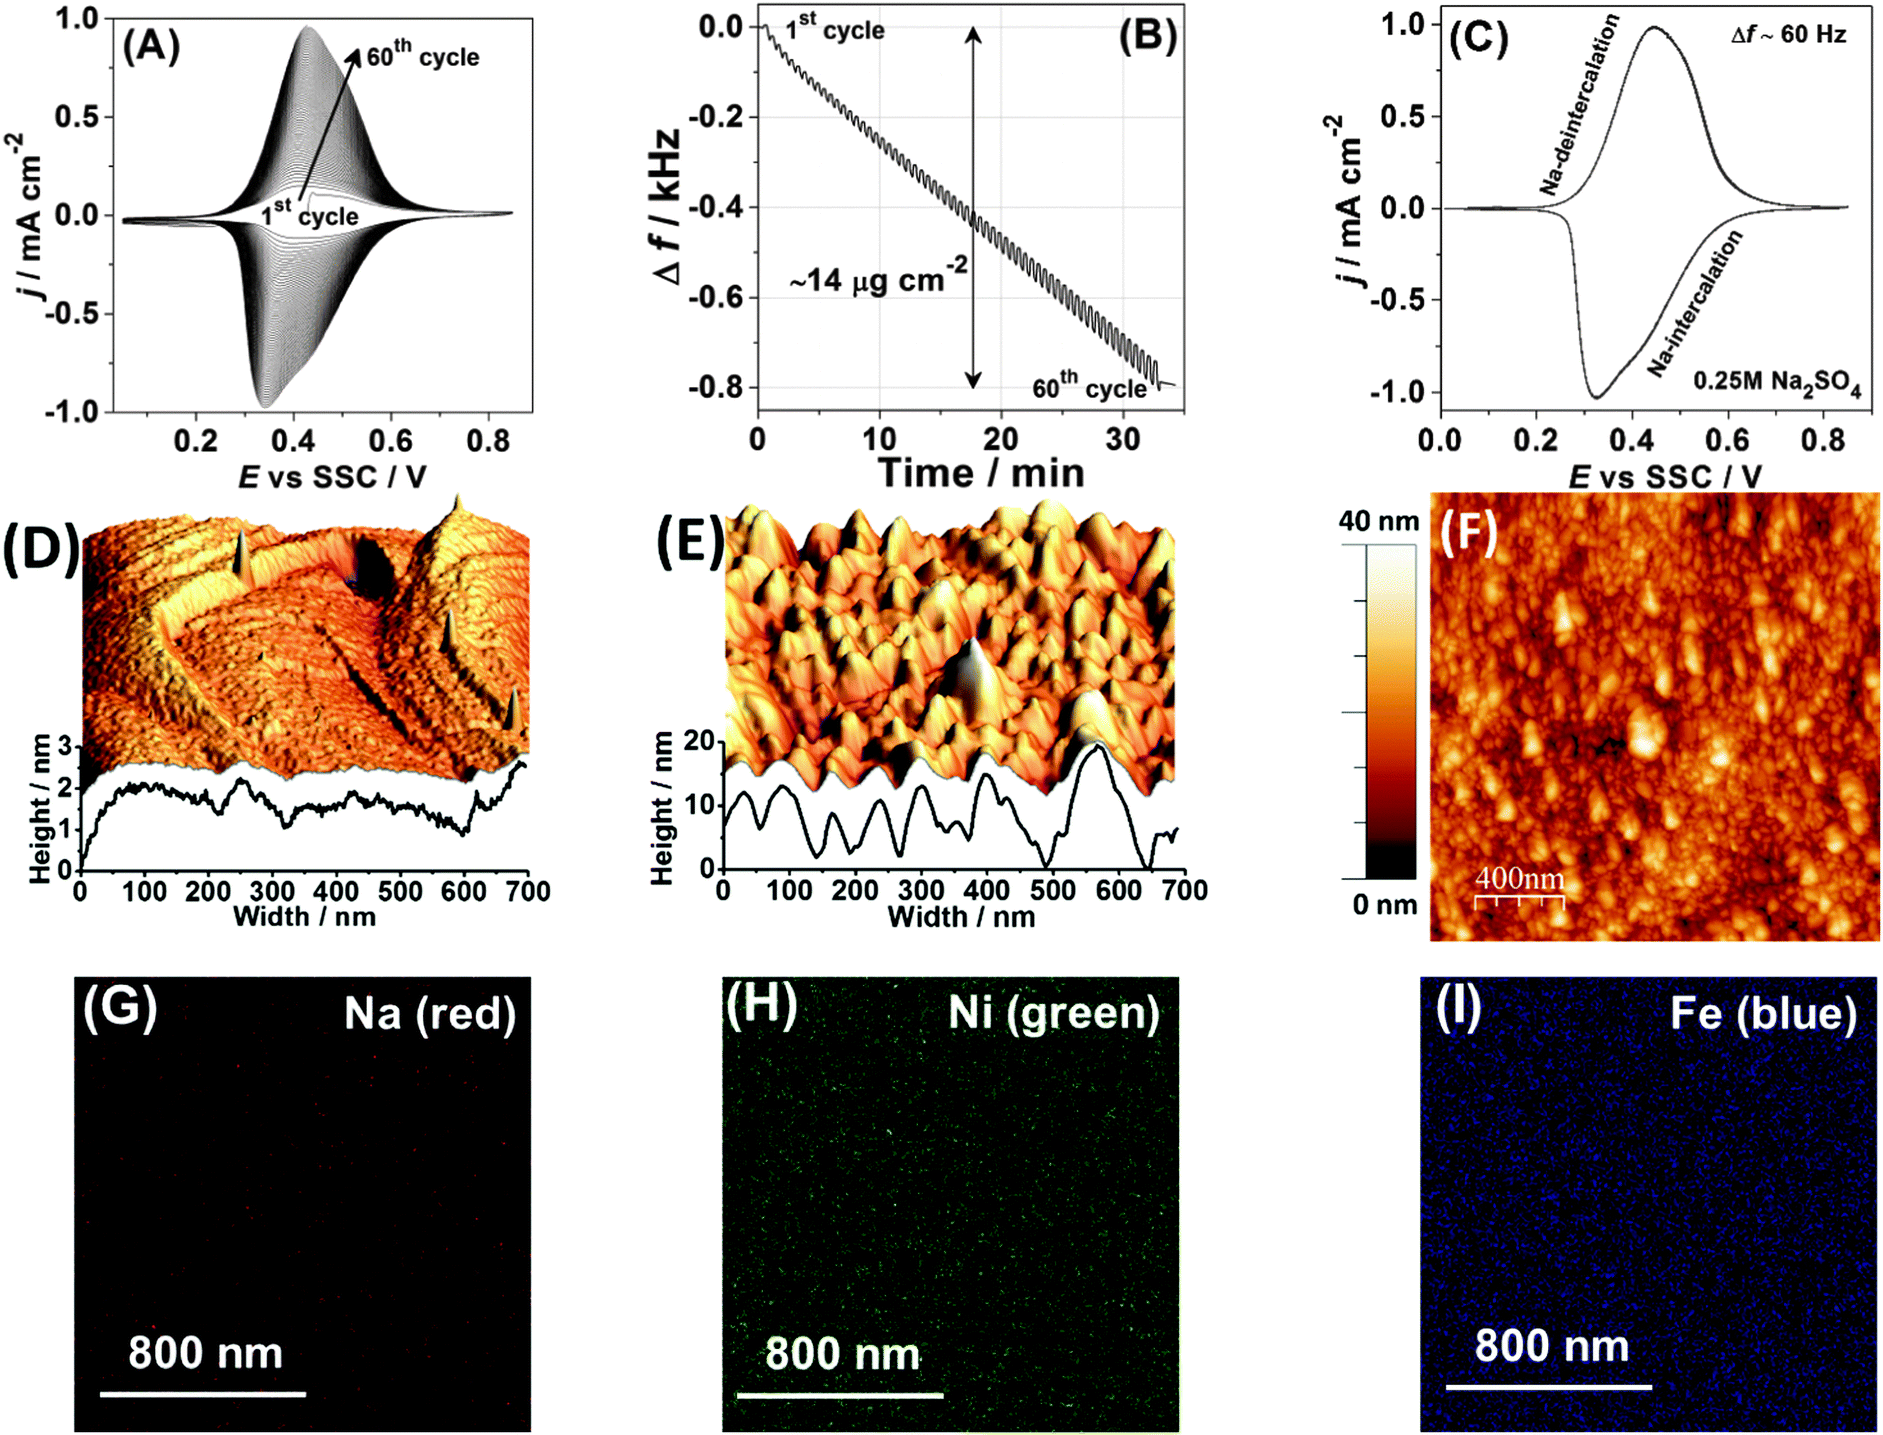 | ||
| Fig. 1 Characterisation of the Na2Ni[Fe(CN)6] thin films. (A) A typical cyclic voltammogram obtained during film deposition and (B) the corresponding electrode mass change, dE/dt = 50 mV s−1. (C) A typical cyclic voltammogram characterising Na intercalation/de-intercalation in aqueous 0.25 M Na2SO4 electrolyte. (D–F) AFM images comparing a reference metal single-crystal surface (D) before and (E and F) after deposition of the Na2Ni[Fe(CN)6] thin films. (G–I) Distribution of (G) Na, (H) Ni and (I) Fe in the resulting film (see ESI† for further details). | ||
Cyclic voltammetry, EQCM measurements and common battery tests were performed using different electrolytes including 1 M Na2SO4, 0.25 M Na2SO4, 0.25 M NaCl, 0.25 M NaNO3, 0.25 M NaClO4 and 0.25 M NaOAc (sodium acetate). Moreover, in order to determine the onset potential for intercalation of various alkali metal cations, further experiments also involved different 0.25 M aqueous solutions of MNO3 (where M = Li, Na, K, Rb, or Cs) at a scan rate of 50 mV s−1. Electrochemical impedance spectroscopy (EIS) characterisation of the Na2Ni[Fe(CN)6] thin films in 0.25 M Na2SO4 electrolytes was conducted using AC probing frequencies between 10 kHz and 0.5 Hz with a 10 mV amplitude of the probing signals in the potential range between 0.1 V and 0.8 V. The output of the fitting procedure was controlled by root-mean-square deviations and estimated individual parameter errors using home-made “EIS Data Analysis 1.0” software to ensure the validity of the model and correctness of the fitting, as described in detail elsewhere.28,29
The morphology and uniformity of the deposited thin films were investigated by SEM, electron microprobe and AFM. The atomic force microscope, utilised in this work, was a multimode EC-STM/AFM instrument (Veeco VI) with a Nanoscope IIID controller using the Nanoscope 5.31r1 software. All measurements were conducted in tapping mode (AFM tips, Bruker RTESP-300). SEM and electron microprobe images were obtained with a 20 kV beam using “Mira” from Tescan, Czech Republic, with an “INCA Energy 350” electron microprobe from Oxford Instruments Analytical, UK.
Further detailed information on experimental procedures, instrumentation and chemicals is available in the ESI.†
Results and discussion
The following electrochemical reaction was used to form thin films of Na2Ni[Fe(CN)6] under potentiodynamic conditions, as additionally described in detail in the ESI:†| 2Na+(aq) + Ni2+(aq) + [FeIII(CN)6]3−(aq) + 1e− → Na2Ni[FeII(CN)6](solid) |
Fig. 1A shows a typical cyclic voltammogram (CV), which characterises the deposition process. It should be noted here that CVs in each subsequent figure, related to the same type of experiments (for instance CVs of Na intercalation in 0.25 M Na2SO4 solutions), are shown for different sets of experiments intentionally in order to demonstrate a good reproducibility; however, some possible stability issues are not taken into account, as they are outside of the scope of this work. Anodic and cathodic peaks in the CV shown in Fig. 1A are due to the changes in the oxidation state of Fe in the forming Na2Ni[Fe(CN)6] film. It can be seen from Fig. 1A that the peak current increases with the potential cycles. The associated net electrode mass change measured using a quartz crystal microbalance is shown in Fig. 1B. A comparison of the resulting mass change at the end of the deposition process (∼14 μg cm−2) and the integrated charge from the CV (∼4.6 mC cm−2) gives, within ∼5% accuracy, the expected molar weight for Na2Ni[Fe(CN)6] (note that oscillations seen in Fig. 1B are due to intercalation and de-intercalation of sodium during the film formation). Fig. 1C shows a typical CV of the Na2Ni[Fe(CN)6] film in a pure aqueous 0.25 M Na2SO4 electrolyte characterising Na intercalation/de-intercalation (corresponding net electrode mass change is ∼1 μg cm−2, which is close to that expected, considering that only 50% of sodium is exchanged in the complete cycle). The resulting electrodes are relatively smooth (see the morphology and topology in Fig. 1D–F and the ESI†), with uniform distribution of the key elements, Na, Ni and Fe, as revealed by the electron microprobe technique (Fig. 1G–I).
A generally accepted scheme of Na intercalation and de-intercalation in aqueous systems in the case of Na2Ni[Fe(CN)6] cathode material is as follows:25
| NaNi[FeIII(CN)6] + Na+ + e− ↔ Na2Ni[FeII(CN)6] | (1) |
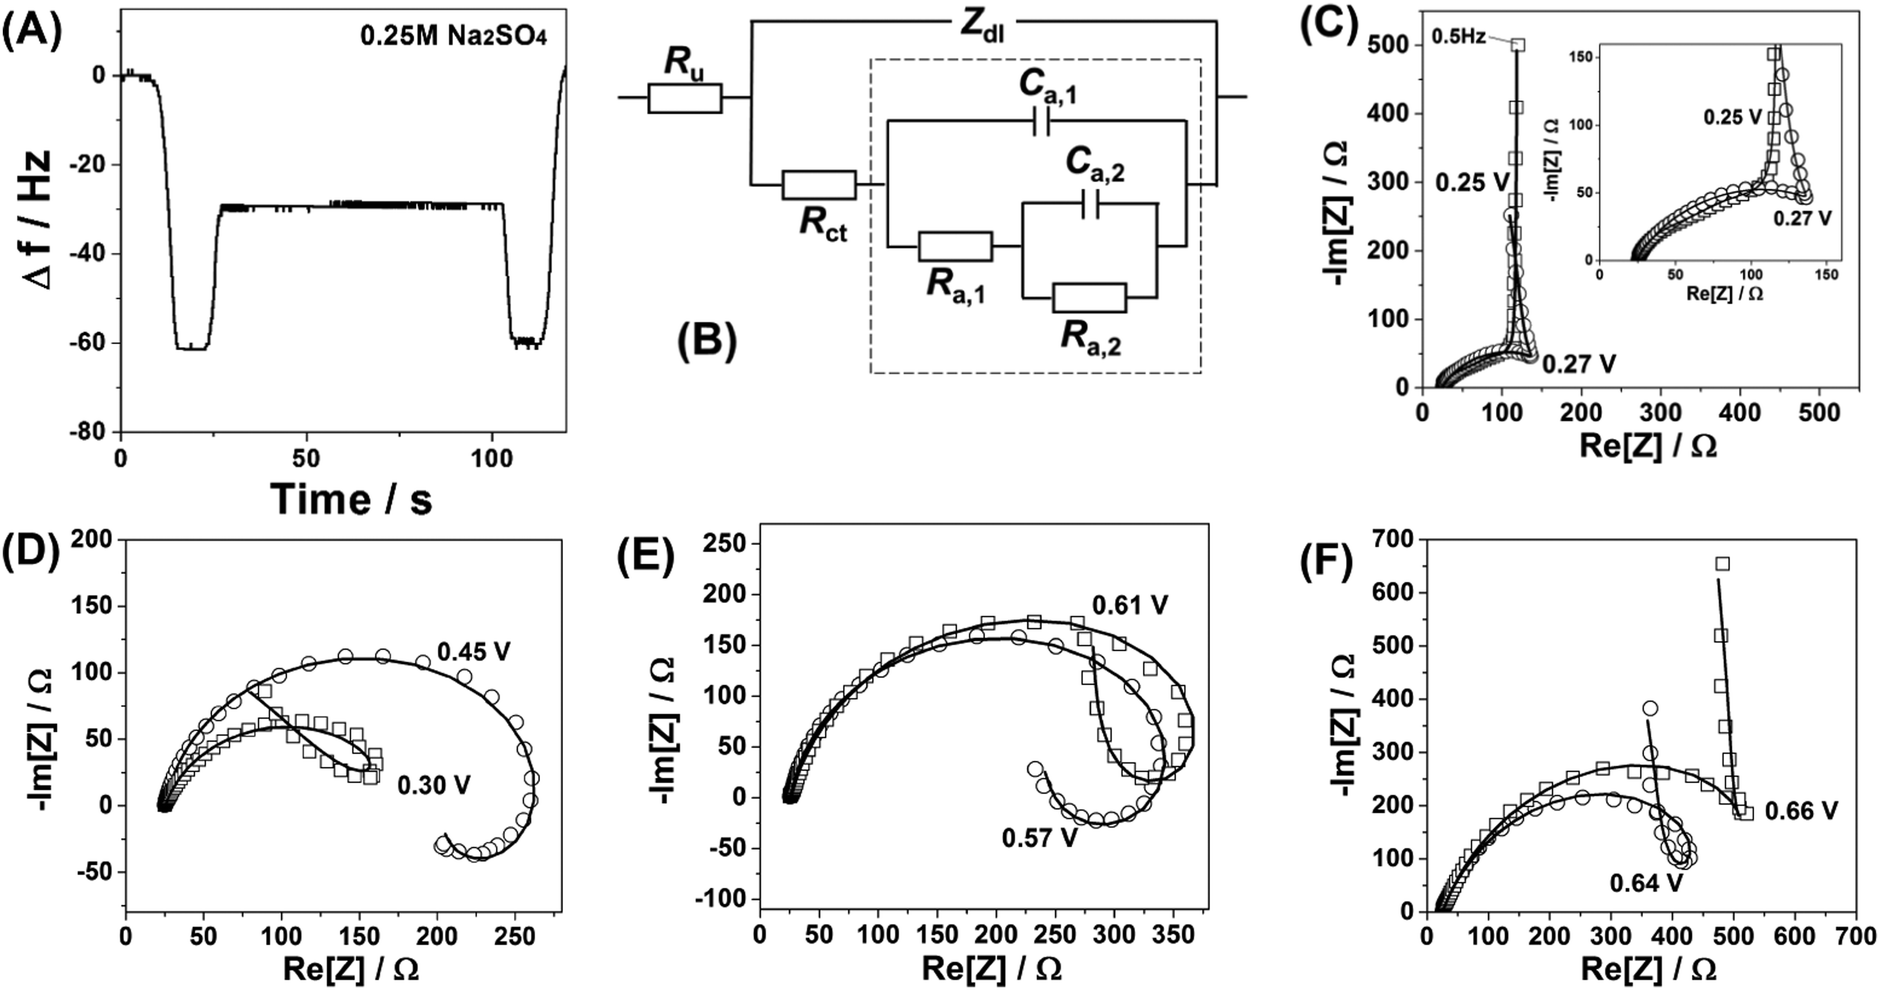 | ||
| Fig. 2 Characterisation of the Na2Ni[Fe(CN)6] thin films using impedance spectroscopy. (A) A typical electrode mass change curve confirming quasi-stationarity of the system within the time necessary to record one impedance spectrum. (B) Equivalent electric circuit reflecting the 3-stage mechanism (Ru, uncompensated resistance; Zdl, impedance of the double layer; Rct, charge transfer resistance; other R and C elements are adsorption (pseudo)resistances and (pseudo)capacitances, respectively, which are given by complex combinations of physicochemical parameters of adsorption/desorption (see text for details)). (C–F) Examples of impedance spectra (open symbols) at different electrode potentials together with the fitting (solid curves) to the model shown in (B). Inset in (C) shows the high frequency part of the same spectrum. | ||
Surprisingly, impedance spectra recorded at different electrode potentials at which Faradaic processes take place do not support the hypothesis about the simple one-stage mechanism of the interfacial process. Typical “loops” which can be seen in the spectra (Fig. 2C–F) suggest at least a three-stage mechanism involving two reversible “intermediate steps” with interfacial charge transfer, followed by a step which does not contribute to the net charge transfer through the interface (see ESI† for further details). The unique relation of the spectral shapes and the multi-stage mechanisms is well known and protocolled for various systems, as summarised in ref. 30. Furthermore, a relatively simple physical model which reflects the above-mentioned three-stage mechanism (Fig. 2B) fits well all the spectra for all the measured potentials, additionally verifying that the observed spectral shapes are not an experimental artifact due to, for example, contaminations, non-stationarity or non-linearity effects. Thus, a more complex model should be taken into account.
As a first approximation we propose the following three-stage mechanism capable of explaining the impedance data (for simplicity only de-intercalation is formally discussed, while all three steps are quasi-reversible):
(1) Electroactive step, i.e. oxidation of FeII, which proceeds comparatively fast due to the good electronic conductivity of the film (we use some arbitrary schematic designations in the equations below):
| Na2Ni[FeII(CN)6] − e− ↔ Na2Ni[FeIII(CN)6]+ | (2) |
| 2Na2Ni[FeIII(CN)6]+ + SO42− ↔ (Na2Ni[FeIII(CN)6])2SO4 | (3) |
| (Na2Ni[FeIII(CN)6])2SO4 ↔ 2Na+ + SO42− + 2NaNi[FeIII(CN)6] | (4) |
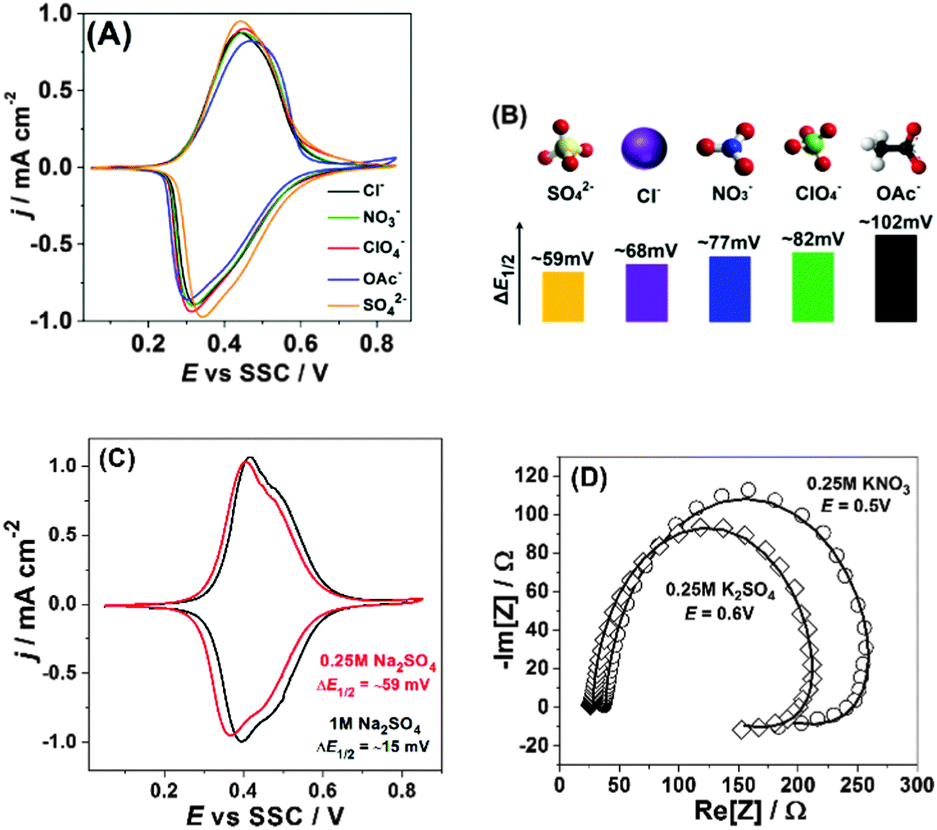 | ||
| Fig. 3 Influence of the nature of anions and their concentration on reversibility and mechanism of sodium intercalation to Na2Ni[Fe(CN)6]. (A) Typical CVs in the presence of different anions, dE/dt = 50 mV s−1. (B) Qualitative correlations between ΔE1/2 and the net charge density as well as the “symmetry” of the anions. (C) Effect of the sulfate-anion concentration on the voltammetric reversibility. (D) Impedance spectra (open symbols) and corresponding fitting results (solid curves, model is shown in Fig. 2B) in the presence of KNO3 and K2SO4. | ||
Fig. 3A shows how the nature of anions influences the peak shapes and so-called voltammetric reversibility, i.e. it reveals how fast intercalation and de-intercalation of sodium are as a function of the electrolyte composition. Noticeably, the corresponding peak separation becomes more and more evident if more “asymmetric” anions and/or anions with a lower net negative charge density are used, i.e. SO42− < Cl− < NO3− < ClO4− < OAc−. This trend cannot be easily explained by some electrolyte conductivity issues, as, for example, aqueous solutions of Na2SO4, NaCl and NaNO3 of these concentrations have very similar (within 2–3%) conductivities. However, the above-elucidated trend is in qualitative accordance with eqn (3), where efficient compensation of the excess “electrode charge” is necessary for the fast sodium exchange at the interface. Fig. 3B additionally illustrates this effect, in which the differences between the potentials of the “half-charged” and “half-discharged” states, ΔE1/2, are given for each anion used in this study.
Further evidence supporting the importance of the electrolyte composition for sodium interfacial transfer is given in Fig. 3C. The increase in the concentration of Na2SO4 not only shifts the potentials of Na intercalation/de-intercalation, as expected from the common rules; it also decreases the degree of CV-irreversibility between the “charging” and “discharging” cycles. Again, this effect cannot be easily explained by, for example, some electrolyte conductivity issues. It is even not proportional to the increase in the electrolyte conductivity (∼2 times). However, it is well in accordance with the requirement of fast and effective compensation of the effective charge at the interface (eqn (3)) and questioning the simple mechanism represented by eqn (1).
Moreover, Fig. 3D demonstrates that the observed shapes of the impedance spectra are not because of some specific electrolyte composition: changing the anions or cations does seem to be critical for the mechanism of the interfacial charge transfer itself in this case, further reducing the probability of misinterpretation of the CVs shown in Fig. 3A and C. Therefore, even relatively small changes in the electrolyte composition can play a very essential role in the interfacial charge transfer. Fig. 4A schematically illustrates the importance of the intermediate interfacial charge compensation from the electrolyte side during intercalation/de-intercalation. Additionally, Fig. 4B shows that the performance of an optimised system, even at a high C-rate (180 C), is very good, with the specific capacity (∼80 mA h g−1) being only ∼5% lower than the theoretically possible value for this material (see more experimental data in Fig. S8–S10 of the ESI†).
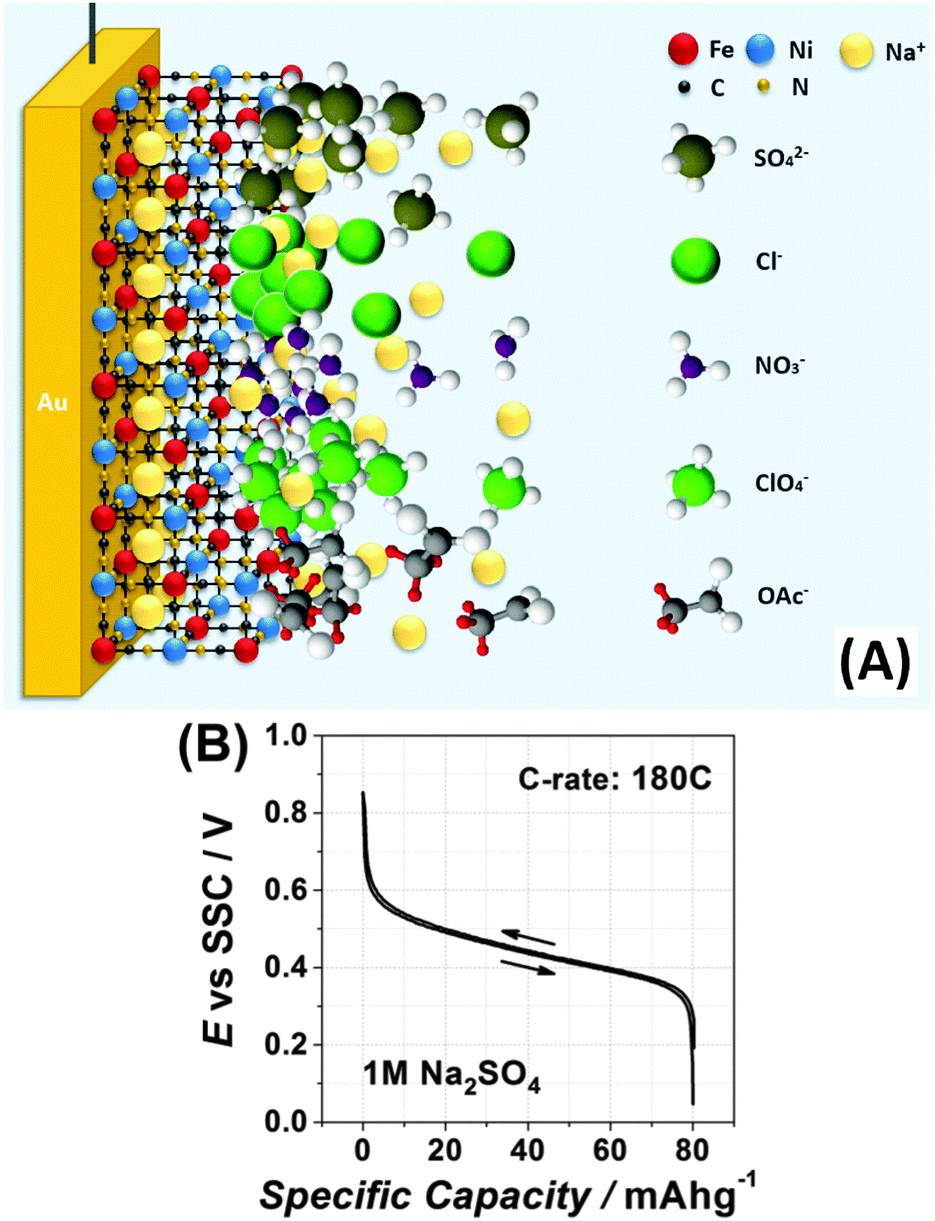 | ||
| Fig. 4 (A) Schematic representation of the situation when the temporal and spatial charge compensation is critical to enhance the interfacial charge transfer (see text for details). Due to a slower diffusion of alkali metal cations in the solid with respect to the liquid electrolyte side (illustrated as a deficiency of Na ions in the solid thin film), the comparatively immediate change in the oxidation state of Fe atoms in the film requires a fast response from the electrolyte side. The latter would depend on the concentration, effective charge density and geometry of, for example, anions. (B) Galvanostatic charge and discharge curves at 180 C for Na2Ni[Fe(CN)6] electrodes in 1 M Na2SO4. The galvanostatic cycling even at this very high C-rate shows a very low hysteresis resulting in high energy efficiencies. | ||
Another important parameter controlling the performance of secondary intercalation batteries is the potential at which intercalation starts. Very straightforward expectations about the capability of alkali metal cations to insert into the Na2Ni[Fe(CN)6]-like structures from the electrolyte side are associated with the size of the intercalating cations.31–33 According to these expectations, the larger the cation, the more difficult it is to be intercalated into the solid state structure; though it is still possible for all the cations from Li+ to Cs+ to do so in the case of Na2Ni[Fe(CN)6] (see schematics in Fig. 5A). Corresponding to this model, Cs+ should intercalate at much more negative potentials compared to e.g. Li+. However, what is observed experimentally is exactly the opposite, as was partially reported previously.34,35
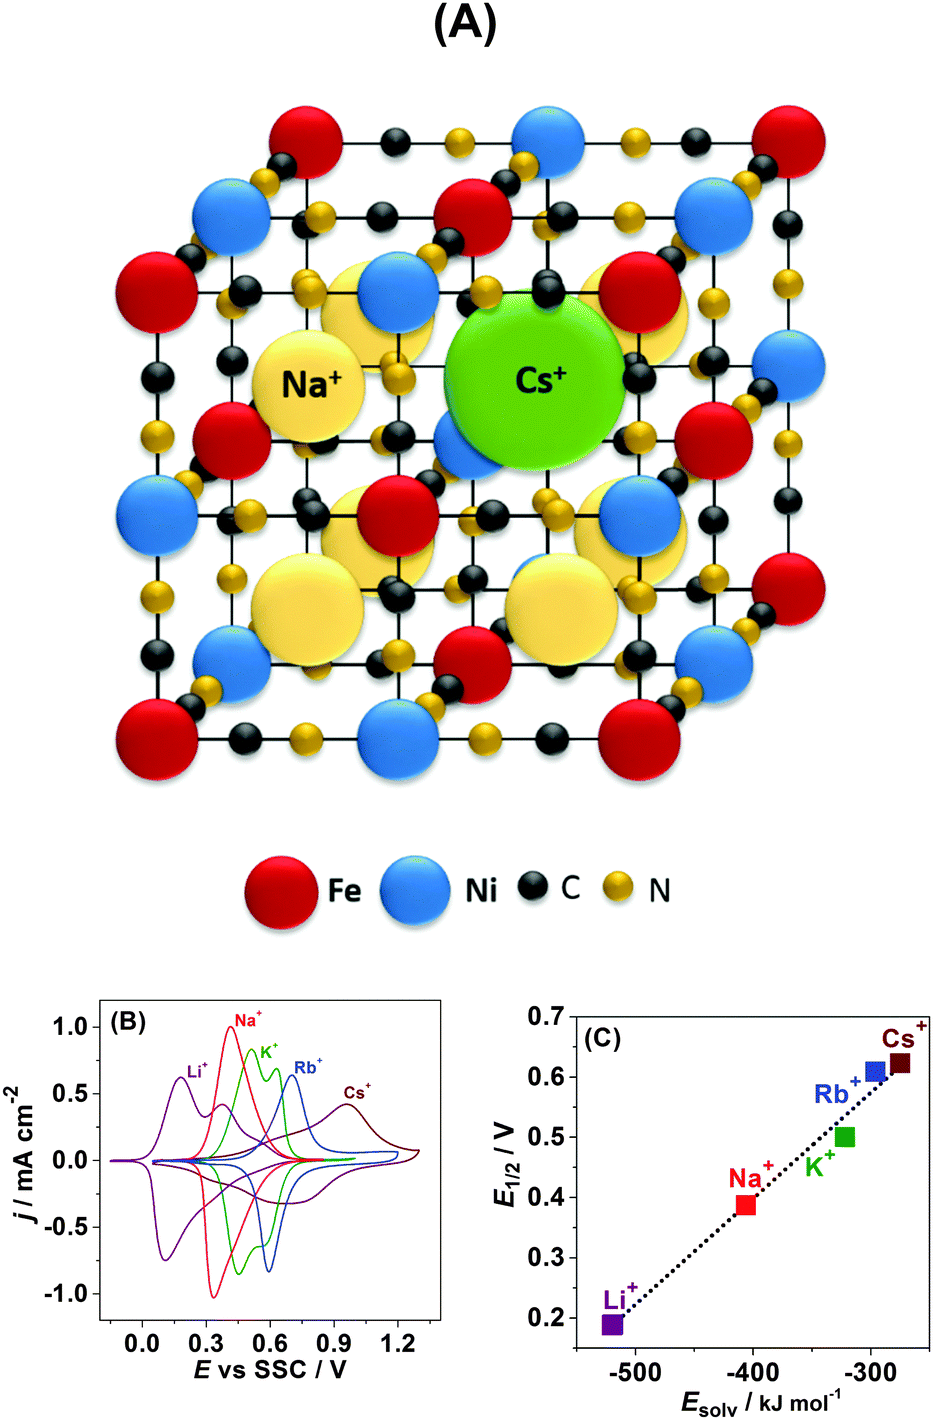 | ||
| Fig. 5 Cation size versus cation solvation effect on intercalation of alkali metal cations into Na2Ni[Fe(CN)6]. (A) Schematics of the Na2Ni[Fe(CN)6] crystal structure demonstrating that even Cs+ can be inserted (all atoms have approximately realistic relative sizes). (B) Typical cyclic voltammograms for Na2Ni[Fe(CN)6] in 0.25 M aqueous solutions of MNO3 (where M = Li, Na, K, Rb, or Cs), dE/dt = 50 mV s−1. (C) The potential of the “half-charged” state as a function of the alkali metal cation hydration energy. | ||
Fig. 5B displays typical CVs for Na2Ni[Fe(CN)6] in 0.25 M aqueous solutions of MNO3 (where M = Li, Na, K, Rb, or Cs). It can be seen that intercalation is possible for all five alkali metal cations. Moreover, our quartz crystal microbalance data (not shown here) suggest that even after tens of initial cycles the net reaction can be fairly described as follows:
| NaNi[FeIII(CN)6] + M+ + e− ↔ MNaNi[FeII(CN)6] |
Surprisingly, despite the biggest cation radius of Cs+, its insertion starts at the most positive electrode potentials followed by Rb+, K+, Na+, and Li+. Evidently, not only the cation size but other physicochemical parameters control the potential of their insertion. One of these parameters might be the ion hydration energy. Indeed if the potential of the half-charged state is plotted as a function of the alkali metal cation hydration energy, a statistically relevant linear correlation is observed (Fig. 5C).
Conclusions
In summary, we have further emphasised the importance of the electrolyte composition for the kinetics and mechanisms of interfacial charge transfer during intercalation/de-intercalation of sodium in the cathode materials for Na-ion batteries. Answering the question stated in the title of this paper, the commonly accepted models of Na intercalation in aqueous media, including a variety of theoretical ones, are likely to be too oversimplified affecting the strategies of the development of new materials for large-scale energy storage schemes. In particular, the nature of the anions present in the electrolyte significantly influences the intercalation/de-intercalation. On the other hand, solvation effects are probably among the main parameters governing the potential of alkali metal intercalation.Consequently, more sophisticated models for Na intercalation in aqueous media need to be further elaborated to account for the observed trends. This will enhance our fundamental understanding and thus the performance of such Na-ion battery systems in the future.
Acknowledgements
Financial support from SFB 749, the cluster of excellence Nanosystems Initiative Munich (NIM) is gratefully acknowledged.References
- V. S. Arunachalam and E. L. Fleischer, MRS Bull., 2008, 33, 264–276 CrossRef CAS.
- J. P. Holdren, Science, 2007, 315, 737 CrossRef CAS PubMed.
- D. Ginley, M. A. Green and R. Collins, MRS Bull., 2008, 33, 355–364 CrossRef CAS.
- Z. G. Yang, J. L. Zhang, M. C. W. Kintner-Meyer, X. C. Lu, D. W. Choi, J. P. Lemmon and J. Liu, Chem. Rev., 2011, 111, 3577–3613 CrossRef CAS PubMed.
- B. Dunn, H. Kamath and J. M. Tarascon, Science, 2011, 334, 928–935 CrossRef CAS PubMed.
- G. L. Soloveichik, Annu. Rev. Chem. Biomol. Eng., 2011, 2, 503–527 CrossRef CAS PubMed.
- M. Armand and J. M. Tarascon, Nature, 2008, 451, 652–657 CrossRef CAS PubMed.
- J. M. Tarascon and M. Armand, Nature, 2001, 414, 359–367 CrossRef CAS PubMed.
- V. Etacheri, R. Marom, R. Elazari, G. Salitra and D. Aurbach, Energy Environ. Sci., 2011, 4, 3243–3262 CAS.
- J. Y. Luo and Y. Y. Xia, Adv. Funct. Mater., 2007, 17, 3877–3884 CrossRef CAS.
- P. C. K. Vesborg and T. F. Jaramillo, RSC Adv., 2012, 2, 7933–7947 RSC.
- Y. Wu, X. Dai, J. Ma and Y. Chen, Lithium Ion Batteries: Practice and Applications, Chemical Industry Press, Beijing, 2004 Search PubMed.
- W. Tang, Y. S. Zhu, Y. Y. Hou, L. L. Liu, Y. P. Wu, K. P. Loh, H. P. Zhang and K. Zhu, Energy Environ. Sci., 2013, 6, 2093–2104 CAS.
- Z. Chang, Y. Q. Yang, M. X. Li, X. W. Wang and Y. P. Wu, J. Mater. Chem. A, 2014, 2, 10739–10755 CAS.
- W. Tang, L. L. Liu, Y. S. Zhu, H. Sun, Y. P. Wu and K. Zhu, Energy Environ. Sci., 2012, 5, 6909–6913 CAS.
- Y. G. Wang, J. Yi and Y. Y. Xia, Adv. Energy Mater., 2012, 2, 830–840 CrossRef CAS.
- H. L. Pan, Y. S. Hu and L. Q. Chen, Energy Environ. Sci., 2013, 6, 2338–2360 CAS.
- S. Ferlay, T. Mallah, R. Ouahes, P. Veillet and M. Verdaguer, Nature, 1995, 378, 701–703 CrossRef CAS.
- Y. H. Lu, L. Wang, J. G. Cheng and J. B. Goodenough, Chem. Commun., 2012, 48, 6544–6546 RSC.
- L. Wang, Y. H. Lu, J. Liu, M. W. Xu, J. G. Cheng, D. W. Zhang and J. B. Goodenough, Angew. Chem., Int. Ed., 2013, 52, 1964–1967 CrossRef CAS PubMed.
- H. W. Lee, R. Y. Wang, M. Pasta, S. W. Lee, N. Liu and Y. Cui, Nat. Commun., 2014, 5, 5280 CrossRef CAS PubMed.
- C. D. Wessells, R. A. Huggins and Y. Cui, Nat. Commun., 2011, 2, 550 CrossRef PubMed.
- M. Pasta, C. D. Wessells, R. A. Huggins and Y. Cui, Nat. Commun., 2012, 3, 1149 CrossRef PubMed.
- M. Pasta, C. D. Wessells, N. Liu, J. Nelson, M. T. McDowell, R. A. Huggins, M. F. Toney and Y. Cui, Nat. Commun., 2014, 5, 3007 Search PubMed.
- H. Kim, J. Hong, K.-Y. Park, H. Kim, S.-W. Kim and K. Kang, Chem. Rev., 2014, 114, 11788–11827 CrossRef CAS PubMed.
- C. D. Wessells, S. V. Peddada, R. A. Huggins and Y. Cui, Nano Lett., 2011, 11, 5421–5425 CrossRef CAS PubMed.
- X. Y. Wu, Y. L. Cao, X. P. Ai, J. F. Qian and H. X. Yang, Electrochem. Commun., 2013, 31, 145–148 CrossRef CAS.
- A. S. Bondarenko, Anal. Chim. Acta, 2012, 743, 41 CrossRef CAS PubMed.
- A. S. Bondarenko and G. A. Ragoisha, in Progress in Chemometrics Research, ed. A. L. Pomerantsev, 2005, pp. 89–102 Search PubMed.
- A. Lasia, Electrochemical Impedance Spectroscopy and its Applications, Springer-Verlag, New York, 2014, p. 367 Search PubMed.
- K. Itaya, I. Uchida and V. D. Neff, Electrochemistry of polynuclear transition metal cyanides: prussian blue and its analogues, Acc. Chem. Res., 1986, 19(6), 162–168 CrossRef CAS.
- N. Bagkar, C. A. Betty, P. A. Hassan, K. Kahali, J. R. Bellare and J. V. Yakhmi, Thin Solid Films, 2006, 497(1–2), 259–266 CrossRef CAS.
- W. Jin, A. Toutianoush and M. Pyrasch, et al. , J. Phys. Chem. B, 2003, 107(44), 12062–12070 CrossRef CAS.
- M. A. Malik, P. J. Kuelsza and R. Marrassi, Electrochim. Acta, 2004, 49, 4253–4258 CrossRef CAS.
- W. Chen, J. Tang and X.-H. Xia, J. Phys. Chem. C, 2009, 113, 21577–21581 CAS.
Footnote |
| † Electronic supplementary information (ESI) available: Experimental details, additional experimental data and data analysis. See DOI: 10.1039/c5ee03197d |
| This journal is © The Royal Society of Chemistry 2016 |