 Open Access Article
Creative Commons Attribution 3.0 Unported Licence
Mechanistic insights into excited state intramolecular proton transfer in isolated and metal chelated supramolecular chemosensors†
Tolga N. V.
Karsili
*ab,
Barbara
Marchetti
ab and
Michael N. R.
Ashfold
 b
b
aDepartment of Chemistry, Technische Universität München, Lichtenbergstrasse 4, 85748, Garching, Germany. E-mail: tolga.karsili@tum.de
bSchool of Chemistry, University of Bristol, Cantock's Close, Bristol, BS8 1TS, UK
First published on 8th November 2016
Abstract
We report a computational study of excited state intramolecular proton transfer in a series of related and progressively more complex organic chromophores ranging from 2-(2′-hydroxyphenyl)-benzoxazole (HBO) through to the 5-(benzo[d]oxazol-2-yl)-2-(4-((bis(pyridin-2-ylmethyl)amino)methyl)benzo[d]oxazol-2-yl)-4 hydroxyphenolate (HDBO′) anion. The latter chelates group 12 metal cations (X = Zn2+, Cd2+ and Hg2+), and can serve as a fluorescence-based sensor for such metals. Initial π* ← π excitation of the ground (S0) state enol-tautomer induces charge separation in the first excited singlet (S1) state and drives the subsequent proton transfer (i.e. enol → keto tautomerism). The keto-tautomer constitutes a local minimum on the S1 PES, and is responsible for highly Stokes shifted fluorescent emission; S1(enol) → S0 fluorescence is proposed to account for the shorter wavelength emission from the X–HDBO′ complexes. Derivatives of HDBO′ that should retain the favourable visible absorption and heavily Stokes shifted emission properties but, additionally, offer higher fluorescence quantum yields (i.e. enhanced metal sensing capability) are proposed.
1. Introduction
Luminescent sensors are typically functionalised supramolecules that enhance or quench fluorescence (or phosphorescence) upon an external stimulus, such as a change in the chemical environment.1,2 Such species are generally optimised synthetically in order to maximise their selectivities and specificities whilst steering their photophysical properties towards a particular intended function. Many studies have focussed on the synthesis of luminescent supramolecules that are specific for the detection of malignant tumours.3 Upon detection and subsequent complexation to specific markers released by cancerous tissue, changes to the luminescence signal and the Stokes shift reveal their specific positions and activities, thus enhancing the efficiency and efficacy of the diagnosis. Hence the major interest in photochemically active supramolecules as bio-diagnostics.4,5Trace metal detection in, for example, water supply systems is another crucial analytical problem and one that is required for the regulation of safe drinking water.6 Supramolecular systems that are benign towards human health are ideal for this purpose, allowing their addition to the water supply to test and ultimately regulate the concentrations of trace metals. Binding of such metals to the supramolecule causes a measurable (photo)chemical change. One such example is the detection of alkali metal cations using N-bridgehead cryptand-naphthalene supramolecules which, when cation-bound, fluoresce following electronic excitation.7 In the absence of the metal, however, photoexcitation of the free supramolecule causes photo-induced electron transfer (PET) from the naphthalene donor to the cryptand-hole acceptor; the fluorescence quantum yield is negligible. The mechanisms responsible for this switch in behaviour are, as yet, poorly understood.
Other studies have demonstrated the tunability of such supramolecular sensors.8–10 Aza-crown ethers, for example, with chromophores (such as coumarin) attached to both ends, have been shown to exhibit similar, but opposite, PET and fluorescence propensities, i.e. the supramolecule fluoresces when metal-free but undergoes PET when metal-bound.11 These systems are also referred to as molecular LOGIC switches, since they ‘switch’ the fluorescence or PET signal ‘on’ or ‘off’ depending on the presence or absence of the intended ‘to be detected’ solute.12 In these specific examples, sensing relies on a change in the electronic properties of the sensor upon chelation with the alkali metal. Such donor–acceptor supramolecules can also be tuned, synthetically, in order to function as molecular nanowires.13–16
As well as changes in electronic structure, molecules used as luminescent probes can also undergo geometry changes upon chelation and/or (subsequent) photoexcitation. One notable example is E-diazobenzene, which can function as a molecular photo-switch upon irradiation with light and has found application in pH sensing, photochromism and in nonlinear optics.17 These applications all rely on the same photophysics: upon near-UV irradiation, E-diazobenzene undergoes E → Z photoisomerism on the excited state potential energy surface (PES), followed by rapid internal conversion (IC) and subsequent branching into either Z- (30%) or E-diazobenzene (70%) on the ground state PES. The timescales of such E → Z photoisomerisms and subsequent IC processes are typically ultrafast – sub-ps in the specific case of diazobenzene, as revealed by transient absorption studies in deuterated dimethyl sulfoxide18 and n-hexane solutions.19 Such ultrafast IC is generally associated with the presence of low energy crossings between adiabatic PESs which, when orthogonal motions are considered, develop into conical intersections (CIs).20 CIs are ubiquitous in photochemically and excited state driven phenomena and are recognised as regions of the PES that promote efficient transfer of excited state population back to the ground state (or between excited states). Such processes are termed non-adiabatic, as the electronic and nuclear motions are usually strongly coupled.
Non-adiabatic processes can be driven by a variety of nuclear motions, but the present study focusses on proton/electron coupled motions – commonly referred to as proton-coupled electron transfer (PCET) processes – which drive much of the redox chemistry associated with transition metal complexes.21 In a hydrogen-bonded complex, photoinduced-PCET occurs when light absorption initiates electron promotion from an acidic donor (D) orbital to a hitherto unoccupied, basic acceptor (A) orbital. This creates a D+H–A− charge-separated (CS) excited state that is neutralised by transfer of a proton from D to A. The potential energy of a CS excited state almost always decreases upon proton transfer (PT), i.e. there is a driving force for PT in a CS excited state. The ground state, in contrast, is stable in the closed-shell DH–A configuration, so its PES shows a large barrier with respect to PT. Thus the CS and ground state potentials inevitably cross along the PT coordinate and the resulting CI facilitates non-adiabatic decay of CS state population to the ground state – i.e. facilitates ultrafast PCET. In cases where the PT occurs at short range, the charge separation in the excited CS state may not fully neutralise and further nuclear rearrangements may be necessary to cancel the remaining charge-separation ultimately leading to a curve crossing.22–25 Such molecular distortions may be restricted in strained molecular systems, however. In these cases, the excited state population may be trapped in a metastable CS state, which then decays to the ground state by an alternative route, by interacting with surrounding solvent molecules or, in extreme cases, by fluorescing. The fluorescence from such constrained systems can be exploited when designing effective supramolecular fluorescent probes22,23,26 – as we illustrate here. The class of (supra-)molecular sensors known to function via PCET is still rather small but, as shown in a recent review,27 is growing fast.
The present study explores the mechanism of excited state intramolecular proton-transfer (ESIPT) (a specific class of PCET) in a series of organic chromophores that can be tuned synthetically so as to function as supramolecular chemosensors for trace metal detection. We start with 2-(2′-hydroxyphenyl)-benzoxazole (HBO, depicted in Fig. 1), which is known to undergo ESIPT upon electronic excitation.27 Transient absorption measurements following 340 nm excitation of HBO in cyclohexane solution show enol → keto tautomerism occurring as a result of ESIPT on a timescale of ∼100 fs or less28–31 – consistent with the results of mixed quantum/classical molecular dynamics calculations by Daengngern et al.32 The thio-analogue of HBO has also been studied recently by Barbatti and co-workers33 who proposed, on the basis of the deduced ultrafast excited state intra- and inter-molecular PT, that this molecule could be a good candidate for use as a protein fluorescent marker.
The potential utility of the fast and efficient ESIPT in HBO is likely to be limited by its absorption maximum (λabs(max) ∼330 nm), however, which is much shorter than the (visible) wavelengths preferred for supramolecular sensing applications.34 Adding another benzoxazole to HBO yields 2-(2′-hydroxyphenyl)-dibenzoxazole (HDBO, termed bis(HBO) in ref. 34, and also shown in Fig. 1), shifts the absorption maximum closer to the visible (λabs(max) = 412 nm) and still maintains the ESIPT upon photoexcitation.34 Functionalising HDBO with N,N-dipyridylmethylamine results in formation of 5-(benzo[d]oxazol-2-yl)-2-(4-((bis(pyridin-2-ylmethyl)amino)methyl)benzo[d]oxazol-2-yl)-4 hydroxyphenolate (henceforth termed HDBO′, but abbreviated as Zinhbo-1 in ref. 34). Protonated HDBO′ shows a similar absorption maximum λabs(max) ∼410 nm in non-polar solvents, attributable to the neutral free ligand, and a weak fluorescent emission centred at λem = 543 nm (i.e. a Stokes shift of ∼130 nm). HDBO′ is of particular interest as a ligand sensor for trace metal detection in more polar solvents. The group 12 X–HDBO′ complexes (X = Zn2+, Cd2+ and Hg2+, with the phenol proximal to the cation deprotonated, also illustrated in Fig. 1) show much larger Stokes shifts than bare HDBO′. Zn2+–HDBO′, for example, shows λabs(max) ∼480 nm both in DMSO and in aqueous solution, and λem = 712 nm – a spectacularly large Stokes shift of ∼230 nm.34
The present work reports gas phase (isolated molecule) electronic structure calculations designed to offer mechanistic insights into these photoinduced turn-on processes. Specifically, we explore the topographies of the excited state PESs that support these efficient ESIPT processes, the origin of the large differences in Stokes shift upon progressing from HBO to HDBO to X–HDBO′, and the ways in which chelation with metal ions affects the potential energy (PE) profile along the ESIPT coordinate and the Stokes shift. In so doing, we also suggest ways in which it may be possible to enhance the fluorescence quantum yield (i.e. the sensor sensitivity) by further chemical modification of the HBDO′ ligand in an effort to reduce the efficiency of competing non-radiative excited state decay pathways.
2. Computational methodology
Using the Gaussian 09![[thin space (1/6-em)]](https://www.rsc.org/images/entities/char_2009.gif) 35 computational package, the ground state minimum energy geometries of all species of current interest were optimized using the long-range correlated Coulomb Attenuated Model Becke-3rd parameter-Lee–Yang–Parr (CAM-B3LYP) functional36 in Density Functional Theory (DFT).
35 computational package, the ground state minimum energy geometries of all species of current interest were optimized using the long-range correlated Coulomb Attenuated Model Becke-3rd parameter-Lee–Yang–Parr (CAM-B3LYP) functional36 in Density Functional Theory (DFT).
Relaxed PE profiles for the ground and first few excited electronic states of all systems investigated were scanned along the ESIPT coordinate using time dependent (TD)-DFT/CAM-B3LYP using the O1–H bond length RO1–H, as the driving coordinate. A 6-31G(d)37 Pople basis set was used for all first and second row atoms (i.e. H, C, N and O), together with 6-31G(d) (for Zn) and LANL2DZ38 (for Cd and Hg) basis functions for calculations of the metal complexes.
S1–S0 absorption profiles of HBO and HDBO were simulated using Newton-X,39,40 by first generating an ensemble of 100 initial geometries (N) – sampled using a Wigner distribution based on the ground state normal mode harmonic wavenumbers (calculated using the system specific level of theory described above). Following ref. 41, the vertical excitation energy and oscillator strength were then calculated for each of the N initial geometries using TD-DFT/CAM-B3LYP/6-31G(d) and the excitation energy dependent photoabsorption cross section P(E) obtained using eq. (1)
 | (1) |
The internal sum in eqn (1) is over the set of Wigner points (Ntot = 100) while the external sum includes transitions from the initial state (i, the S0 state) to final states (j = S1, S2 and S3 in the present modelling) with respective oscillator strengths fij. Rk represents the initial coordinates of the Nth point and g(E − ΔE(Rk),δ) is a Lorentzian line shape function given by eqn (2)
 | (2) |
3. Results and discussion
3.1. Ground state minimum energy geometry and vertical excitation energies
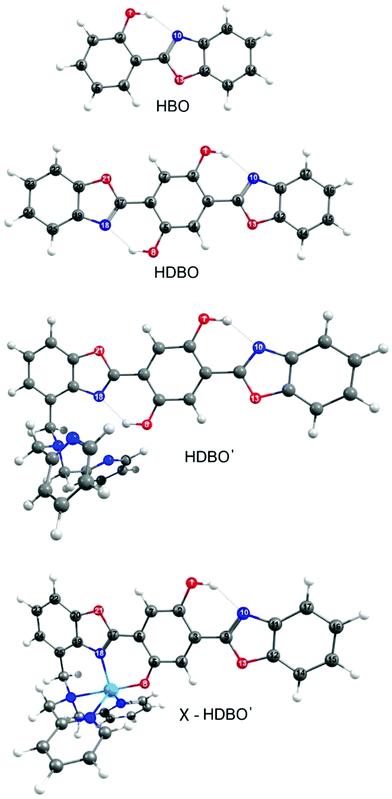
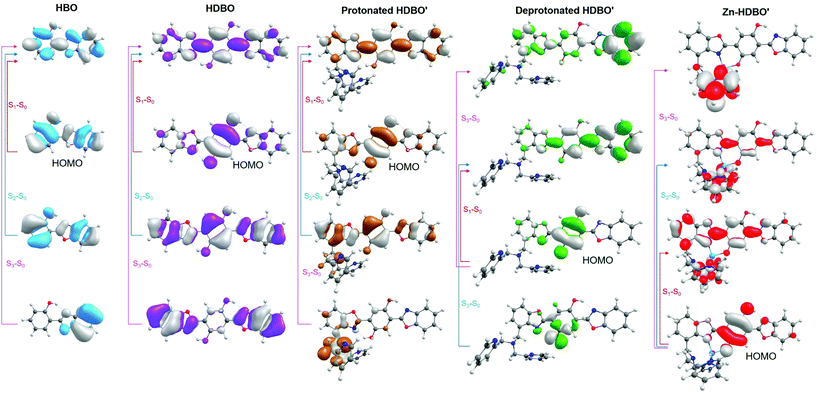
Fig. 1 showed the ground state minimum energy geometries of HBO, HDBO, protonated HDBO′ and Zn2+–HDBO′. The Cd2+–HDBO′ and Hg2+–HDBO′ complexes display the same structural arrangement as Zn2+–HDBO′ and are thus only shown in Fig. S1 of the ESI.† The minimum energy structure in each case involves planar HBO and HDBO moieties. The acidic O(1)–H group shows an intramolecular hydrogen bond with the basic N(10) atom in all species, as does the O(8)–H group (with the N(18) atom) in HDBO and protonated HDBO′; both of these N atoms possess an in-plane lone pair that can act as the hydrogen bond acceptor.Table 1 lists vertical excitation energies (VEEs) and oscillator strengths for the Sj ← S0 (j = 1–3) transitions returned by the TD-DFT calculations for all systems featured in the present study, while the dominant associated orbital promotions are shown in Fig. 2. For completeness, the calculated VEEs to the corresponding triplet excited states are also included in Table 1; the PE profiles of some of the latter states will be considered later, when considering the metal complexes (vide infra).
| i | Vertical excitation energy/eV | Sj–S0 oscillator strength, f | |
|---|---|---|---|
| Si | Ti | ||
| HBO | |||
| 1 | 4.34 | 2.96 | 0.447 |
| 2 | 4.97 | 3.62 | 0.261 |
| 3 | 5.37 | 3.63 | 0.063 |
| HDBO | |||
| 1 | 3.40 | 2.31 | 0.538 |
| 2 | 4.36 | 2.86 | 0.988 |
| 3 | 4.95 | 3.32 | 0.000 |
| Protonated HDBO′ | |||
| 1 | 3.40 | 2.31 | 0.508 |
| 2 | 4.34 | 2.87 | 0.921 |
| 3 | 4.76 | 3.29 | 0.012 |
| Deprotonated HDBO′ | |||
| 1 | 2.22 | 1.02 | 0.251 |
| 2 | 3.11 | 2.75 | 0.000 |
| 3 | 3.58 | 2.95 | 0.166 |
| Zn2+–HDBO′ | |||
| 1 | 2.96 | 1.92 | 0.335 |
| 2 | 3.75 | 2.70 | 0.001 |
| 3 | 3.81 | 3.30 | 0.000 |
| Cd2+–HDBO′ | |||
| 1 | 2.82 | 1.83 | 0.307 |
| 2 | 3.56 | 2.61 | 0.002 |
| 3 | 3.63 | 3.21 | 0.000 |
| Hg2+–HDBO′ | |||
| 1 | 2.81 | 1.84 | 0.286 |
| 2 | 3.59 | 2.61 | 0.002 |
| 3 | 3.66 | 3.21 | 0.000 |
The first three singlet excited states of HBO and HDBO are each calculated to be of ππ* character. In both cases, the excitation from the π highest occupied molecular orbital (HOMO) to the lowest unoccupied π* (LUMO) as shown in Fig. 2 is calculated to contribute >80% of the total weight of the S1–S0 transition. These transitions have appreciable oscillator strengths, and their respective VEEs are in reasonable accord with the long wavelength absorption maxima determined by experiment. The calculated S1–S0 VEE in HBO (Table 1) corresponds to a wavelength λabs, calc ∼285 nm (cf. the experimental λabs(max) ∼330 nm), while the equivalent comparison in the case of HDBO is λabs, calc ∼365 nm, cf. λabs(max) ∼412 nm.34 We should expect this (already acceptable) level of agreement between theory and experiment to improve further once zero-point energy differences are included. The S2–S0 and S3–S0 transitions are only poorly described in terms of single orbital promotions; in both molecules, the orbital promotions shown in Fig. 2 are calculated to be dominant, but only to contribute ∼40% of the total transition strength.
The electronic promotions responsible for the S1 and S2 states of protonated HDBO′ are analogous to those for HDBO, whereas the largest contributor to the S3 state is predicted to involve electron promotion from an orbital centred on the N,N-dipyridylmethylamine group to the analogous π* LUMO as in HDBO. Theory (Table 1) and experiment both suggest that functionalization with N,N-dipyridylmethylamine has little impact on the long wavelength S1–S0 absorption of HDBO.
Upon deprotonating O(8), this and the N(18) atom are now both effective donor sites enabling complexation to metal atoms with low oxidation states. The same orbital promotions dominate when forming the S1 states of protonated and deprotonated HDBO′ but, as Table 1 shows, the calculated VEE of the S1–S0 transition in the latter is significantly reduced. This can be rationalised in light of the loss of conjugation upon deprotonating O(8). As Fig. 2 shows, deprotonating HDBO′ destabilises the HOMO by increasing the π-density on O(8) and thus reducing the conjugation of the C(5)![[double bond, length as m-dash]](https://www.rsc.org/images/entities/char_e001.gif) O(18) bond. The π* LUMO, in contrast, is largely unaffected. Thus the net effect of deprotonating O(8) is a reduction in the HOMO–LUMO energy gap – consistent with the bathochromic shift of the S1–S0 absorption maximum observed for the singly deprotonated, unchelated HDBO′ moiety in aqueous solution.34
O(18) bond. The π* LUMO, in contrast, is largely unaffected. Thus the net effect of deprotonating O(8) is a reduction in the HOMO–LUMO energy gap – consistent with the bathochromic shift of the S1–S0 absorption maximum observed for the singly deprotonated, unchelated HDBO′ moiety in aqueous solution.34
The visible absorption maximum shifts further upon chelation with Zn2+, Cd2+ or Hg2+. The metal atoms in these complexes all have filled d shells so, as Fig. 2 shows, the HOMO in each case is similar to that in HDBO and the first excited states are formed by ligand centred π* ← π transitions. As Table 1 shows, the respective S1–S0 transitions are each predicted to have substantial oscillator strengths and to show a bathochromic shift relative to the corresponding transitions in HBO, HDBO and protonated HDBO′ – again in accord with experimental observation34 – but to be blue-shifted relative to that in deprotonated HDBO′. The latter trend is understandable in terms of a partial recovery of conjugation within the ligand π-system induced by dative bonding to the metal centre. We recognise that heavy metal species like Hg2+, in particular, are likely to induce strong spin–orbit coupling, but the inclusion of such effects is beyond the scope of the present work. The S2–S0 and S3–S0 transitions in these X–HDBO′ complexes also involve π* ← π excitations. Reference to Fig. 2 and S1† suggests that the energetic ordering of these closely spaced π* orbitals is X dependent, but in all cases, one of these π* orbitals is largely localised on the N,N-dipyridylmethylamine moiety while the other is delocalised over the entire HDBO′ ligand. Neither overlap well with the π HOMO, thus accounting for the small oscillator strengths calculated for these transitions (Table 1).
3.2. Excited state intramolecular proton transfer, emission and Stokes shift
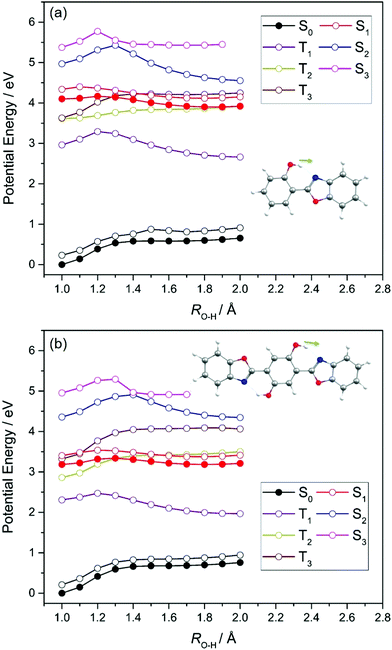
Fig. 3 confirms that the enol tautomer is the minimum energy structure in the electronic ground states of both HBO and HDBO and that the keto tautomer corresponds to a local maximum along RO(1)–H. The respective S1 potentials, in contrast, show minima for both enol and keto tautomers, with the latter calculated to be more stable by ∼0.3 eV in HBO, and by ∼0.1 eV in the case of HDBO. The calculated barrier to enol → keto tautomerism on the S1 PES of HBO is only ∼0.05 eV; the corresponding barrier for HDBO is calculated to be larger (∼0.13 eV). Thus the present calculations reveal a clear driving force for enol → keto tautomerism following vertical excitation to the S1 state of HBO. This accords with the predicted change in both the magnitude and direction of the permanent dipole moment upon electronic excitation (see Fig. S2 of ESI†), and indicates that the S1 state develops substantial CT character upon extending RO(1)–H. Based solely on the present calculations, the tautomerism probability following vertical excitation in HDBO is less clear cut and further complicated by the additional O(8)H⋯N(18) hydrogen bond, which opens the possibility of double ESIPT (along the RO(1)–H and RO(8)–H coordinates).
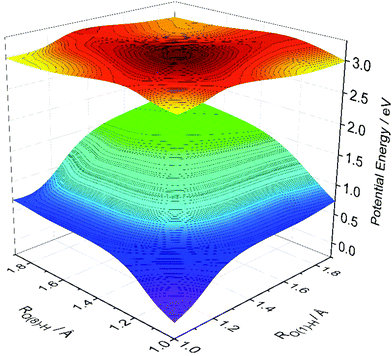
Fig. 4 shows calculated S0 and S1 PESs of HDBO plotted as functions of RO(1)–H and RO(8)–H. For each RO(1)–H and RO(8)–H combination, the S0 energy was calculated after relaxing all other nuclear degrees of freedom and the S1 energies were then computed at these relaxed S0 geometries. The S1 PES calculated in this way displays minima corresponding to the keto tautomers formed by single proton transfer along either RO(1)–H and RO(8)–H. These are equivalent, as required by the parent symmetry. The S1 PES also shows a local minimum at the geometry corresponding to double ESIPT, but the calculated energy of this double-keto structure is ∼0.27 eV higher than the minima accessed by single ESIPT and ∼0.2 eV above the starting double-enol minimum. The calculated energy barrier associated with the concerted double-enol → double-keto tautomerism on the S1 PES is ∼0.3 eV (cf. ∼1.75 eV on the S0 PES). Based on this topography, we predict a dominant role for single ESIPT (cf. double ESIPT) in the photochemistry of HDBO.
As Fig. 3 showed, the unrelaxed PE profiles for the S2 and S3 states of both HBO and HDBO show local minima for both the enol and keto tautomers and can thus also be expected to exhibit CT character upon increasing RO(1)–H. These unrelaxed potentials all show barriers upon extending RO(1)–H, beyond which the S2 states (in particular) stabilise and, in both molecules, are predicted to show an energetic preference for the keto-structure. The T1 states of HBO and HDBO share the same electronic configurations as the respective S1 states. The calculated PE profiles for these triplet states also show minima for both the enol and keto tautomers, whereas the profiles for the T2 and T3 states (the electronic configurations of which are analogous to those of the respective S2 and S3 states) simply increase with increasing RO(1)–H – implying no driving force for ESIPT in these states. We note that the T2 and T3 potentials are predicted to cross other singlet and/or triplet potentials, which could provide non-radiative decay pathways for any triplet state population formed by photoexcitation. However, given the absence of heavy atoms in HBO or HDBO, we suggest that the photochemistry of these molecules is likely to be dominated by nuclear motions on the singlet potentials.
We now focus on the S1 state and the likely photochemistry induced by S1–S0 absorption in these two molecules. Following photoinduced tautomerism, we consider two possible fates for a keto tautomer in its S1 state: fluorescence and internal conversion. Analogy with molecules like 2-(2′-hydroxyphenyl)benzotriazole23 and 2-(2′-hydroxyphenyl)benzothiazole33 suggests that E → Z isomerism around the C(3)![[double bond, length as m-dash]](https://www.rsc.org/images/entities/char_e001.gif) C(9) bond (in the case of HBO, (C(6)
C(9) bond (in the case of HBO, (C(6)![[double bond, length as m-dash]](https://www.rsc.org/images/entities/char_e001.gif) C(17) in the case of HDBO)) might offer a route from the keto minimum to a minimum energy (ME)CI between the S1 and S0 PESs. Fig. 5, which shows PE profiles for E → Z isomerism about C(3)
C(17) in the case of HDBO)) might offer a route from the keto minimum to a minimum energy (ME)CI between the S1 and S0 PESs. Fig. 5, which shows PE profiles for E → Z isomerism about C(3)![[double bond, length as m-dash]](https://www.rsc.org/images/entities/char_e001.gif) C(9) in HBO calculated as a function of the C(2)–C(3)–C(9)–N(10) dihedral angle, ϕC(3)–C(9), confirms this expectation. The displayed energy at ϕC(3)–C(9) = 0° is the relaxed S1 energy at RO(1)–H = 1.8 Å (see Fig. 3(a)), while the final energy point (at ϕC(3)–C(9) = 110°) is for the geometry at which the S1/S0 energy gap in the initial S1 relaxed scan along ϕC(3)–C(9) was smallest. The S1 electronic configuration varies across the intermediate geometries spanned by the S1 relaxed scan, so the intermediate geometries and associated energies were obtained by constructing a linear interpolation in internal coordinate (LIIC) between ϕC(3)–C(9) = 0° and 110°. The ∼0.4 eV barrier in the PE profile returned in this way thus represents an upper limit. Thus the present calculations serve to reinforce previous conclusions regarding the twisted minimum energy geometry of the keto-tautomer of HBO in its S1 state.42 They also suggest that E → Z isomerism about the C(3)
C(9) in HBO calculated as a function of the C(2)–C(3)–C(9)–N(10) dihedral angle, ϕC(3)–C(9), confirms this expectation. The displayed energy at ϕC(3)–C(9) = 0° is the relaxed S1 energy at RO(1)–H = 1.8 Å (see Fig. 3(a)), while the final energy point (at ϕC(3)–C(9) = 110°) is for the geometry at which the S1/S0 energy gap in the initial S1 relaxed scan along ϕC(3)–C(9) was smallest. The S1 electronic configuration varies across the intermediate geometries spanned by the S1 relaxed scan, so the intermediate geometries and associated energies were obtained by constructing a linear interpolation in internal coordinate (LIIC) between ϕC(3)–C(9) = 0° and 110°. The ∼0.4 eV barrier in the PE profile returned in this way thus represents an upper limit. Thus the present calculations serve to reinforce previous conclusions regarding the twisted minimum energy geometry of the keto-tautomer of HBO in its S1 state.42 They also suggest that E → Z isomerism about the C(3)![[double bond, length as m-dash]](https://www.rsc.org/images/entities/char_e001.gif) C(9) bond could be a viable non-radiative decay route by which keto HBO(S1) population (and, by extrapolation, similar populations in HDBO and the X–HDBO′ complexes) could undergo internal conversion to the S0 state. We will revisit this path later.
C(9) bond could be a viable non-radiative decay route by which keto HBO(S1) population (and, by extrapolation, similar populations in HDBO and the X–HDBO′ complexes) could undergo internal conversion to the S0 state. We will revisit this path later.
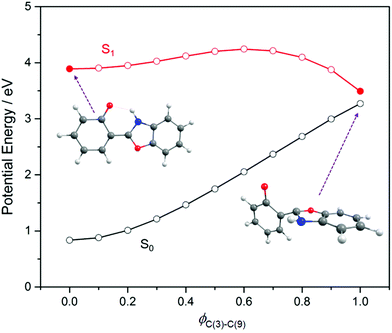 | ||
Fig. 5 Calculated PE profiles for E → Z isomerism (i.e. by rotating around the C(3)![[double bond, length as m-dash]](https://www.rsc.org/images/entities/char_e001.gif) C(9) bond) in the S0 and S1 states of HBO). C(9) bond) in the S0 and S1 states of HBO). | ||
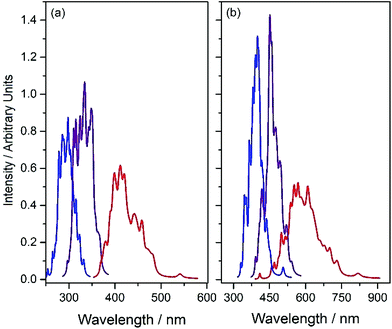
Fluorescence is another possible S1 population loss mechanism, evidence for which is provided by the reported (albeit weak) emission spectra of the present systems.34Fig. 6 shows S1–S0 absorption and emission profiles of both HBO and HDBO calculated using Wigner sampling methods and Newton-X. The respective absorption spectra (shown in blue) are dominated by the parent enol tautomer, while the displayed emission spectra are from both the keto tautomer formed upon single ESIPT (shown in red) and, for completeness, from the respective S1enol minima (shown in purple). These calculations reinforce previous suggestions that single ESIPT is responsible for the large Stokes shifts observed experimentally,34 and succeed in reproducing (semi-quantitatively, at least) the magnitudes of these shifts which, as Fig. 6 shows, are predicted to be ∼110 nm in HBO and ∼150 nm in HDBO.
The present results agree well with previous explorations of the excited state proton transfer of HBO and HDBO (and substituted analogues) and serve to re-emphasise the necessity for long-range correlation in describing the charge-separated states involved in ESIPT.27,42 The extents to which these earlier conclusions, and the available experimental data, are reproduced by the present long-range corrected CAM-B3LYP functional encourages confidence in extrapolating the mechanism identified in HBO and HDBO to the metal-containing systems.
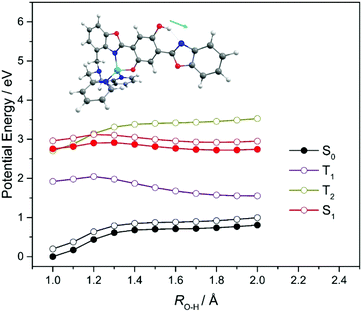
Given these topographies, we can now suggest interpretations for the reported X–HDBO′ emission spectra and their low fluorescence quantum yields.34 The experimental emission spectra are reproduced in Fig. 8, along with sticks showing the calculated wavelengths of peak S1–S0 absorption and of peak emission from both the enol and keto minima on the S1 PES. The present analysis suggests that, as with HBO and HDBO, the longest wavelength emission arises from the keto S1 minimum. This emission shows a substantial bathochromic shift, larger than in the cases of HBO or HDBO, and consistent with experiment. The low fluorescence quantum yield from the X–HDBO′ complexes is plausibly attributed to competition from internal conversion via E → Z isomerisation of the keto tautomer, as demonstrated here for the simpler HBO system. Nonetheless, HDBO′ satisfies many of the requirements of a sensor for trace metal detection, i.e. the X–HDBO′ complex absorbs at (short) visible wavelengths and fluoresces with a sufficient quantum yield and a large Stokes shift.
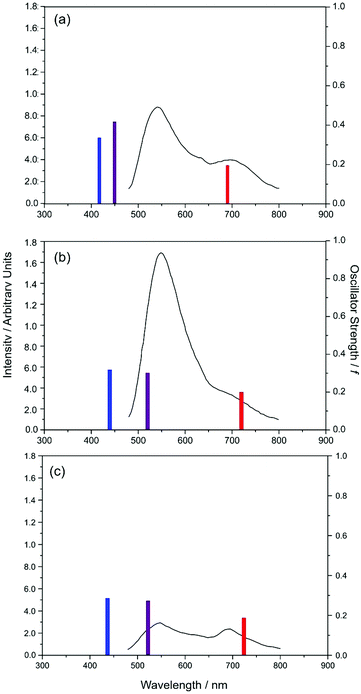 | ||
| Fig. 8 Comparison between calculated gas phase absorption and emission maxima for (a) Zn2+–HDBO′, (b) Cd2+–HDBO′ and (c) Hg2+–HDBO′ and the experimentally measured emission spectra of these same complexes in aqueous solution (from ref. 31 and shown by the solid black curves). The calculated wavelengths for vertical S1 ← S0 absorption from the respective optimised S0 geometries are shown by blue sticks, while the peak wavelengths for S1 → S0 emission from the optimised S1enol and keto geometries are shown by, respectively, the purple and red sticks. The different stick heights reflect the respective calculated oscillator strengths (shown on the right hand vertical axis). | ||
As Fig. 8 shows, the experimental spectra display an additional feature at ∼540 nm that has no analogue in the cases of HBO and HDBO. Xu and Pang noted the very similar excitation profiles for the 540 and 712 nm emissions from Zn2+–HDBO′ and concluded that both emissions were from the same complex.34 Given the PE profiles shown in Fig. 7, we can propose the following explanation for the emissions observed in the solution phase experiments. Vertical excitation projects the X–HDBO′ complex to energies above the S1 minimum. The excited state molecules so formed will evolve under the influence of the S1 PES, and start dissipating internal energy by interacting with the surrounding solvent. Some fraction of the S1 state population will undergo ESIPT. This fraction can then make a radiationless transition to the ground state (e.g. by E → Z isomerism) or relax into the S1keto minimum and decay by fluorescing (at λem ∼712 nm). Any S1 state population that relaxes into the S1enol minimum (RO(1)–H = 1.0 Å), however, would likely fluoresce at λem ∼540 nm – as suggested by Xu and Pang.34 Recalling the experimental emission profiles (Fig. 8), it is tempting to suggest that the latter process is (relatively) most important in Cd2+–HDBO′. This could be explained if the energy barrier to enol → keto tautomerism on the S1 PES is larger in Cd2+–HDBO′ than in Zn2+–HDBO′. As an alternative, however, the observation could also indicate that, relative to Zn2+–HDBO′, the S1keto form of Cd2+–HDBO′ has a smaller barrier to E → Z isomerism (and thus a lower fluorescence quantum yield for this tautomer).
We note that the present calculations for the isolated (i.e. gas phase) systems cannot allow for the additional complexities that would manifest from considering the bulk aqueous environment. Electronic absorptions to charge-separated states typically show a bathochromic shift in polar solutions (reflecting the stabilisation of the charge-separated state). Notwithstanding, the absorption and emission maxima returned by the present (isolated molecule) calculations are seen to mimic the experimental (aqueous phase) data sufficiently well to enable interpretation of the observed photophysics. Inspecting Fig. 8, it is clear that the peak emission wavelength of the enol-form of Zn2+–HDBO′ is reproduced least well; relative to the other X–HDBO′ species, we predict a notably smaller Stokes shift for Zn2+–HDBO′, implying a smaller change in equilibrium geometry upon S1 ← S0 excitation in this case. It is unclear at this stage to what extent this is a real effect, or rather a reflection of the different basis sets used for Zn2+–HDBO′ (cf. Cd2+–HDBO′ and Hg2+–HDBO′).
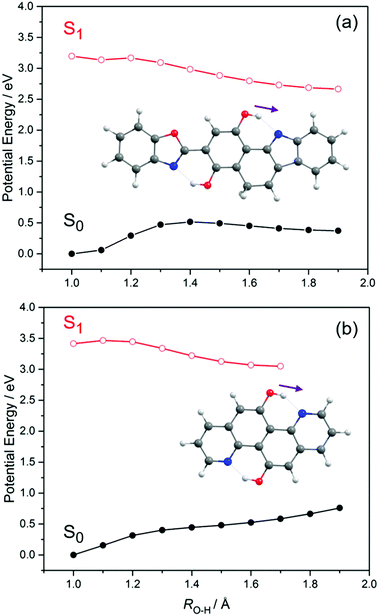
Having offered a rationale for the large and, from the sensing perspective, highly desirable Stokes shifts exhibited by these X–HDBO′ complexes, we now turn attention to potential modifications of the ligand that might result in a larger fluorescence quantum yield (i.e. minimise the probabilities of competing non-radiative excited state decay processes). Two possible structures are shown in Fig. 9. 3-Benzo[d]oxazol-2-yl-5H-benzo[a]carbazole-1,4-diol (henceforth BC-HBO, shown in Fig. 9(a)), is an analogue of HDBO in which O(13) is replaced by a C atom (henceforth labelled C(18)) and a two-carbon bridge links C(18) to C(4). As Fig. 9(a) shows, BC-HBO is predicted to absorb at similar wavelengths to HDBO, to undergo ESIPT to the keto-tautomer upon S1 ← S0 excitation, and to show substantially red-shifted S1 → S0 emission. Crucially, however, the two-carbon bridge linking C(18) to C(4) not only holds all atoms in a common plane, but should mitigate against any non-radiative population loss via rotation about ϕC(3)–C(9) in the keto-conformer. Fig. 9(b) depicts another analogue of HDBO, quinolino[8,7-h]quinolone-5-11-diol (henceforth QQ), which is calculated to display similar tendencies for ESIPT, red-shifted S1 → S0 emission and, again, the additional structural rigidity to preclude excited state E → Z isomerism as a rival to fluorescence decay. Analogy with HDBO and, particularly, the deprotonated variant of HDBO′, suggests that suitably derivitized variants of either of these ligands could constitute improved ESIPT-based sensors for trace metal detection.
4. Conclusions
The present computational study reveals mechanistic details of a prototypical system that can function as a fluorescent sensor for trace metal cations. We have scanned PE profiles along selected coordinates for the ground and first few excited states for the target metal-chelated complexes (X–HDBO′, with X = Zn2+, Cd2+ and Hg2+) and for simpler molecular building blocks like HBO and HDBO from which these complexes derive, and shown that all are likely to undergo ESIPT following S1 ← S0 photoexcitation. The initial excitation in all of these cases involves a π* ← π transition, that induces charge separation in the S1 state and drives a subsequent proton transfer which, in these molecules, is synonymous with enol → keto tautomerism. In each case, the resulting keto-tautomer constitutes a local minimum on the S1 PES, and is identified as the carrier of Stokes shifted fluorescent emission – consistent with recent experimental studies34 that reveal measurable fluorescence quantum yield from this tautomer. The present study succeeds in reproducing the relative energies of the observed S1 ← S0(enol) absorptions across the series HBO, HDBO, protonated and deprotonated HDBO′ and the X–HDBO′ complexes themselves, and of their respective S1(keto) → S0 emissions. We also suggest S1(enol) → S0 fluorescence as an explanation for hitherto unassigned shorter wavelength emission from the X–HDBO′ complexes. Derivatives of HDBO′ are also proposed that are predicted to retain attractive features like (short wavelength) visible absorption and heavily Stokes shifted emission but, additionally, offer higher fluorescence quantum yields (i.e. enhanced metal sensing capability) by precluding possible non-radiative decay via E → Z isomerism from the S1keto minimum to the S0 PES.Acknowledgements
The authors are grateful to the Engineering and Physical Sciences Research Council via Programme grant EP/L005913/1. BM and TNVK are grateful to TUM for the award of post-doctoral research fellowships. The underlying data upon which this manuscript is based has been stored in the University of Bristol research data repository and can be access via the following link: DOI: 10.5523/bris.836bu3nhnbzg1pszfc2xowr44.Notes and references
- L. Basabe-Desmonts, D. N. Reinhoudt and M. Crego-Calama, Chem. Soc. Rev., 2007, 36, 993–1017 RSC.
- R. N. Dsouza, U. Pischel and W. M. Nau, Chem. Rev., 2011, 111, 7941–7980 CrossRef CAS PubMed.
- A. B. Chinen, C. M. Guan, J. R. Ferrer, S. N. Barnaby, T. J. Merkel and C. A. Mirkin, Chem. Rev., 2015, 115, 10530–10574 CrossRef CAS PubMed.
- K. P. Carter, A. M. Young and A. E. Palmer, Chem. Rev., 2014, 114, 4564–4601 CrossRef CAS PubMed.
- E. A. Lemke and C. Schultz, Nat. Chem. Biol., 2011, 7, 480–483 CrossRef CAS PubMed.
- K. J. Wallace, Supramol. Chem., 2009, 21, 89–102 CrossRef CAS.
- A. P. de Silva, H. Q. Nimal Gunaratne and K. R. A. Samankumara Sandanayake, Tetrahedron Lett., 1990, 31, 5193–5196 CrossRef.
- M. S. Koay, B. M. G. Janssen and M. Merkx, Dalton Trans., 2013, 42, 3230–3232 RSC.
- S. Bakthavatsalam, A. Sarkar, A. Rakshit, S. Jain, A. Kumar and A. Datta, Chem. Commun., 2015, 51, 2605–2608 RSC.
- S. Arimori, G. A. Consiglio, M. D. Phillips and T. D. James, Tetrahedron Lett., 2003, 44, 4789–4792 CrossRef CAS.
- K. K. Sadhu, S. Sen and P. K. Bharadwaj, Dalton Trans., 2011, 40, 726–734 RSC.
- D. C. Magri, G. J. Brown, G. D. McClean and A. P. de Silva, J. Am. Chem. Soc., 2006, 128, 4950–4951 CrossRef CAS PubMed.
- J. M. Tarascon, G. W. Hull and F. J. DiSalvo, Mater. Res. Bull., 1984, 19, 915–924 CrossRef CAS.
- V. Daniel, R. Maja, J. Adolf, M. Aleš, U. Polona, P. Maja, J. Boštjan, M. Anton, N. Barbara, P. Stane, V. Peter, J. C. Coleman and M. Dragan, Nanotechnology, 2004, 15, 635 CrossRef.
- D. Mihailovic, Prog. Mater. Sci., 2009, 54, 309–350 CrossRef CAS.
- X. Yin, S. A. Warren, Y.-T. Pan, K.-C. Tsao, D. L. Gray, J. Bertke and H. Yang, Angew. Chem., Int. Ed., 2014, 53, 14087–14091 CrossRef CAS PubMed.
- E. Merino and M. Ribagorda, Beilstein J. Org. Chem., 2012, 8, 1071–1090 CrossRef CAS PubMed.
- P. Hamm, S. M. Ohline and W. Zinth, J. Chem. Phys., 1997, 106, 519–529 CrossRef CAS.
- I. K. Lednev, T. Q. Ye, P. Matousek, M. Towrie, P. Foggi, F. V. R. Neuwahl, S. Umapathy, R. E. Hester and J. N. Moore, Chem. Phys. Lett., 1998, 290, 68–74 CrossRef CAS.
- W. Domcke, D. R. Yarkony and H. Koppel, Conical Intersections: Electronic Structure, Dynamics and Spectroscopy, World Scientific, Singapore, 2004 Search PubMed.
- S. Hammes-Schiffer, J. Am. Chem. Soc., 2015, 137, 8860–8871 CrossRef CAS PubMed.
- A. L. Sobolewski and W. Domcke, Phys. Chem. Chem. Phys., 2006, 8, 3410–3417 RSC.
- A. L. Sobolewski, W. Domcke and C. Hättig, J. Phys. Chem. A, 2006, 110, 6301–6306 CrossRef CAS PubMed.
- M. F. Rode and A. L. Sobolewski, Chem. Phys., 2012, 409, 41–48 CrossRef CAS.
- T. N. V. Karsili, B. Marchetti, M. N. R. Ashfold and W. Domcke, J. Phys. Chem. A, 2014, 118, 11999–12010 CrossRef CAS PubMed.
- Q. L. Nguyen, V. A. Spata and S. Matsika, Phys. Chem. Chem. Phys., 2016, 18, 20189–20198 RSC.
- C. Azarias, S. Budzak, A. D. Laurent, G. Ulrich and D. Jacquemin, Chem. Sci., 2016, 7, 3763–3774 RSC.
- H. Wang, H. Zhang, O. K. Abou-Zied, C. Yu, F. E. Romesberg and M. Glasbeek, Chem. Phys. Lett., 2003, 367, 599–608 CrossRef CAS.
- T. Arthen-Engeland, T. Bultmann, N. P. Ernsting, M. A. Rodriguez and W. Thiel, Chem. Phys., 1992, 163, 43–53 CrossRef CAS.
- O. K. Abou-Zied, R. Jimenez, E. H. Z. Thompson, D. P. Millar and F. E. Romesberg, J. Phys. Chem. A, 2002, 106, 3665–3672 CrossRef CAS.
- S. Lochbrunner, K. Stock and E. Riedle, J. Mol. Struct., 2004, 700, 13–18 CrossRef CAS.
- R. Daengngern and N. Kungwan, Chem. Phys. Lett., 2014, 609, 147–154 CrossRef CAS.
- D. T. Mancini, K. Sen, M. Barbatti, W. Thiel and T. C. Ramalho, ChemPhysChem, 2015, 16, 3444 CrossRef CAS PubMed.
- Y. Xu and Y. Pang, Chem. Commun., 2010, 46, 4070–4072 RSC.
- M. J. Frisch, G. W. Trucks, H. B. Schlegel, G. E. Scuseria, M. A. Robb, J. R. Cheeseman, G. Scalmani, V. Barone, B. Mennuchi, G. Petersson, et al., Gaussian 09, 2010, revision B.01, Gaussian Inc., Wallingford, CT Search PubMed.
- T. Yanai, D. P. Tew and N. C. Handy, Chem. Phys. Lett., 2004, 393, 51–57 CrossRef CAS.
- W. J. Hehre, R. F. Stewart and J. A. Pople, J. Chem. Phys., 1969, 51, 2657 CrossRef CAS.
- W. R. Wadt and P. J. Hay, J. Chem. Phys., 1985, 82, 284–298 CrossRef CAS.
- M. Barbatti, G. Granucci, M. Persico, M. Ruckenbauer, M. Vazdar, M. Eckert-Maksić and H. Lischka, J. Photochem. Photobiol., A, 2007, 190, 228–240 CrossRef CAS.
- M. Barbatti, M. Ruckenbauer, F. Plasser, J. Pittner, G. Granucci, M. Persico and H. Lischka, Wiley Interdiscip. Rev.: Comput. Mol. Sci., 2014, 4, 26–33 CrossRef CAS.
- M. Barbatti, A. J. A. Aquino and H. Lischka, Phys. Chem. Chem. Phys., 2010, 12, 4959–4967 RSC.
- Y. Syetov, J. Fluoresc., 2013, 23, 689–696 CrossRef CAS PubMed.
Footnote |
| † Electronic supplementary information (ESI) available: (i) Minimum energy geometries and dominant orbital promotions associated with excitation to the lowest three singlet excited states of Cd2+–HDBO′ and Hg2+–HDBO′; (ii) permanent dipole moment vectors in the S0 and S1 (enol and keto) states of HBO. See DOI: 10.1039/c6dt03906e |
| This journal is © The Royal Society of Chemistry 2016 |

