
 Open Access Article
 This Open Access Article is licensed under a Creative Commons Attribution-Non Commercial 3.0 Unported Licence
Catalyst–solvent interactions in a dinuclear Ru-based water oxidation catalyst†
Andrey
Shatskiy
a,
Reiner
Lomoth
b,
Ahmed F.
Abdel-Magied
a,
Wangchuk
Rabten
a,
Tanja M.
Laine
a,
Hong
Chen
cd,
Junliang
Sun
c,
Pher G.
Andersson
a,
Markus D.
Kärkäs‡
 *a,
Eric V.
Johnston
*a and
Björn
Åkermark
*a
*a,
Eric V.
Johnston
*a and
Björn
Åkermark
*a
aDepartment of Organic Chemistry, Arrhenius Laboratory, Stockholm University, 10691 Stockholm, Sweden. E-mail: markus.karkas@su.se; eric.johnston@su.se; bjorn.akermark@su.se
bDepartment of Chemistry, Ångström Laboratory, Uppsala University, 75120 Uppsala, Sweden
cDepartment of Materials and Environmental Chemistry, Stockholm University, 10691 Stockholm, Sweden
dDepartment of Chemistry, KTH Royal Institute of Technology, 10044 Stockholm, Sweden
First published on 10th November 2016
Abstract
Photocatalytic water oxidation represents a key process in conversion of solar energy into fuels and can be facilitated by the use of molecular transition metal-based catalysts. A novel straightforward approach for covalent linking of the catalytic units to other moieties is demonstrated by preparation of a dinuclear complex containing two [Ru(pdc)(pic)3]-derived units (pdc = 2,6-pyridinedicarboxylate, pic = 4-picoline). The activity of this complex towards chemical and photochemical oxidation of water was evaluated and a detailed insight is given into the interactions between the catalyst and acetonitrile, a common co-solvent employed to increase solubility of water oxidation catalysts. The solvent-induced transformations were studied by electrochemical and spectroscopic techniques and the relevant quantitative parameters were extracted.
Introduction
Oxidation of water has been identified as one of the challenging processes required for production of solar fuels.1 The high activation energies and low selectivity of the reaction have stimulated a wide search for more efficient catalysts.2 As a result, a number of transition metal-based water oxidation catalysts (WOCs) have been developed over the last decades—both heterogeneous and homogeneous (molecular). Molecular WOCs offer high flexibility in catalyst design and allow for more straightforward mechanistic studies compared to heterogeneous catalysts. A plethora of molecular catalysts have been developed based on abundant first-row transition metals.3 However, these catalysts generally suffer from low activity and stability compared to catalysts based on the noble metals Ir4 and Ru.5 Ruthenium-based catalysts constitute the largest family of molecular WOCs and currently include the most active WOCs both for chemical6 and photochemical7 water oxidation. Nevertheless, the long-term stability and efficiency of these catalysts are still far from values required for commercial applications, and broader exploration of novel catalysts as well as better understanding of the mechanism of their action is required.The mononuclear ruthenium complex [Ru(pdc)(pic)3] (1, pdc = 2,6-pyridinedicarboxylate, pic = 4-picoline) is a prominent WOC that has been shown to mediate chemical,8 electrochemical,9 and photoelectrochemical water oxidation (Fig. 1).10 Recently, our group demonstrated that analogues of complex 1, in which one11 or both12 of the carboxylate groups were substituted with carboxamide groups were also active WOCs. An interesting feature of these new catalysts is that the carboxamide functionality can be used to covalently link them (via suitable linkers) to other catalytic units of the same or different nature, photosensitizers, electrode surfaces, etc. The covalent linking can be achieved via the carboxamide ligand, which can be deprotonated and bound to the metal center.2d The strategies previously employed for synthesis of covalently bound catalyst assemblies include functionalization of one of the WOC ligands at positions not adjacent to the metal center. Although this approach has proven viable, it is more synthetically challenging than the route employed in the current study. Moreover, the suggested carboxamide binding offers a straightforward way for arrangement of the assembly components in the face-to-face fashion, not easily accessible with traditional approaches.
 | ||
| Fig. 1 Structure of molecular water oxidation catalysts 1–3. | ||
Herein, we describe the synthesis, catalytic activity for water oxidation, and redox behavior of ruthenium complex 3 (Fig. 1). The complex represents a dinuclear analogue of complex 2 with a metal-coordinating carboxamide group used to fuse two [Ru(pdc)(pic)3]-derived catalytic units together. Benzene was selected as a central moiety since it has previously been demonstrated to be a viable linker between two WOC units.13 Complex 3 represents the first example of a WOC assembly where the coordinating carboxamide ligand is employed as a linker.
Results and discussion
Synthesis and characterization
The dinucleating ligand 6,6′-((1,3-phenylenebis(azanediyl))bis-(carbonyl))dipicolinic acid (7) was prepared through amide bond formation between m-phenylenediamine and monomethyl 2,6-pyridinedicarboxylic acid followed by hydrolysis of the methyl ester (Scheme S1†). To form the desired dinuclear complex, a solution of the deprotonated ligand was slowly added to the ruthenium precursor ([Ru(DMSO)4Cl2]), followed by addition of excess 4-picoline. The crude product was purified by flash chromatography, resulting in isolation of complex 3. The structure of the complex was confirmed by 1H NMR, single crystal X-ray diffraction analysis (SC-XRD), electrospray ionization mass spectrometry (ESI-MS), elemental analysis, UV-vis, and IR.
1H NMR of the complex in CD3OD initially displayed highly broadened peaks, probably due to the presence of paramagnetic d5 RuIII species (Fig. S9,† top). However, addition of only 0.05 equivalents of ascorbic acid was sufficient to reduce the traces of RuIII to diamagnetic d6 RuII and resulted in a 1H NMR spectrum with clear and sharp peaks (Fig. S9,† bottom). This suggests that the isolated complex is in the RuIIRuII state, but is contaminated with a small amount of RuIII species, presumably generated from oxidation of complex 3 upon prolonged exposure to air. The 1H NMR spectrum of complex 3 was fully assigned and revealed that the two catalytic units, all axial and equatorial picolines display uniform chemical shifts and coupling patterns (Fig. S11†). The latter is an indication of the high apparent symmetry of the complex in solution. Furthermore, 1H NMR spectra of complex 3 in CD3CN, CD3CN/D2O (3![[thin space (1/6-em)]](https://www.rsc.org/images/entities/char_2009.gif) :1), and CD3CN/D2O (3:1) with addition of 2 equivalents of 4-picoline were recorded (Fig. S15†). These spectra support that 4-picoline ligands do not dissociate from the metal centres in the RuIIRuII state of 3 under the conditions used for electrochemical, spectroscopical and catalytic activity studies (vide infra).
:1), and CD3CN/D2O (3:1) with addition of 2 equivalents of 4-picoline were recorded (Fig. S15†). These spectra support that 4-picoline ligands do not dissociate from the metal centres in the RuIIRuII state of 3 under the conditions used for electrochemical, spectroscopical and catalytic activity studies (vide infra).
Slow evaporation of a 0.1 mM solution of complex 3 in MeCN yielded dark-brown crystals suitable for single crystal X-ray diffraction analysis (Fig. 2). The analysis confirmed the molecular structure and the oxidation state of 3 suggested by NMR. The symmetry of the complex was close to that of C2 point group with the two catalytic units being in an equivalent chemical environment. The latter is consistent with the high apparent symmetry of 3 in solution as observed by NMR. The relevant bond lengths and angles for dinuclear complex 3 are close to those previously reported for complex 2 (Table S1†)11 and the only notable difference in bond lengths is the increased distance (by 0.1 Å) between the ruthenium center and the carboxamide ligand for complex 3 relative to that of 2.
 | ||
| Fig. 2 ORTEP ellipsoid plot of ruthenium complex 3 (ellipsoids at 50% probability). Hydrogen atoms and solvent molecules were omitted for clarity. Color codes: Ru—brown, C—black, N—blue, O—red. | ||
Electrochemical properties
The redox properties of complex 3 were investigated by cyclic voltammetry (CV) in an aprotic solvent (dichloromethane) and subsequently in the aqueous medium used for chemical water oxidation (aqueous TfOH). In a dichloromethane solution (Fig. 3) two pairs of close lying chemically reversible one-electron waves were observed with half-wave potentials of E1/2 = −0.28 V and −0.19 V and of E1/2 = 1.02 V and 1.20 V vs. Fc+/Fc, respectively (based on differential pulse voltammetry (DPV) measurements).14 These four waves can be ascribed to the two pairs of RuIII/RuII and RuIV/RuIII couples of the two metal centers, here denoted as RuIIIRuII/RuIIRuII, RuIIIRuIII/RuIIIRuII, RuIVRuIII/RuIIIRuIII and RuIVRuIV/RuIVRuIII. The relatively small separation of the half-wave potentials within the first pair is indicative of rather weak interactions between the redox sites, as expected from the distance and bridging motif between the metal centers (E1/2(RuIIIRuIII/RuIIIRuII) − E1/2(RuIIIRuII/RuIIRuII) = 0.09 V), while the relatively larger separation in the latter pair can be rationalized by the increased coulombic repulsion in the higher oxidation state. | ||
| Fig. 3 Cyclic voltammogram of a 1 mM solution of complex 3 (black) with corresponding background (red) in dry CH2Cl2. Three CV cycles were recorded at 0.05 V s−1 scan rate. | ||
As the chemical water oxidation experiments had to be performed in aqueous triflic acid (TfOH) solutions (0.1 M, pH 1.0) with 10% MeCN as a co-solvent (vide infra),15 further investigations into the redox properties of complex 3 were carried out in this particular medium. To obtain kinetic information on the reactivity of 3, cyclic voltammograms were recorded with different scan rates ν (0.005–100 V s−1) and alternative vertex potentials of 0.775 or 1 V. Selected examples are shown in Fig. 4 (see ESI† for complete set of CVs).
 | ||
| Fig. 4 Cyclic voltammograms of a 0.1 mM solution of complex 3 in aqueous TfOH (0.1 M, pH 1.0) with addition of 10% MeCN. Three CV cycles were recorded for all the measurements to obtain a stable response and the third cycle is presented. The background-subtracted voltammograms (red) were obtained by subtracting the simulated background current (black, see ESI† for details) from the experimental curves (blue). The scan rates are 1 V s−1 (a and b) and 100 V s−1 (c and d); see ESI† for the full set of CVs at scan rates 0.005–100 V s−1. | ||
With scan rates ν > 0.5 V s−1 the background-subtracted voltammograms are described by symmetric peaks characteristic of surface confined redox processes. This notion is supported by the dependence of the faradaic current on the scan rate to the power of 0.82 (Fig. 6a).16 Therefore, it can be concluded that the voltammetric response in the aqueous medium occurs predominantly from complexes adsorbed to the glassy carbon electrode by hydrophobic interactions with an approximate surface concentration of 5.7 × 10⁻¹¹ mol cm−2 corresponding to 69% of a dense monolayer (see ESI† for details). Only at very low scan rates do the diffusional electrode reactions make a major contribution to the faradaic current resulting in the typical shape of diffusional CV waves.
The first anodic peak on the forward scans and the dominant cathodic peak on the reverse scans can be assigned to the RuIIIRuIII/RuIIRuII couple with E1/2 = 0.24 V vs. SCE similar to the average value of RuIIIRuII/RuIIRuII and RuIIIRuIII/RuIIIRuII couples observed in dichloromethane (E1/2(Fc+/Fc, CH2Cl2) = 0.23 V vs. SCE17). The complete coalescence of the two couples into a single two-electron process indicates that the likely predominantly coulombic interactions between the two redox centers are inhibited in the highly polar aqueous medium.
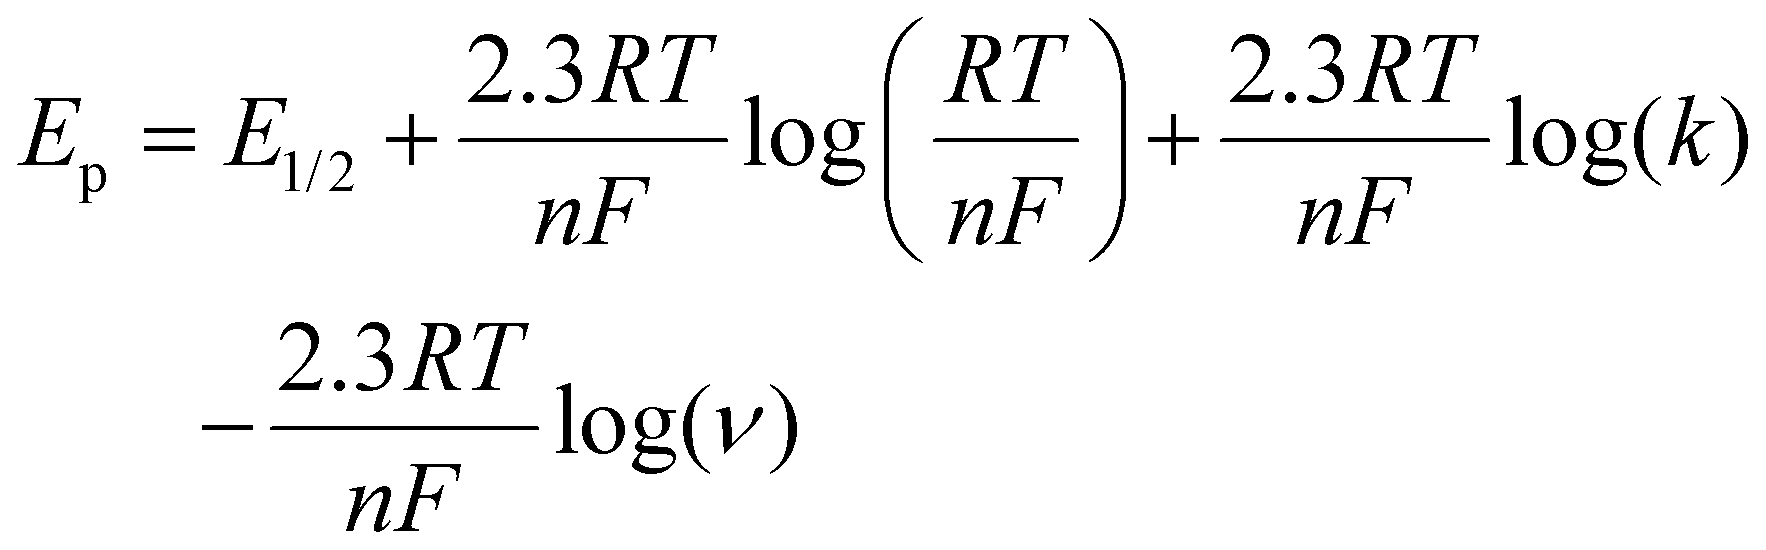
An additional anodic peak at around 0.6 V is irreversible at lower scan rates (Fig. 4a) but turns chemically reversible (E1/2 = 0.60 V) as the scan rate is increased (Fig. 4c). In analogy to the previously studied mononuclear complex 1,8a this redox process is assigned to the RuIIIRuIII/RuIIRuII couple of an acetonitrile coordinated analogue formed by displacement of the carboxylate ligands by MeCN when complex 3 is dissolved in the acidic water/MeCN mixture (reaction (1), Fig. 5b). It can be anticipated that protonation of the carboxylate contributes significantly to the driving force of this reaction. The elevated potential of the RuIIIRuIII/RuIIRuII couple with coordinated MeCN is in agreement with better stabilization of RuII by MeCN via π-backdonation and of RuIII by the harder carboxylate oxygen. Accordingly, oxidation of the acetonitrile coordinated complex to the RuIIIRuIII state triggers quantitative binding of the pending carboxylate ligands (reaction (2), Fig. 5b) as evidenced by the absence of a corresponding counter peak at lower scan rates (Fig. 4a). Only with scan rates ν > 20 V s−1 is the ligand exchange reaction being outrun and reduction of the acetonitrile coordinated RuIII complex is observed (Fig. 4c). This mechanism of redox-induced ligand exchange reactions previously described for the mononuclear analogue 1 can be summarized by the square schemes shown in Fig. 5. For complex 1 the scheme was validated by electrochemical, spectroscopical, 1H NMR, and ESI-MS studies. Moreover, formation of similar open chelate complexes where MeCN is coordinated to the ruthenium center have been described for other WOCs, primarily those of the Ru(bda)-family (bda = 2,2′-bipyridine-6,6′-dicarboxylate).18 We hence assume that the qualitatively analogous voltammetric data obtained with complex 3 can be rationalized with the established mechanistic scheme. In quantitative terms, the exchange of carboxylate ligands in the RuII state is however thermodynamically more favorable in the mononuclear analogue 1 while complex 3 prevails predominantly in the form with coordinated carboxylate ligands (K(1) ≈ 0.5), as evident from the ratio of anodic peak currents of the first CV scans(Fig. S17–S20†). The relative scan rate independence of K(1) also suggests that the equilibrium is slow. The peak current ratio is maintained even at a scan rate of 0.005 V s−1, implying that the rate constant of the related reverse reaction k < 1 × 10⁻² s−1.
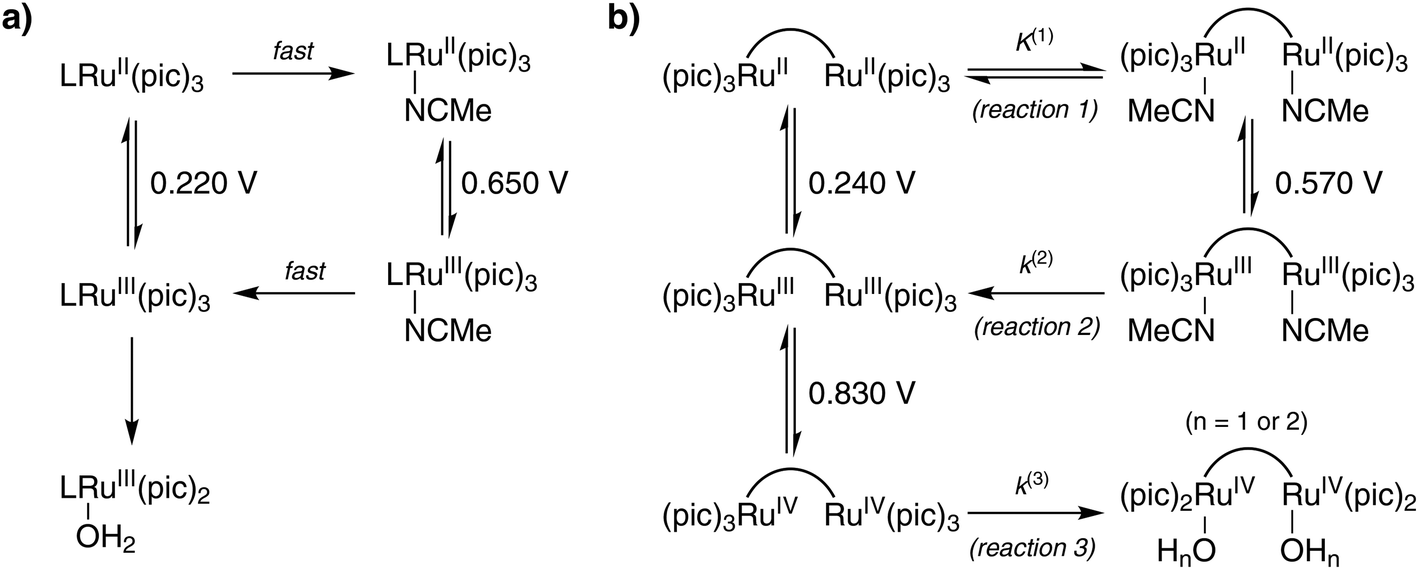 | ||
| Fig. 5 Summary of the proposed transformations (V vs. SCE) of (a) complex 1 (adapted from ref. 8b) and (b) complex 3. L = pdc; potentials from ref. 8b were converted from vs. NHE to vs. SCE by subtracting 0.240 V. | ||
When extending the scans to 1 V, a third anodic peak could be detected (Fig. 4b). A corresponding counter peak started to emerge already with scan rates ν ≥ 1 V s−1 and at ν = 100 V s−1 a chemically reversible couple with E1/2 = 0.83 V was observed (Fig. 4d). This couple might be assigned to a subsequent two-electron oxidation of complex 3 from its RuIIIRuIII to RuIVRuIV state that possibly triggers exchange of equatorial 4-picoline ligands for water/hydroxide ligands (reaction (3), Fig. 5b) if the reaction is not outrun by higher scan rates. Such exchange processes have been observed for related mononuclear ruthenium complexes at the RuIII state.8a,19 However, in case of catalyst 3 the RuIII species are kinetically stable as evident from the reversibility of the dominant RuIIIRuIII/RuIIRuII couple even at the lowest scan rates (Fig. S17†). We therefore propose that for catalyst 3 the 4-picoline–water exchange, which is necessary for the catalyst to enter the catalytic cycle of water oxidation, happens at the RuIV state. From the scan rate dependent ratio of the forward-to-reverse peak currents it can be estimated that this reaction occurs on a time scale on the order of 10 to 100 milliseconds while the exchange of acetonitrile (reaction (2)) is more than one order of magnitude faster.
More accurate estimates of the two rate constants were obtained from a detailed analysis of the scan rate dependence of the peak potentials and of the forward-to-reverse peak current ratios. The analysis was based on the ErCi model of a reversible interfacial electron transfer followed by an irreversible chemical reaction.20
 | (1) |
 | (2) |
Fig. 6b and c show the dependence of the peak potentials Ep for the second and third redox couple as a function of scan rate. For the lower scan rates where the potential is controlled by the kinetics of the coupled reaction least square fits to the logarithmic plots of the anodic peak potentials (E(2)pa and E(3)pa) have slopes of 0.027 V and 0.026 V per decade of scan rate, respectively. These slopes are close to the expected value (0.029 V) for an adsorbed species undergoing a two-electron oxidation followed by an irreversible first order (or pseudo-first order) reaction according to eqn (1), where n is the number of electrons transferred, k is the first-order rate constant of the following reaction, R is the gas constant, T is the temperature, and F is the Faraday constant.21 The alternative assignment to a diffusional one-electron process coupled to an irreversible first order reaction would also agree with the observed slopes close to 0.029 V per decade (see eqn (2))20 but would be inconsistent with the observed scan rate dependence of the peak currents and the peak shape discussed above.
 | ||
| Fig. 6 (a) A log–log plot of first anodic peak current vs. scan rate. Dependence of the second (b) and third (c) anodic (black squares) and cathodic (black circles) peak potentials on the scan rate. | ||
Based on eqn (1), the half-wave potentials (E1/2 = (Epa + Epc)/2)22 and intercepts (Epa at log(ν) = 0) determined from the plots in Fig. 6b and c, rate constants of k(2) = 1 × 10³ s−1 and k(3) = 4 × 101 s−1 were obtained for the two reactions.23 Furthermore, the rate constants were also obtained from the analysis of the forward-to-reverse current peak ratios (see ESI† for details). The resulting rate constants k(2) = 2 × 10² s−1 and k(3) = 4 × 101 s−1 are in reasonable agreement with the constants derived from the peak potentials.
The electrochemical characterization of complex 3 was also carried out at neutral pH, at conditions comparable to those used in the light-driven water oxidation experiments (vide infra). However, a weaker voltammetric response was observed by cyclic voltammetry. The only observed signals were from the RuIIIRuIII/RuIIRuII couple, with and without coordinated MeCN, and from the catalytic current of water oxidation with an onset potential of ≈1.15 V (Fig. 7). After the first sweep reaching the potential of the electrocatalytic water oxidation a large irreversible wave at ≈−0.6 V appeared and was ascribed to reduction of oxygen, indicating that the catalytic wave above 1.15 V indeed corresponds to water oxidation.
 | ||
| Fig. 7 Cyclic voltammograms of complex 3 (0.1 mM) in aqueous phosphate buffer (0.1 M, pH 7.0) with addition of 10% MeCN. Six CV cycles were recorded at 0.05 V s−1 scan rate for the complex (black) and pure electrolyte (red). The initial potential was set to 0 V, swept to negative direction until −0.75 V, and then in the positive direction until 1.4 V, followed by five more cycles. The inset shows a magnified view of the voltammogram. | ||
UV-vis spectroscopy
The UV-vis absorption spectrum of complex 3 in MeCN displayed four bands, at 248, 309, 395, and 455 nm (Fig. 8). The first two bands were ascribed to π–π* transitions within the ancillary ligands while the two latter bands were assigned to metal-to-ligand charge transfer (MLCT) transitions. Upon decreasing pH, both of the MLCT bands displayed a shift towards higher energy transitions, which is in contrast to what is regularly observed for carboxylate-functionalized polypyridyl ruthenium complexes.24 In case of complex 3, however, the blue shift can be explained by protonation-induced coordination of MeCN to the metal centers, where the stronger π-acceptor character of MeCN lowers the dπRu HOMO energy level.25 Furthermore, the stability of complex 3 was investigated by recording the absorption spectra in phosphate buffer and TfOH under O2 for 60 min, during which the spectra displayed only minor changes (Fig. S29†).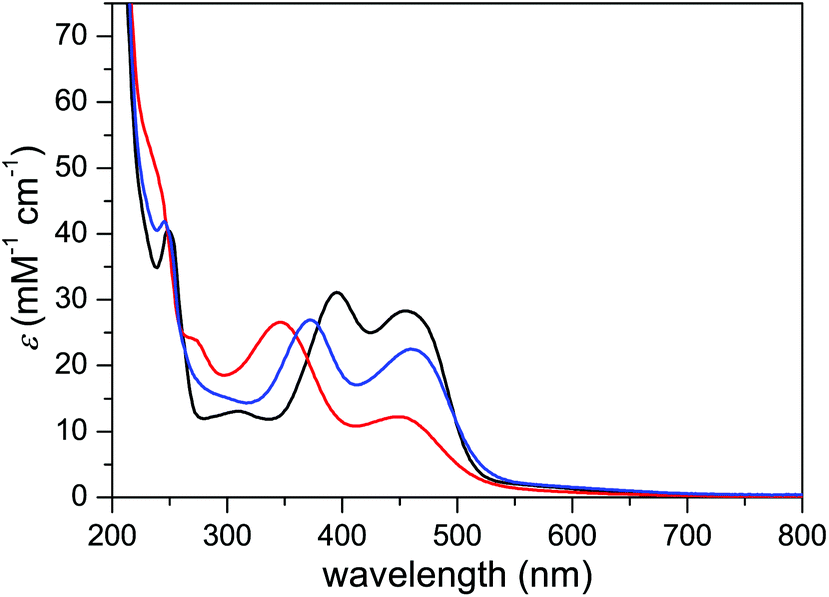 | ||
| Fig. 8 UV-vis absorption spectra of complex 3 in MeCN (black line), aqueous TfOH (0.1 M) with addition of 10% MeCN (red line), and phosphate buffer (0.025 M, pH 7.0) with addition of 10% MeCN (blue line). | ||
Spectrophotometric redox titration of complex 3 with ceric ammonium nitrate (CAN) as oxidant was performed to detect intermediates formed upon oxidation of complex 3 (Fig. 9). Consistent with the electrochemical data, oxidation of RuIIRuII to the RuIIIRuIII complex proceeds in one step, as evident from two isosbestic points (Fig. 9a) and the linear dependence of absorbance on the amount of added CAN (Fig. 9b). Upon addition of more than two equivalents of CAN, a steady increase in absorbance at wavelengths shorter than 400 nm was observed, presumably due to formation of CeIII and products derived from hydrolysis and/or oxidation of MeCN (Fig. S28†).
 | ||
| Fig. 9 Spectrophotometric redox titration of complex 3 with ceric ammonium nitrate (CAN). (a) UV-vis absorption spectra of complex 3 upon addition of up to 2 equiv. of CAN (arrows indicate decrease and increase in absorption, see Fig. S28† for change in UV-vis spectrum upon addition of up to 8 equiv. of CAN). (b) UV-vis absorbance changes of complex 3 at 350 nm (blue squares) and 450 nm (black squares) upon addition of up to 8 equiv. of CAN. | ||
Protonation state
An important aspect of the electrochemical processes proposed in Fig. 5b is the protonation state of the involved species. Spectrophotometric pH titration of complex 3 revealed a distinct pH-dependence of the UV-vis adsorption between pH 0 and 2 with a pKa ≈ 1 (Fig. 10). As indicated earlier, a blue shift of the higher energy MLCT band suggests protonation of the dinucleating ligand 7 accompanied by MeCN coordination. | ||
| Fig. 10 Spectrophotometric pH titration of complex 3. (a) UV-vis absorption changes upon adjustment of pH, arrows indicate the direction of change in absorbance when the pH is increased. (b) UV-vis absorbance changes of complex 3 at 460 nm (black squares), 372 nm (red squares), and 342 nm (blue squares) upon adjustment of pH. | ||
Furthermore, a Pourbaix diagram was constructed for the first two redox processes using square wave voltammetry (SWV, Fig. 11). The diagram was analyzed with the use of eqn (3), where E1/2 is the observed redox potential,  is the standard redox potential of the couple at pH 0, nH+ and ne− are the number of protons and electrons, respectively, associated with the redox process. The analysis revealed that the first and second redox processes are not proton-coupled above pH 1 and 2, respectively. The observed slopes of −2 and −4 mV per pH unit are close to the expected slope of zero. Deviation of the experimental slopes is in line with previous observations on the nominally pH-independent redox couples of surface-confined metal complexes.18d,26 At lower pH, both redox processes become proton-coupled with slopes of −34 and −38 mV per pH unit. These values are close to the expected value of −30 mV per pH unit for two-electron-one-proton coupled processes (eqn (3)).
 | (3) |
 | ||
| Fig. 11 Pourbaix diagram obtained from square wave voltammetry (SWV) measurements of complex 3 in 0.1 M Britton–Robinsson buffer (Fig. S32†). | ||
The intercept of the pH-dependent and independent segments in the Pourbaix diagram provides the pKa values for the RuIIRuII species without (pKa ≈ 0.8) and with coordinated MeCN (pKa ≈ 1.8). The former value agrees well with the pKa value obtained from the spectrophotometric pH titration. On the other hand, no apparent transition was observed in the UV-vis absorption at pH ≈ 2. This can be explained by the smaller concentration of RuIIRuII species with coordinated MeCN present in solution.
Collectively, the above data suggests a refined square scheme which includes two proton-coupled electron transfer processes (Fig. 12). In this scheme at least one of the carboxylate groups is protonated at the RuIIRuII state and the protonation state of the other group is not clear. However, it is likely that protonation of the second carboxylate group is prohibited due to charge build-up. If both of the carboxylate groups were protonated, the complex would become +2 charged in the RuIIRuII state and +4 charged in the RuIIIRuIII state. Stabilization of such highly charged species would presumably not be favorable in the employed aqueous solvent containing 10% MeCN. There is a difference in chemical environment of the metal centers at different protonation states and hysteresis between transfer of the first and second electrons could be expected for the RuIIIRuIII/RuIIRuII couple. However, this difference is relatively small for the RuIIRuII species without coordinated MeCN and results in only slight asymmetry of the CV peaks of complex 3 (Fig. 4). The difference in chemical environment of the metal centers is even smaller for species with coordinated MeCN, as the protonated site is not bound to the metal, and is consistent with symmetrical CV peaks.
 | ||
| Fig. 12 Summary of the proposed transformations of complex 3 based on electrochemical and spectrophotometric studies. E° are determined by extrapolation of linear fitting from the Pourbaix diagram. | ||
Catalytic activity
The catalytic activity of complex 3 for oxidation of water was studied using CAN as the sacrificial oxidant (Fig. 13a) and with a mixture of photosensitizer and sacrificial electron acceptor under blue LED illumination (Fig. 13b). In the light-driven experiments, [Ru(bpy)2(bdc)](PF6)2 (bpy = 2,2′-bipyridine, bdc = 4,4′-(dicarboxylic acid)-2,2′-bipyridine) was used as the photosensitizer and sodium persulfate (Na2S2O8) was used as the sacrificial electron acceptor. Both systems have been widely used for evaluation of the catalytic activity of WOCs.2 CAN represents a strong oxidant with E(CeIV/CeIII) ≈ 1.7 V vs. NHE at pH 1.0. This oxidant is unstable at pH > 2, where insoluble CeO2·2H2O. can be formed.27 For this reason CAN is only employed for water oxidation at pH < 2. Photogenerated [Ru(bpy)2(bdc)]3+ is a weaker oxidant with E(RuIII/RuII) ≈ 1.34 V vs. NHE at pH 7.0 (Fig. S30†) and has to be used at higher pH than CAN to provide sufficient thermodynamic driving force for oxidation of water. An advantage of the latter system is that it allows screening the catalytic activity of WOCs at conditions relevant to future incorporation of these catalysts into complete photoelectrochemical water splitting devices. To obtain a reliable comparison of the catalytic activity of complexes 1–3, the previously developed complexes 1 and 2 were also synthesized and evaluated under the same conditions as complex 3. Such an approach is important as relatively small variations in reaction conditions or the use of different techniques to monitor the reaction progress can have a pronounced effect on the measured activity.28 | ||
| Fig. 13 Oxygen evolution driven by CAN (a) and [Ru(bpy)2(bdc)]2+/Na2S2O8 under blue LED irradiation (b), monitored by on-line mass spectrometry. Complexes 1 (red), 2 (blue), 3 (green), as well as bank experiments without any catalyst (black) were performed at identical conditions and concentrations of all reaction components (in case of complex 3 the concentration was divided by two to maintain the same molar concentration of ruthenium). Experimental conditions: (a) [1] = [2] = 4 μM, [3] = 2 μM, [CAN] = 0.1 M, aqueous TfOH (0.1 M) with 10% MeCN as solvent, solution of catalyst (1.0 mL) is injected to the reaction chamber containing CAN under He at time = 0. (b) [1] = [2] = 40 μM, [3] = 20 μM, [[Ru(bpy)2(bdc)](PF6)2] = 0.3 mM, [Na2S2O8] = 20 mM, aqueous phosphate buffer (25 mM, pH 7.0) with 10% MeCN as solvent, solution of catalyst (1.0 mL) is injected to the reaction chamber containing the photosensitizer and the sacrificial electron acceptor under He and the light is turned on at time = 0, which is 5 min after injection of the catalyst solution. | ||
Formation of dioxygen was observed for all three complexes in both chemical- and light-driven experiments. Complex 1 displayed the highest activity for water oxidation driven by CAN, while 2 had a significantly lower activity and 3 demonstrated an intermediate value in terms of turnover number (TON) and was close to complex 1 in terms of turnover frequency (TOF) (Table 1). For all three catalysts the rate of oxygen evolution decreased over the course of the reaction, probably due to degradation of the catalyst. For catalyst 3, a freshly prepared solution of the oxidant was added to the reaction mixture after ca. 75 min of catalysis, but no additional oxygen evolution was observed (Fig. S31†), supporting degradation of the initially used catalyst over degradation or depletion of the oxidant.29 Light-driven water oxidation resulted in essentially constant rate of oxygen evolution for 35 min for catalysts 1 and 3, and for 20 min for catalyst 2. After that only a minor amount of oxygen was produced. Similar to the experiments where CAN was employed as the chemical oxidant, it is likely that the evolution of oxygen is ceased due to decomposition of the catalysts.
| Catalyst | TON (per Ru atom after 60 min) | Maximum TOF (min−1) | O2 yield (% after 60 min) | |||
|---|---|---|---|---|---|---|
| CAN | Light | CANa | Lightb | CANc | Lightd | |
| a Slope of the linear fit of TON vs. time graph at 1 to 3 min. b Slope of the linear fit of TON vs. time graph at 3 to 6 min. c Calculated as n(O2)/(0.25 × n(CAN)). d Calculated as n(O2)/(0.5 × n(Na2S2O8)). | ||||||
| 1 | 980 | 80 | 77 | 2.4 | 11.4 | 32.5 |
| 2 | 65 | 50 | 1.3 | 2.4 | 1.1 | 20.0 |
| 3 | 700 | 73 | 70 | 2.0 | 7.8 | 29.0 |
Evolution of CO2 was also monitored during all water oxidation experiments (Fig. 14). In the chemical water oxidation experiments using CAN as oxidant, only trace amounts of CO2 could be observed for all three catalysts. In contrast, significant amounts of CO2 were produced in the light-driven experiments (Fig. 14; note the different scales in Fig. 14a and b). The highest amount of CO2 was evolved during the blank experiment without any catalyst, demonstrating that photogenerated [Ru(bpy)2(bdc)]3+ is highly reactive and starts to oxidize MeCN and/or itself to produce CO2 if the more stable RuII state ([Ru(bpy)2(bdc)]2+) is not regenerated by electron transfer from the catalyst. The evolution of CO2 was accelerated for all catalysts shortly after the amount of the evolved oxygen reached its maximum value. Such behavior suggests that the oxygen evolution was not terminated due to decomposition of the photosensitizer or accumulation of dioxygen, which could compete with Na2S2O8 for quenching of the photosensitizer.7a
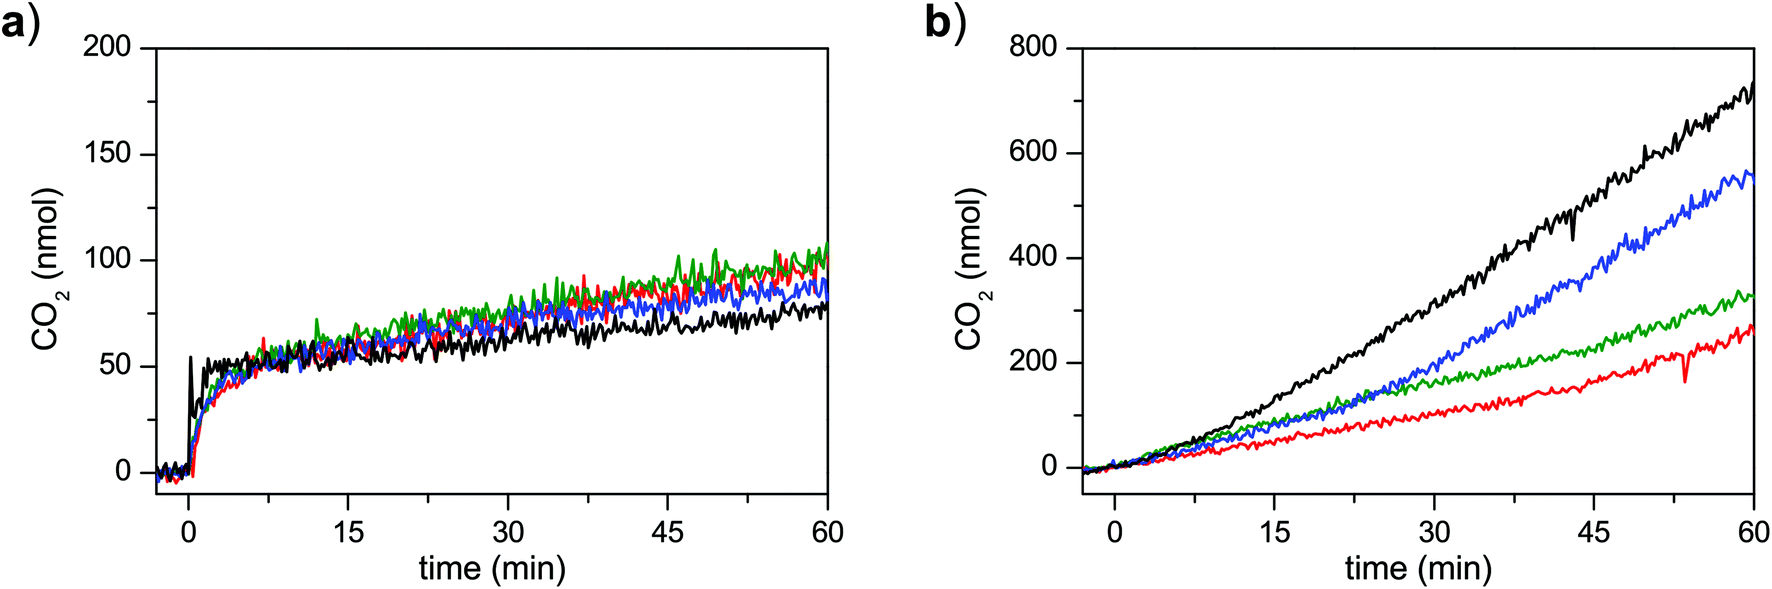 | ||
| Fig. 14 Evolution of CO2 during water oxidation experiments driven by (a) CAN, and (b) [Ru(bpy)2(bdc)]2+/Na2S2O8 under blue LED irradiation monitored by on-line mass spectrometry. Conditions are as described in Fig. 13. Experiments with complexes 1 (red), 2 (blue), 3 (green), as well as blank experiments without any catalyst (black) were conducted. | ||
The rate of oxygen evolution for all three catalysts was similar in the light-driven water oxidation experiments. Such behavior could be expected if all of the studied catalysts are transformed into the same active catalyst. In this regard, hydrolysis of the amide bonds in 2 and 3 could lead to formation of catalyst 1. However, such assumption is inconsistent with the lower maximum TON observed for catalyst 2 compared to catalysts 1 and 3. An alternative explanation for the similar dioxygen evolution rates could be that photogeneration of the [Ru(bpy)2(bdc)]3+ oxidant is rate-limiting at the employed conditions. Finally, all of the catalysts might display similar activity simply due to similarity of the operating mechanisms and the rate-determining step(s). A more detailed investigation of this peculiar kinetic behavior is ongoing.
Conclusions
A novel dinuclear ruthenium-based water oxidation catalyst 3 was synthesized and fully characterized. Insight into its redox behavior is provided, including a detailed description of the interaction of the catalyst with MeCN, which is commonly employed as a co-solvent when studying WOCs. Importantly, several of the reported WOCs have limited solubility in water and co-solvents had to be used to allow for solution-based mechanistic studies. At the same time, the use of co-solvents results in new interactions which can greatly complicate interpretation of the analytical data. In light of this, we believe that the current study will facilitate experimental design and interpretation of analytical data obtained for other WOCs. The new catalyst displayed high activity for both chemical- and light-driven water oxidation, demonstrating viability of the proposed metal-coordinated carboxamide linker.Acknowledgements
Financial support from Swedish Research Council (621-2013-4872), the Knut and Alice Wallenberg Foundation and the Carl Trygger Foundation is gratefully acknowledged. The authors would also like to thank Dr Torbjörn Åkermark for technical assistance with the on-line mass spectrometry experiments.Notes and references
- R. L. House, N. Y. M. Iha, R. L. Coppo, L. Alibabaei, B. D. Sherman, P. Kang, M. K. Brennaman, P. G. Hoertz and T. J. Meyer, J. Photochem. Photobiol., C, 2015, 25, 32–45 CrossRef CAS.
- (a) L. Tong and R. P. Thummel, Chem. Sci., 2016, 7, 6591–6603 RSC; (b) M. Yamamoto and K. Tanaka, ChemPlusChem, 2016, 81, 1028–1044 CrossRef CAS; (c) J. D. Blakemore, R. H. Crabtree and G. W. Brudvig, Chem. Rev., 2015, 115, 12974–13005 CrossRef CAS PubMed; (d) D. L. Ashford, M. K. Gish, A. K. Vannucci, M. K. Brennaman, J. L. Templeton, J. M. Papanikolas and T. J. Meyer, Chem. Rev., 2015, 115, 13006–13049 CrossRef CAS PubMed; (e) Z. Yu, F. Li and L. Sun, Energy Environ. Sci., 2015, 8, 760–775 RSC; (f) M. D. Kärkäs, O. Verho, E. V. Johnston and B. Åkermark, Chem. Rev., 2014, 114, 11863–12001 CrossRef PubMed; (g) M. D. Kärkäs, E. V. Johnston, O. Verho and B. Åkermark, Acc. Chem. Res., 2014, 47, 100–111 CrossRef PubMed.
- (a) M. M. Najafpour, G. Renger, M. Holynska, A. N. Moghaddam, E.-M. Aro, R. Carpentier, H. Nishihara, J. J. Eaton-Rye, J.-R. Shen and S. I. Allakhverdiev, Chem. Rev., 2016, 116, 2886–2936 CrossRef CAS PubMed; (b) M. D. Kärkäs and B. Åkermark, Dalton Trans., 2016, 45, 14421–14461 RSC; (c) M. A. Asraf, H. A. Younus, M. Yusubov and F. Verpoort, Catal. Sci. Technol., 2015, 5, 4901–4925 RSC; (d) A. R. Parent and K. Sakai, ChemSusChem, 2014, 7, 2070–2080 CrossRef CAS PubMed.
- J. M. Thomsen, D. L. Huang, R. H. Crabtree and G. W. Brudvig, Dalton Trans., 2015, 44, 12452–12472 RSC.
- (a) M. D. Kärkäs and B. Åkermark, Chem. Rec., 2016, 16, 940–963 CrossRef PubMed; (b) L. Duan, L. Wang, F. Li, F. Li and L. Sun, Acc. Chem. Res., 2015, 48, 2084–2096 CrossRef CAS PubMed; (c) M. Okamura and S. Masaoka, Chem. – Asian J., 2015, 10, 306–315 CrossRef CAS PubMed; (d) Q. Zeng, F. W. Lewis, L. M. Harwood and F. Hartl, Coord. Chem. Rev., 2015, 304–305, 88–101 CrossRef CAS.
- L. Wang, L. Duan, Y. Wang, M. S. G. Ahlquist and L. Sun, Chem. Commun., 2014, 50, 12947–12950 RSC.
- (a) S. Berardi, L. Francàs, S. Neudeck, S. Maji, J. Benet-Buchholz, F. Meyer and A. Llobet, ChemSusChem, 2015, 8, 3688–3696 CrossRef CAS PubMed; (b) T. M. Laine, M. D. Kärkäs, R.-Z. Liao, T. Åkermark, B.-L. Lee, E. A. Karlsson, P. E. M. Siegbahn and B. Åkermark, Chem. Commun., 2015, 51, 1862–1865 RSC.
- (a) L. Duan, Y. Xu, M. Gorlov, L. Tong, S. Andersson and L. Sun, Chem. – Eur. J., 2010, 16, 4659–4668 CrossRef CAS PubMed; (b) J. An, L. Duan and L. Sun, Faraday Discuss., 2012, 155, 267–275 RSC; (c) M. Hansen, F. Li, L. Sun and B. König, Chem. Sci., 2014, 5, 2683–2687 RSC.
- (a) L. Tong, M. Göthelid and L. Sun, Chem. Commun., 2012, 48, 10025–10027 RSC; (b) F. Li, L. Li, L. Tong, Q. Daniel, M. Göthelid and L. Sun, Chem. Commun., 2014, 50, 13948–13951 RSC.
- (a) K. Fan, F. Li, L. Wang, Q. Daniel, E. Gabrielsson and L. Sun, Phys. Chem. Chem. Phys., 2014, 16, 25234–25240 RSC; (b) K. Fan, F. Li, L. Wang, Q. Daniel, H. Chen, E. Gabrielsson, J. Sun and L. Sun, ChemSusChem, 2015, 8, 3242–3247 CrossRef CAS PubMed; (c) F. Li, K. Fan, B. Xu, E. Gabrielsson, Q. Daniel, L. Li and L. Sun, J. Am. Chem. Soc., 2015, 137, 9153–9159 CrossRef CAS PubMed.
- W. Rabten, M. D. Kärkäs, T. Åkermark, H. Chen, R.-Z. Liao, F. Tinnis, J. Sun, P. E. M. Siegbahn, P. G. Andersson and B. Åkermark, Inorg. Chem., 2015, 54, 4611–4620 CrossRef CAS PubMed.
- W. Rabten, T. Åkermark, M. D. Kärkäs, H. Chen, J. Sun, P. G. Andersson and B. Åkermark, Dalton Trans., 2016, 45, 3272–3276 RSC.
- (a) L. Francàs, X. Sala, E. Escudero-Adán, J. Benet-Buchholz, L. Escriche and A. Llobet, Inorg. Chem., 2011, 50, 2771–2781 CrossRef PubMed; (b) Y. Jiang, F. Li, B. Zhang, X. Li, X. Wang, F. Huang and L. Sun, Angew. Chem., Int. Ed., 2013, 52, 3398–3401 CrossRef CAS PubMed.
- The half-wave potentials (E1/2) were determined from the peak potentials (Ep) according to equation Ep = E1/2 − ΔE/2, where ΔE is the employed pulse amplitude (ΔE = 0.05 V).
- 2,2,2-Trifluoroethanol (TFE) was also considered as a co-solvent; however, mixing of a catalyst solution in TFE with aqueous phosphate buffer or TfOH resulted in precipitation of the complex, thus prohibiting solution-based studies using TFE as a co-solvent.
- Voltammetric peak currents are proportional to the scan rate or the square root of the scan rate for redox active species adsorbed to the electrode or diffusing in solution, respectively.
- The potential was converted based on the half-wave potential of the Fc+/Fc couple in CH2Cl2 (0.46 V vs. SCE).
- (a) L. Duan, L. Wang, A. K. Inge, A. Fischer, X. Zou and L. Sun, Inorg. Chem., 2013, 52, 7844–7852 CrossRef CAS PubMed; (b) M. V. Sheridan, B. D. Sherman, S. L. Marquard, Z. Fang, D. L. Ashford, K.-R. Wee, A. S. Gold, L. Alibabaei, J. A. Rudd, M. K. Coggins and T. J. Meyer, J. Phys. Chem. C, 2015, 119, 25420–25428 CrossRef CAS; (c) N. Song, J. J. Concepcion, R. A. Binstead, J. A. Rudd, A. K. Vannucci, C. J. Dares, M. K. Coggins and T. J. Meyer, Proc. Natl. Acad. Sci. U. S. A., 2015, 112, 4935–4940 CrossRef CAS PubMed; (d) D. L. Ashford, B. D. Sherman, R. A. Binstead, J. L. Templeton and T. J. Meyer, Angew. Chem., Int. Ed., 2015, 54, 4778–4781 CrossRef CAS PubMed.
- L. Tong, Y. Wang, L. Duan, Y. Xu, X. Cheng, A. Fischer, M. S. G. Ahlquist and L. Sun, Inorg. Chem., 2012, 51, 3388–3398 CrossRef CAS PubMed.
- A. Bard and L. Faulkner, Electrochemical Methods: Fundamentals and Applications, Wiley, 2000 Search PubMed.
- E. Laviron, J. Electroanal. Chem. Interfacial Electrochem., 1972, 35, 333–342 CrossRef CAS.
- The observed peak separation ΔEp = Epa − Epc can be attributed to the combined effects of electron transfer kinetics and iR drop caused by some uncompensated resistance.
- Note that eqn (1) and (2) are derived for chemical reaction following a reduction process and the sign of Ep and E1/2 should be reversed when the equations are applied to chemical reaction following an oxidation process.
- X. Sala, I. Romero, M. Rodríguez, A. Llobet, G. González, M. Martínez and J. Benet-Buchholz, Inorg. Chem., 2004, 43, 5403–5409 CrossRef CAS PubMed.
- E. Badaeva, V. V. Albert, S. Kilina, A. Koposov, M. Sykora and S. Tretiak, Phys. Chem. Chem. Phys., 2010, 12, 8902–8913 RSC.
- (a) A. Zaban, S. Ferrere and B. A. Gregg, J. Phys. Chem. B, 1998, 102, 452–460 CrossRef CAS; (b) D. L. Ashford, W. Song, J. J. Concepcion, C. R. K. Glasson, M. K. Brennaman, M. R. Norris, Z. Fang, J. L. Templeton and T. J. Meyer, J. Am. Chem. Soc., 2012, 134, 19189–19198 CrossRef CAS PubMed.
- S. A. Hayes, P. Yu, T. J. O'Keefe, M. J. O'Keefe and J. O. Stoffer, J. Electrochem. Soc., 2002, 149, C623–C630 CrossRef CAS.
- I. Corbucci, A. Petronilho, H. Müller-Bunz, L. Rocchigiani, M. Albrecht and A. Macchioni, ACS Catal., 2015, 5, 2714–2718 CrossRef CAS.
- (a) A. C. Sander, S. Maji, L. Francàs, T. Böhnisch, S. Dechert, A. Llobet and F. Meyer, ChemSusChem, 2015, 8, 1697–1702 CrossRef CAS PubMed; (b) S. Neudeck, S. Maji, I. López, S. Dechert, J. Benet-Buchholz, A. Llobet and F. Meyer, Inorg. Chem., 2016, 55, 2508–2521 CrossRef CAS PubMed.
Footnotes |
| † Electronic supplementary information (ESI) available: Detailed description of employed techniques, simulation of the CV background current, electrochemical determination of surface concentration and the rate constant from the forward-to-reverse peak current ratios, synthetic procedures and analytical data, additional electrochemical and spectroscopical data, SC-XRD analysis. CCDC 1507132 for Complex 3. For ESI and crystallographic data in CIF or other electronic format see DOI: 10.1039/C6DT03789E |
| ‡ Present address: Department of Chemistry, University of Michigan, Ann Arbor, 48109 Michigan, United States. |
| This journal is © The Royal Society of Chemistry 2016 |