 Open Access Article
Creative Commons Attribution 3.0 Unported Licence
[Ir(C^N)2(N^N)]+ emitters containing a naphthalene unit within a linker between the two cyclometallating ligands†
Andreas M.
Bünzli
a,
Antonio
Pertegás
b,
Cristina
Momblona
b,
José M.
Junquera-Hernández
b,
Edwin C.
Constable
a,
Henk J.
Bolink
b,
Enrique
Ortí
*b and
Catherine E.
Housecroft
 *a
*a
aDepartment of Chemistry, University of Basel, Spitalstrasse 51, CH-4056 Basel, Switzerland. E-mail: catherine.housecroft@unibas.ch
bInstituto de Ciencia Molecular, Universidad de Valencia, Catedrático José Beltrán 2, Paterna, E-46980, Spain. E-mail: enrique.orti@uv.es
First published on 23rd September 2016
Abstract
The synthesis of four cyclometallated [Ir(C^N)2(N^N)][PF6] compounds in which N^N is a substituted 2,2′-bipyridine (bpy) ligand and the naphthyl-centred ligand 2,7-bis(2-(2-(4-(pyridin-2-yl)phenoxy)ethoxy)ethoxy)naphthalene provides the two cyclometallating C^N units is reported. The iridium(III) complexes have been characterized by 1H and 13C NMR spectroscopies, mass spectrometry and elemental analysis, and their electrochemical and photophysical properties are described. Comparisons are made with a model [Ir(ppy)2(N^N)][PF6] compound (Hppy = 2-phenylpyridine). The complexes containing the naphthyl-unit exhibit similar absorption spectra and excitation at 280 nm leads to an orange emission. The incorporation of the naphthalene unit does not lead to a desirable blue contribution to the emission. Density functional theory calculations were performed to investigate the geometries of the complexes in their ground and first triplet excited states, as well as the energies and compositions of the highest-occupied and lowest unoccupied molecular orbital (HOMO and LUMO) manifolds. Trends in the HOMO–LUMO gaps agree with those observed electrochemically. The energy difference between the LUMO and the lowest unoccupied MO located on the naphthyl unit (LUMO+7) is large enough to explain why there is no contribution from the naphthyl-centred triplet excited state to the phosphorescence emission. Singlet excited states were also investigated. Light-emitting electrochemical cells (LECs) using the [Ir(C^N)2(N^N)][PF6] and [Ir(ppy)2(N^N)][PF6] complexes in the emissive layer were made and evaluated. The presence of the naphthyl-bridge between the cyclometallating units does not significantly alter the device response.
Introduction
Light-emitting electrochemical cells (LECs) are promising electroluminescent devices for highly efficient and low-cost applications in ultrathin and flexible lighting. The charged active layer sandwiched between two electrodes is either a conjugated light-emitting polymer1 or an ionic transition-metal complex (iTMC).2 The ionic nature of the active material allows the charged species to migrate towards the electrodes when a bias is applied, forming doped zones and thus lowering the injection barrier facilitating efficient electron and hole injection.3 Due to their particular stability, extremely high efficiencies and ability to tune the emission color, iTMCs incorporating iridium(III) (Ir-iTMCs) are by far the most versatile active materials used in iTMC-LECs.4,5 Ir-iTMCs are typically of the form [Ir(C^N)2(N^N)]+, where C^N is a cyclometallating ligand and N^N is an N,N-chelate. Since the high spin–orbit coupling of Ir-iTMCs permits intersystem-crossing from singlet to triplet states, iridium(III)-based materials achieve spin-forbidden phosphorescence emissions approaching photoluminescence quantum yields of 100%.6,7 After Slinker et al.8 reported the first Ir-iTMC-based LEC in 2004, a broad range of stable and efficient Ir-iTMC emitters has been developed, covering the whole visible range.4–7,9 A major challenge that remains is to attain white light emission.One approach to white-emitting LECs is to combine blue-green with red-emitting complexes in the active layer of the device or to mix three iTMCs of different colours (blue, red and orange).10–13 Other strategies (not uniquely based on iTMCs) include multifluorophoric conjugated polymers,14,15 a combined polymer-composite blue-light emitting layer with an orange ionic iridium complex,16,17 or employ a colour conversion layer.18,19 However, all these LEC devices only operate at low luminance values. The reason for the small number and poor performances of white-emitting LECs reported is largely ascribed to the lack of highly efficient and stable deep-blue-emitting complexes required for colour-mixing.
We now explore a possible approach to dual-emitting iTMCs for white-light emission which follows the principle of combining complementary colours by combining a blue-emitting naphthalene domain and orange-emitting [Ir(C^N)2(N^N)]+ complexes. The naphthalene component is accommodated within a linker between the two cyclometallating units in ligand H21 (Scheme 1).
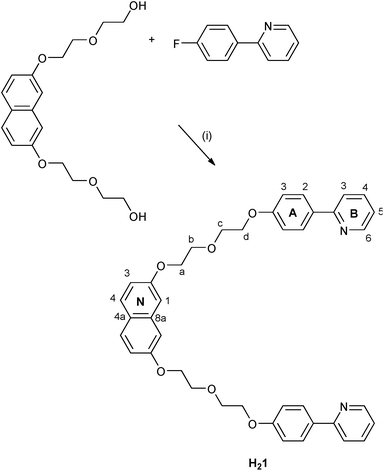 | ||
| Scheme 1 Synthesis of cyclometallating ligand H21 with atom labelling for NMR assignments. Conditions: (i) NaH, DMF, 120 °C, 24 h. | ||
Experimental
General
1H, 13C and 31P NMR spectra were recorded at room temperature using a Bruker Avance III-600, III-500 or III-400 NMR spectrometer. 1H and 13C NMR chemical shifts were referenced to residual solvent peaks with respect to δ(TMS) = 0 ppm and 31P NMR chemical shifts with respect to δ(85% aqueous H3PO4) = 0 ppm. Solution absorption and emission spectra were measured using an Agilent 8453 spectrophotometer and a Shimadzu RF-5301PC spectrofluorometer, respectively. Electrospray ionization (ESI) mass spectra were recorded on a Bruker esquire 3000plus instrument. Quantum yields in CH2Cl2 solution and powder were measured using a Hamamatsu absolute photoluminescence (PL) quantum yield spectrometer C11347 Quantaurus-QY. Emission lifetimes and powder emission spectra were measured with a Hamamatsu Compact Fluorescence lifetime Spectrometer C11367 Quantaurus-Tau, using an LED light source with λexc = 280 nm. Quantum yields and PL emission spectra in thin films were recorded using a Hamamatsu absolute quantum yield C9920. The preparation of the thin film samples consisted of deposition on a quartz plate (1 cm2) of the complex with addition of the ionic liquid 1-butyl-3-methylimidazolium hexafluorophosphate [Bmim][PF6]. These samples were excited using a light source with λexc = 320 nm at room temperature under ambient conditions.2,7-Bis[2-(2-hydroxyethoxy)ethoxy]naphthalene,20 ligands 2–521,22 and [Ir(ppy)2(4)][PF6]23 were prepared by standard procedures. Silica gel 60 was bought from Fluka.
Compound H21
A grey suspension of NaH (232 mg, 5.80 mmol) and 2,7-bis[2-(2-hydroxyethoxy)ethoxy]naphthalene (650 mg, 1.93 mmol) in dry DMF (30 mL) was rigorously stirred for 15 min before 2-(4-fluorophenyl)pyridine (1.00 g, 5.80 mmol) was added. The reaction mixture was heated under N2 at 120 °C for 24 h. After cooling to room temperature, the mixture was poured into water. A white precipitate was formed, which was separated by filtration and was washed with water. The solid was added to EtOH (300 mL) and the mixture boiled (15 min) before being filtered. The filtrate was evaporated to dryness to give H21 as a white solid (924 mg, 1.44 mmol, 74.6%). M.p. 129.1 °C. 1H NMR (500 MHz, CDCl3) δ/ppm 8.65 (ddd, J = 4.8, 1.8, 1.0 Hz, 2H, HB6), 7.92 (m, 4H, HA2), 7.70 (ddd, J = 8.0, 7.4, 1.8 Hz, 2H, HB4), 7.67–7.62 (overlapping m, 4H, HB3+N4), 7.17 (ddd, J = 7.3, 4.8, 1.2 Hz, 2H, HB5), 7.06–6.99 (overlapping m, 8H, HA3+N1+N3), 4.28–4.21 (m, 8H, Ha+d), 4.02–3.96 (m, 8H, Hb+c). 13C NMR (126 MHz, CDCl3) δ/ppm 159.8 (CA4), 157.4 (CN2), 157.2 (CB2), 149.7 (CB6), 136.8 (CB4), 135.9 (CN8a), 132.4 (CA1), 129.3 (CN4), 128.3 (CA2), 124.6 (CN4a), 121.6 (CB5), 120.0 (CB3), 116.6 (CN3), 115.0 (CA3), 106.4 (CN1), 70.1 (Cb), 70.1 (Cc), 67.7 (Cd), 67.6 (Ca). UV-Vis λ/nm (ε/L mol−1 cm−1) (CH2Cl2, 1.00 × 10⁻⁵ mol L−1) 237 (78![[thin space (1/6-em)]](https://www.rsc.org/images/entities/char_2009.gif) 000), 266 (33
000), 266 (33![[thin space (1/6-em)]](https://www.rsc.org/images/entities/char_2009.gif) 000), 285 (38
000), 285 (38![[thin space (1/6-em)]](https://www.rsc.org/images/entities/char_2009.gif) 000), 325 (6000), 350 sh (2000). Emission (CH2Cl2, 9.50 × 10⁻⁶ mol L−1, λexc = 237 nm) λem = 331, 344, 410 nm. ESI-MS m/z 643.6 [M + H]+ (base peak, calc. 643.3). Found C 74.44, H 5.91, N 4.58; C40H38N2O6 requires C 74.75, H 5.96, N 4.36%.
000), 325 (6000), 350 sh (2000). Emission (CH2Cl2, 9.50 × 10⁻⁶ mol L−1, λexc = 237 nm) λem = 331, 344, 410 nm. ESI-MS m/z 643.6 [M + H]+ (base peak, calc. 643.3). Found C 74.44, H 5.91, N 4.58; C40H38N2O6 requires C 74.75, H 5.96, N 4.36%.
[Ir2(1)2(μ-Cl)2]
H21 (200 mg, 0.311 mmol) and IrCl3·xH2O (assay for Ir = 52.77%, 176 mg, 0.483 mmol) were heated in a mixture of 2-ethoxyethanol (90 mL) and water (30 mL) at reflux (110 °C) for 24 h. The greenish suspension was allowed to cool to room temperature, filtered and the solid washed with water. The filtrate was extracted twice with CH2Cl2 and then extracted with water (3 × 100 mL). The organic phase was dried over MgSO4, filtered and evaporated to dryness. The solid products were combined. The product was purified by column chromatography (silica, CH2Cl2 changing to CH2Cl2![[thin space (1/6-em)]](https://www.rsc.org/images/entities/char_2009.gif) :
:![[thin space (1/6-em)]](https://www.rsc.org/images/entities/char_2009.gif) MeOH 100
MeOH 100![[thin space (1/6-em)]](https://www.rsc.org/images/entities/char_2009.gif) :
:![[thin space (1/6-em)]](https://www.rsc.org/images/entities/char_2009.gif) 1) and [Ir2(1)2(μ-Cl)2] was isolated as a yellow solid (90.0 mg, 0.052 mmol, 33.4%). 1H NMR (500 MHz, CD2Cl2) δ/ppm 9.11 (dd, J = 5.8, 0.9 Hz, 2H, HB6), 7.71–7.63 (overlapping m, 4H, HB4+N4), 7.56 (d, J = 7.9 Hz, 2H, HB3), 7.20 (d, J = 8.7 Hz, 2H, HA3), 6.97 (dd, J = 8.8, 2.5 Hz, 2H, HN3), 6.90 (d, J = 2.4 Hz, 2H, HN1), 6.71 (ddd, J = 7.3, 5.8, 1.4 Hz, 2H, HB5), 6.33 (dd, J = 8.5, 2.5 Hz, 2H, HA4), 5.32 (d, J = 2.6 Hz, 2H, HA6), 4.04–3.94 (overlapping m, 4H, Ha+a′), 3.87 (m, 2H, Hd/d′), 3.81–3.73 (overlapping m, 4H, Hb/b′+d/d′), 3.65 (m, 2H, Hb/b′), 3.61–3.57 (overlapping m, 4H, Hc+c′). 13C NMR (126 MHz, CD2Cl2) δ/ppm 168.2 (CB2), 159.5 (CA5), 157.7 (CN2), 151.7 (CB6), 147.3 (CA1), 137.6 (CA2), 137.0 (CB4), 136.4 (CN8a), 129.3 (CN4), 125.5 (CA3), 124.9 (CN4a), 121.8 (CB5), 118.4 (CB3), 117.2 (CN3), 116.6 (CA6), 108.6 (CA4), 107.5 (CN1), 70.3 (Cc), 70.1 (Cb), 67.6 (Ca+d). ESI-MS m/z 833.5 [Ir(1)]+ (base peak, calc. 833.2). The complex was used in the next step without further purification.
1) and [Ir2(1)2(μ-Cl)2] was isolated as a yellow solid (90.0 mg, 0.052 mmol, 33.4%). 1H NMR (500 MHz, CD2Cl2) δ/ppm 9.11 (dd, J = 5.8, 0.9 Hz, 2H, HB6), 7.71–7.63 (overlapping m, 4H, HB4+N4), 7.56 (d, J = 7.9 Hz, 2H, HB3), 7.20 (d, J = 8.7 Hz, 2H, HA3), 6.97 (dd, J = 8.8, 2.5 Hz, 2H, HN3), 6.90 (d, J = 2.4 Hz, 2H, HN1), 6.71 (ddd, J = 7.3, 5.8, 1.4 Hz, 2H, HB5), 6.33 (dd, J = 8.5, 2.5 Hz, 2H, HA4), 5.32 (d, J = 2.6 Hz, 2H, HA6), 4.04–3.94 (overlapping m, 4H, Ha+a′), 3.87 (m, 2H, Hd/d′), 3.81–3.73 (overlapping m, 4H, Hb/b′+d/d′), 3.65 (m, 2H, Hb/b′), 3.61–3.57 (overlapping m, 4H, Hc+c′). 13C NMR (126 MHz, CD2Cl2) δ/ppm 168.2 (CB2), 159.5 (CA5), 157.7 (CN2), 151.7 (CB6), 147.3 (CA1), 137.6 (CA2), 137.0 (CB4), 136.4 (CN8a), 129.3 (CN4), 125.5 (CA3), 124.9 (CN4a), 121.8 (CB5), 118.4 (CB3), 117.2 (CN3), 116.6 (CA6), 108.6 (CA4), 107.5 (CN1), 70.3 (Cc), 70.1 (Cb), 67.6 (Ca+d). ESI-MS m/z 833.5 [Ir(1)]+ (base peak, calc. 833.2). The complex was used in the next step without further purification.
[Ir(1)(MeOH)2][PF6]
A yellow suspension of [Ir2(1)2(μ-Cl)2] (188 mg, 0.108 mmol) and AgPF6 (59.9 mg, 0.237 mmol) in MeOH (10 mL) were stirred at room temperature for 1.5 h. The reaction mixture was filtered over celite, washed with MeOH and evaporated to dryness to give the product as a yellow solid (223 mg, 0.214 mmol, 99.1%). 1H NMR (500 MHz, CD3OD) δ/ppm 8.75 (ddd, J = 5.8, 1.4, 0.7 Hz, 2H, HB6), 7.87 (ddd, J = 8.2, 7.5, 1.5 Hz, 2H, HB4), 7.70–7.63 (overlapping m, 4H, HB3+N4), 7.37 (ddd, J = 7.3, 5.8, 1.4 Hz, 2H, HB5), 7.16 (d, J = 8.6 Hz, 2H, HA3), 6.97 (dd, J = 8.9, 2.5 Hz, 2H, HN3), 6.89 (d, J = 2.4 Hz, 2H, HN1), 6.28 (dd, J = 8.6, 2.5 Hz, 2H, HA4), 5.56 (d, J = 2.5 Hz, 2H, HA6), 3.95 (m, 4H, Ha+a′), 3.88 (m, 2H, Hd/d′), 3.83–3.79 (m, 2H, Hd/d′), 3.76 (m, 2H, Hb/b′), 3.68 (m, 2H, Hb/b′), 3.63 (m, 4H, Hc+c′), 3.34 (s, 6H, HMe). 13C NMR (126 MHz, CD3OD) δ/ppm 168.9 (CB2), 160.5 (CA5), 158.6 (CN2), 149.7 (CB6), 141.0 (CA1), 139.9 (CB4), 139.0 (CA2), 137.4 (CN8a), 129.8 (CN4), 126.7 (CA3), 125.9 (CN4a), 122.6 (CB5), 120.0 (CA6), 119.6 (CB3), 117.7 (CN3), 110.3 (CA4), 108.5 (CN1), 71.1 (Cb), 70.7 (Cc), 68.5 (Cd), 68.4 (Ca), 49.9 (CMeOH). ESI-MS m/z 833.6 [Ir(1)]+ (base peak, calc. 833.2). The complex was used in the next step without further purification.[Ir(1)(2)][PF6]
A suspension of [Ir(1)(MeOH)2][PF6] (141 mg, 0.135 mmol), 2 (42.0 mg, 0.136 mmol) and NH4PF6 (220 mg, 1.35 mmol) in MeOH (10 mL) was heated at reflux for 20 h. The orange reaction mixture was filtered through a piece of cotton and the filtrate was evaporated to dryness. The residue was purified by column chromatography (silica, CH2Cl2 changing to CH2Cl2![[thin space (1/6-em)]](https://www.rsc.org/images/entities/char_2009.gif) :
:![[thin space (1/6-em)]](https://www.rsc.org/images/entities/char_2009.gif) MeOH 100
MeOH 100![[thin space (1/6-em)]](https://www.rsc.org/images/entities/char_2009.gif) :
:![[thin space (1/6-em)]](https://www.rsc.org/images/entities/char_2009.gif) 0.25, then to CH2Cl2
0.25, then to CH2Cl2![[thin space (1/6-em)]](https://www.rsc.org/images/entities/char_2009.gif) :
:![[thin space (1/6-em)]](https://www.rsc.org/images/entities/char_2009.gif) MeOH 100
MeOH 100![[thin space (1/6-em)]](https://www.rsc.org/images/entities/char_2009.gif) :
:![[thin space (1/6-em)]](https://www.rsc.org/images/entities/char_2009.gif) 1). [Ir(1)(2)][PF6] was isolated as an orange solid (96.0 mg, 0.075 mmol, 55.3%). 1H NMR (500 MHz, CD2Cl2) δ/ppm 8.37 (dd, J = 8.1, 1.2 Hz, 2H, HE3), 8.10 (t, J = 7.9 Hz, 2H, HE4), 8.06 (dd, J = 5.9, 0.8 Hz, 2H, HB6), 7.70 (ddd, J = 8.4, 7.5, 1.5 Hz, 2H, HB4), 7.66 (d, J = 8.8 Hz, 2H, HN4), 7.30 (overlapping m, 4H, HB3+E5), 7.01 (ddd, J = 7.3, 5.9, 1.4 Hz, 2H, HB5), 6.98–6.90 (overlapping m, 6H, HN3+N1+G4), 6.75–6.69 (overlapping m, 6H, HB4+G3), 6.55 (br, 4H, HG2), 5.99 (dd, J = 8.6, 2.5 Hz, 2H, HA4), 4.62 (d, J = 2.5 Hz, 2H, HA6), 4.06–3.97 (overlapping m, 4H, Ha+a′), 3.77 (m, 2H, Hb/b′), 3.71 (m, 2H, Hd/d′), 3.66 (m, 2H, Hb/b′), 3.55 (m, 2H, Hd/d′), 3.53–3.45 (overlapping m, 4H, Hc+c′). 13C NMR (126 MHz, CD2Cl2) δ/ppm 168.1 (CB2), 165.7 (CE6), 159.4 (CE2), 159.2 (CA5), 157.9 (CN2), 150.3 (CB6), 149.3 (CA1), 139.8 (CE4), 138.3 (CG1), 138.3 (CB4), 136.4(CN8a), 135.4 (CA2), 130.1 (CE5), 129.3 (CN4), 128.8 (CG4), 127.9 (CG2), 127.9 (CG3), 125.9 (CA3), 125.0 (CN4a), 124.7 (CE3), 121.2 (CB5), 119.0 (CB3), 117.3 (CN3), 116.2 (CA6), 109.4 (CA4), 107.8 (CN1), 70.6 (Cb+b′), 69.8 (Cc+c′), 67.9 (Ca+a′), 67.3 (Cd+d′). UV-Vis λ/nm (ε/L mol−1 cm−1) (CH2Cl2, 1.00 × 10⁻⁵ mol L−1) 237 (102
1). [Ir(1)(2)][PF6] was isolated as an orange solid (96.0 mg, 0.075 mmol, 55.3%). 1H NMR (500 MHz, CD2Cl2) δ/ppm 8.37 (dd, J = 8.1, 1.2 Hz, 2H, HE3), 8.10 (t, J = 7.9 Hz, 2H, HE4), 8.06 (dd, J = 5.9, 0.8 Hz, 2H, HB6), 7.70 (ddd, J = 8.4, 7.5, 1.5 Hz, 2H, HB4), 7.66 (d, J = 8.8 Hz, 2H, HN4), 7.30 (overlapping m, 4H, HB3+E5), 7.01 (ddd, J = 7.3, 5.9, 1.4 Hz, 2H, HB5), 6.98–6.90 (overlapping m, 6H, HN3+N1+G4), 6.75–6.69 (overlapping m, 6H, HB4+G3), 6.55 (br, 4H, HG2), 5.99 (dd, J = 8.6, 2.5 Hz, 2H, HA4), 4.62 (d, J = 2.5 Hz, 2H, HA6), 4.06–3.97 (overlapping m, 4H, Ha+a′), 3.77 (m, 2H, Hb/b′), 3.71 (m, 2H, Hd/d′), 3.66 (m, 2H, Hb/b′), 3.55 (m, 2H, Hd/d′), 3.53–3.45 (overlapping m, 4H, Hc+c′). 13C NMR (126 MHz, CD2Cl2) δ/ppm 168.1 (CB2), 165.7 (CE6), 159.4 (CE2), 159.2 (CA5), 157.9 (CN2), 150.3 (CB6), 149.3 (CA1), 139.8 (CE4), 138.3 (CG1), 138.3 (CB4), 136.4(CN8a), 135.4 (CA2), 130.1 (CE5), 129.3 (CN4), 128.8 (CG4), 127.9 (CG2), 127.9 (CG3), 125.9 (CA3), 125.0 (CN4a), 124.7 (CE3), 121.2 (CB5), 119.0 (CB3), 117.3 (CN3), 116.2 (CA6), 109.4 (CA4), 107.8 (CN1), 70.6 (Cb+b′), 69.8 (Cc+c′), 67.9 (Ca+a′), 67.3 (Cd+d′). UV-Vis λ/nm (ε/L mol−1 cm−1) (CH2Cl2, 1.00 × 10⁻⁵ mol L−1) 237 (102![[thin space (1/6-em)]](https://www.rsc.org/images/entities/char_2009.gif) 000), 280 (44
000), 280 (44![[thin space (1/6-em)]](https://www.rsc.org/images/entities/char_2009.gif) 000), 312 (36
000), 312 (36![[thin space (1/6-em)]](https://www.rsc.org/images/entities/char_2009.gif) 000), 325 (33
000), 325 (33![[thin space (1/6-em)]](https://www.rsc.org/images/entities/char_2009.gif) 000), 350 sh (17
000), 350 sh (17![[thin space (1/6-em)]](https://www.rsc.org/images/entities/char_2009.gif) 000), 400 sh (6000). ESI-MS m/z 1141.3 [M − PF6]+ (base peak, calc. 1141.4). Found C 57.75, H 4.61, N 4.56; C62H52F6IrN4O6P requires C 57.89, H 4.07, N 4.36%.
000), 400 sh (6000). ESI-MS m/z 1141.3 [M − PF6]+ (base peak, calc. 1141.4). Found C 57.75, H 4.61, N 4.56; C62H52F6IrN4O6P requires C 57.89, H 4.07, N 4.36%.
[Ir(1)(3)][PF6]
The method was as for [Ir(1)(2)][PF6] starting with [Ir(1)(MeOH)2][PF6] (114 mg, 0.109 mmol), 3 (25.6 mg, 0.010 mmol) and NH4PF6 (178 mg, 1.09 mmol) in MeOH (10 mL). Purification by column chromatography used silica eluting CH2Cl2 changing to CH2Cl2![[thin space (1/6-em)]](https://www.rsc.org/images/entities/char_2009.gif) :
:![[thin space (1/6-em)]](https://www.rsc.org/images/entities/char_2009.gif) MeOH 100
MeOH 100![[thin space (1/6-em)]](https://www.rsc.org/images/entities/char_2009.gif) :
:![[thin space (1/6-em)]](https://www.rsc.org/images/entities/char_2009.gif) 0.25 then 100
0.25 then 100![[thin space (1/6-em)]](https://www.rsc.org/images/entities/char_2009.gif) :
:![[thin space (1/6-em)]](https://www.rsc.org/images/entities/char_2009.gif) 1. [Ir(1)(3)][PF6] was isolated as an orange solid (60.0 mg, 0.050 mmol, 45.5%). 1H NMR (500 MHz, CD2Cl2) δ/ppm 8.53–8.47 (overlapping m, 2H, HF3+E3), 8.19 (t, J = 7.9 Hz, 1H, HF4), 8.10 (td, J = 8.0, 1.6 Hz, 1H, HE4), 7.90 (dd, J = 5.5, 1.0 Hz, 1H, HE6), 7.74 (ddd, J = 8.4, 7.5, 1.5 Hz, 1H, HB4), 7.70–7.65 (overlapping m, 2H, HN4+N5), 7.64 (ddd, J = 8.2, 7.5, 1.5 Hz, 1H, HD4), 7.54 (d, J = 8.1 Hz, 1H, HB3), 7.50–7.43 (overlapping m, 3H, HB6+D6+F5), 7.40 (d, J = 8.2 Hz, 1H, HD3), 7.37 (ddd, J = 7.6, 5.6, 1.1 Hz, 1H, HE5), 7.10 (d, J = 8.7 Hz, 1H, HC3), 7.00–6.89 (overlapping m, 8H, HN3+N6+D5+G4+A3+N1+N8+B5), 6.76 (broadened t, J ∼ 7.0 Hz, 2H, HG3), 6.57 (br, 2H, HG2), 6.41 (dd, J = 8.6, 2.5 Hz, 1H, HC4), 6.11 (dd, J = 8.6, 2.5 Hz, 1H, HA4), 5.38 (d, J = 2.5 Hz, 1H, HC6), 4.91 (d, J = 2.5 Hz, 1H, HA6), 4.10–3.93 (overlapping m, 5H, Ha+a′+e+e′+h/h′), 3.88–3.77 (overlapping m, 4H, Hh/h′+d/d′+b/b′+f/f′), 3.74–3.61 overlapping (m, 7H, Hd/d′+b/b′+f/f′+c+c′+g+g′). 13C NMR (126 MHz, CD2Cl2) δ/ppm 169.0 (CB2), 167.4 (CD2), 166.3 (CF6), 160.6 (CC5), 159.8 (CA5), 157.9 (CN2/N7), 157.9 (CN2/N7), 157.4 (CE1), 157.2 (CF2), 153.8 (CA1), 151.0 (CE6), 149.3 (CD6), 149.1 (CC1), 148.9 (CB6), 140.1 (CF4), 139.8 (CE4), 138.5 (CD4), 138.4 (CG1), 138.4 (CB4), 136.5 (CN8a), 136.4 (CA2), 136.3 (CC2), 130.6 (CF5), 129.4 (CG4), 129.4 (CN5), 129.3 (CN4), 128.2 (CE5), 128.2 (CG3), 128.0 (CG2), 126.6 (CC3), 126.3 (CA3), 125.5 (CE3), 125.0 (CN4a), 124.1 (CF3), 122.5 (CD5), 121.6 (CB5), 119.5 (CB3), 119.4 (CD3), 117.6 (CA6), 117.3 (CN3+N6), 116.5 (CC6), 109.9 (CC4), 108.7 (CA4), 107.9 (CN8), 107.7 (CN1), 70.6 (CCH2), 70.4 (CCH2), 70.3 (CCH2), 70.0 (CCH2), 68.0 (CCH2), 67.9 (CCH2), 67.7 (CCH2), 67.5 (CCH2). UV-Vis λ/nm (ε/L mol−1 cm−1) (CH2Cl2, 1.00 × 10⁻⁵ mol L−1) 237 (99
1. [Ir(1)(3)][PF6] was isolated as an orange solid (60.0 mg, 0.050 mmol, 45.5%). 1H NMR (500 MHz, CD2Cl2) δ/ppm 8.53–8.47 (overlapping m, 2H, HF3+E3), 8.19 (t, J = 7.9 Hz, 1H, HF4), 8.10 (td, J = 8.0, 1.6 Hz, 1H, HE4), 7.90 (dd, J = 5.5, 1.0 Hz, 1H, HE6), 7.74 (ddd, J = 8.4, 7.5, 1.5 Hz, 1H, HB4), 7.70–7.65 (overlapping m, 2H, HN4+N5), 7.64 (ddd, J = 8.2, 7.5, 1.5 Hz, 1H, HD4), 7.54 (d, J = 8.1 Hz, 1H, HB3), 7.50–7.43 (overlapping m, 3H, HB6+D6+F5), 7.40 (d, J = 8.2 Hz, 1H, HD3), 7.37 (ddd, J = 7.6, 5.6, 1.1 Hz, 1H, HE5), 7.10 (d, J = 8.7 Hz, 1H, HC3), 7.00–6.89 (overlapping m, 8H, HN3+N6+D5+G4+A3+N1+N8+B5), 6.76 (broadened t, J ∼ 7.0 Hz, 2H, HG3), 6.57 (br, 2H, HG2), 6.41 (dd, J = 8.6, 2.5 Hz, 1H, HC4), 6.11 (dd, J = 8.6, 2.5 Hz, 1H, HA4), 5.38 (d, J = 2.5 Hz, 1H, HC6), 4.91 (d, J = 2.5 Hz, 1H, HA6), 4.10–3.93 (overlapping m, 5H, Ha+a′+e+e′+h/h′), 3.88–3.77 (overlapping m, 4H, Hh/h′+d/d′+b/b′+f/f′), 3.74–3.61 overlapping (m, 7H, Hd/d′+b/b′+f/f′+c+c′+g+g′). 13C NMR (126 MHz, CD2Cl2) δ/ppm 169.0 (CB2), 167.4 (CD2), 166.3 (CF6), 160.6 (CC5), 159.8 (CA5), 157.9 (CN2/N7), 157.9 (CN2/N7), 157.4 (CE1), 157.2 (CF2), 153.8 (CA1), 151.0 (CE6), 149.3 (CD6), 149.1 (CC1), 148.9 (CB6), 140.1 (CF4), 139.8 (CE4), 138.5 (CD4), 138.4 (CG1), 138.4 (CB4), 136.5 (CN8a), 136.4 (CA2), 136.3 (CC2), 130.6 (CF5), 129.4 (CG4), 129.4 (CN5), 129.3 (CN4), 128.2 (CE5), 128.2 (CG3), 128.0 (CG2), 126.6 (CC3), 126.3 (CA3), 125.5 (CE3), 125.0 (CN4a), 124.1 (CF3), 122.5 (CD5), 121.6 (CB5), 119.5 (CB3), 119.4 (CD3), 117.6 (CA6), 117.3 (CN3+N6), 116.5 (CC6), 109.9 (CC4), 108.7 (CA4), 107.9 (CN8), 107.7 (CN1), 70.6 (CCH2), 70.4 (CCH2), 70.3 (CCH2), 70.0 (CCH2), 68.0 (CCH2), 67.9 (CCH2), 67.7 (CCH2), 67.5 (CCH2). UV-Vis λ/nm (ε/L mol−1 cm−1) (CH2Cl2, 1.00 × 10⁻⁵ mol L−1) 237 (99![[thin space (1/6-em)]](https://www.rsc.org/images/entities/char_2009.gif) 000), 280 (49
000), 280 (49![[thin space (1/6-em)]](https://www.rsc.org/images/entities/char_2009.gif) 000), 312 (35
000), 312 (35![[thin space (1/6-em)]](https://www.rsc.org/images/entities/char_2009.gif) 000), 326 (28
000), 326 (28![[thin space (1/6-em)]](https://www.rsc.org/images/entities/char_2009.gif) 000), 350 sh (16
000), 350 sh (16![[thin space (1/6-em)]](https://www.rsc.org/images/entities/char_2009.gif) 000), 400 sh (7000). ESI-MS m/z 1065.3 [M − PF6]+ (base peak, calc. 1065.3). Found C 55.58, H 4.60, N 4.89; C56H48F6IrN4O6P requires C 55.58, H 4.00, N 4.63%.
000), 400 sh (7000). ESI-MS m/z 1065.3 [M − PF6]+ (base peak, calc. 1065.3). Found C 55.58, H 4.60, N 4.89; C56H48F6IrN4O6P requires C 55.58, H 4.00, N 4.63%.
[Ir(1)(4)][PF6]
The method was as for [Ir(1)(2)][PF6] starting with [Ir(1)(MeOH)2][PF6] (100 mg, 0.096 mmol), 4 (40.8 mg, 0.097 mmol) and NH4PF6 (156 mg, 0.960 mmol) in MeOH (20 mL). Column chromatography used silica eluting with CH2Cl2 changing to CH2Cl2![[thin space (1/6-em)]](https://www.rsc.org/images/entities/char_2009.gif) :
:![[thin space (1/6-em)]](https://www.rsc.org/images/entities/char_2009.gif) MeOH 100
MeOH 100![[thin space (1/6-em)]](https://www.rsc.org/images/entities/char_2009.gif) :
:![[thin space (1/6-em)]](https://www.rsc.org/images/entities/char_2009.gif) 0.5 and finally CH2Cl2
0.5 and finally CH2Cl2![[thin space (1/6-em)]](https://www.rsc.org/images/entities/char_2009.gif) :
:![[thin space (1/6-em)]](https://www.rsc.org/images/entities/char_2009.gif) MeOH 100
MeOH 100![[thin space (1/6-em)]](https://www.rsc.org/images/entities/char_2009.gif) :
:![[thin space (1/6-em)]](https://www.rsc.org/images/entities/char_2009.gif) 1. [Ir(1)(2)][PF6] was isolated as an orange solid (101 mg, 0.072 mmol, 75.0%). 1H NMR (500 MHz, CD2Cl2) δ/ppm 8.15–8.07 (overlapping m, 4H, HB6+E3), 7.69 (ddd, J = 8.4, 7.5, 1.5 Hz, 2H, HB4), 7.66 (d, J = 8.6 Hz, 2H, HN4), 7.32 (d, J = 8.1 Hz, 2H, HB3), 7.25 (d, J = 2.0 Hz, 2H, HE5), 7.00 (ddd, J = 7.3, 5.9, 1.3 Hz, 2H, HB5), 6.98–6.91 (overlapping m, 6H, HG4+N1+N3), 6.77–6.69 (overlapping m, 6H, HA3+G3), 6.58 (br, 4H, HG2), 6.00 (dd, J = 8.6, 2.5 Hz, 2H, HA4), 4.65 (d, J = 2.5 Hz, 2H, HA6), 4.08–3.96 (m, 4H, Ha), 3.80–3.74 (m, 2H, Hb/b′), 3.74–3.69 (m, 2H, Hd/d′), 3.69–3.63 (m, 2H, Hb/b′), 3.59–3.53 (m, 2H, Hd/d′), 3.53–3.45 (m, 4H, Hc), 1.40 (s, 18H, HtBu). 13C NMR (126 MHz, CD2Cl2) δ/ppm 168.1 (CB2), 165.3 (CE6), 164.7 (CE4), 160.0 (CE2), 159.2 (CA5), 157.9 (CN2), 150.2 (CB6), 149.5 (CA1), 138.5 (CG1), 138.2 (CB4), 136.4 (CN8a), 135.4 (CA2), 129.3 (CN4), 128.8 (CG4), 128.0 (CG2), 127.8 (CG3), 126.8 (CE5), 126.0 (CA3), 124.9 (CN4a), 121.6 (CE3), 121.0 (CB5), 118.8 (CB3), 117.3 (CN3), 116.2 (CA6), 109.2 (CA4), 107.8 (CN1), 70.6 (Cb), 69.8 (Cc), 67.9 (Ca), 67.3 (Cd), 36.0 (Cquat-tBu-E), 30.5 (CtBu-E). UV-Vis λ/nm (ε/L mol−1 cm−1) (CH2Cl2, 1.00 × 10⁻⁵ mol L−1) 236 (110
1. [Ir(1)(2)][PF6] was isolated as an orange solid (101 mg, 0.072 mmol, 75.0%). 1H NMR (500 MHz, CD2Cl2) δ/ppm 8.15–8.07 (overlapping m, 4H, HB6+E3), 7.69 (ddd, J = 8.4, 7.5, 1.5 Hz, 2H, HB4), 7.66 (d, J = 8.6 Hz, 2H, HN4), 7.32 (d, J = 8.1 Hz, 2H, HB3), 7.25 (d, J = 2.0 Hz, 2H, HE5), 7.00 (ddd, J = 7.3, 5.9, 1.3 Hz, 2H, HB5), 6.98–6.91 (overlapping m, 6H, HG4+N1+N3), 6.77–6.69 (overlapping m, 6H, HA3+G3), 6.58 (br, 4H, HG2), 6.00 (dd, J = 8.6, 2.5 Hz, 2H, HA4), 4.65 (d, J = 2.5 Hz, 2H, HA6), 4.08–3.96 (m, 4H, Ha), 3.80–3.74 (m, 2H, Hb/b′), 3.74–3.69 (m, 2H, Hd/d′), 3.69–3.63 (m, 2H, Hb/b′), 3.59–3.53 (m, 2H, Hd/d′), 3.53–3.45 (m, 4H, Hc), 1.40 (s, 18H, HtBu). 13C NMR (126 MHz, CD2Cl2) δ/ppm 168.1 (CB2), 165.3 (CE6), 164.7 (CE4), 160.0 (CE2), 159.2 (CA5), 157.9 (CN2), 150.2 (CB6), 149.5 (CA1), 138.5 (CG1), 138.2 (CB4), 136.4 (CN8a), 135.4 (CA2), 129.3 (CN4), 128.8 (CG4), 128.0 (CG2), 127.8 (CG3), 126.8 (CE5), 126.0 (CA3), 124.9 (CN4a), 121.6 (CE3), 121.0 (CB5), 118.8 (CB3), 117.3 (CN3), 116.2 (CA6), 109.2 (CA4), 107.8 (CN1), 70.6 (Cb), 69.8 (Cc), 67.9 (Ca), 67.3 (Cd), 36.0 (Cquat-tBu-E), 30.5 (CtBu-E). UV-Vis λ/nm (ε/L mol−1 cm−1) (CH2Cl2, 1.00 × 10⁻⁵ mol L−1) 236 (110![[thin space (1/6-em)]](https://www.rsc.org/images/entities/char_2009.gif) 000), 280 (45
000), 280 (45![[thin space (1/6-em)]](https://www.rsc.org/images/entities/char_2009.gif) 000), 311 (38
000), 311 (38![[thin space (1/6-em)]](https://www.rsc.org/images/entities/char_2009.gif) 000), 325 (35
000), 325 (35![[thin space (1/6-em)]](https://www.rsc.org/images/entities/char_2009.gif) 000), 350 sh (17
000), 350 sh (17![[thin space (1/6-em)]](https://www.rsc.org/images/entities/char_2009.gif) 000), 395 sh (9000). ESI-MS m/z 1254.0 [M − PF6]+ (base peak, calc. 1253.5). Found C 60.49, H 5.37, N 4.16; C70H68F6IrN4O6P requires C 60.12, H 4.90, N 4.01%.
000), 395 sh (9000). ESI-MS m/z 1254.0 [M − PF6]+ (base peak, calc. 1253.5). Found C 60.49, H 5.37, N 4.16; C70H68F6IrN4O6P requires C 60.12, H 4.90, N 4.01%.
[Ir(1)(5)][PF6]
The method was as for [Ir(1)(2)][PF6] starting with [Ir(1)(MeOH)2][PF6] (59 mg, 0.057 mmol), 3 (19.7 mg, 0.057 mmol) and NH4PF6 (92.3 mg, 0.566 mmol) in MeOH (10 mL). Column chromatography was on silica eluting with CH2Cl2 changing to CH2Cl2![[thin space (1/6-em)]](https://www.rsc.org/images/entities/char_2009.gif) :
:![[thin space (1/6-em)]](https://www.rsc.org/images/entities/char_2009.gif) MeOH 100
MeOH 100![[thin space (1/6-em)]](https://www.rsc.org/images/entities/char_2009.gif) :
:![[thin space (1/6-em)]](https://www.rsc.org/images/entities/char_2009.gif) 0.25 then 100
0.25 then 100![[thin space (1/6-em)]](https://www.rsc.org/images/entities/char_2009.gif) :
:![[thin space (1/6-em)]](https://www.rsc.org/images/entities/char_2009.gif) 1). [Ir(1)(5)][PF6] was isolated as an orange solid (33.0 mg, 0.025 mmol, 44.1%). 1H NMR (500 MHz, CD2Cl2) δ/ppm 8.30 (d, J = 1.9 Hz, 1H, HF3), 8.28 (d, J = 1.6 Hz, 1H, HE3), 7.79 (d, J = 5.9 Hz, 1H, H6), 7.75 (ddd, J = 8.4, 7.3, 1.3 Hz, 1H, HB4), 7.71–7.65 (overlapping m, 2H, HN4+N5), 7.64 (ddd, J = 8.6, 7.5, 1.3 Hz, 1H, HD4), 7.54 (d, J = 8.1 Hz, 1H, HB3), 7.47 (d, J = 5.3 Hz, 1H, HB6), 7.45 (d, J = 5.6 Hz, 1H, HD6), 7.41 (d, J = 1.9 Hz, 1H, HF5), 7.39 (d, J = 8.2 Hz, 1H, HD3), 7.36 (dd, J = 5.9, 1.8 Hz, 1H, HE5), 7.09 (d, J = 8.6 Hz, 1H, HC3), 7.01–6.88 (overlapping m, 8H, HN3+N6+G4+A3+D5+N1+N8+B5), 6.76 (broadened t, J ∼ 7.3 Hz, 2H, HG3), 6.58 (br, 2H, HG2), 6.41 (dd, J = 8.6, 2.5 Hz, 1H, HC4), 6.12 (dd, J = 8.6, 2.5 Hz, 1H, HA4), 5.38 (d, J = 2.5 Hz, 1H, HC6), 4.89 (d, J = 2.5 Hz, 1H, HA6), 4.09–3.94 (overlapping m, 5H, Ha+a′+e+e′+h/h′), 3.88–3.77 (overlapping m, 4H, Hh/h′+d/d′+b/b′+f/f′), 3.74–3.59 (overlapping m, 7H, Hd/d′+b/b′+f/f′+c+c′+g+g′), 1.46 (s, 9H, HtBu-ring F), 1.42 (s, 9H, HtBu-ring E). 13C NMR (126 MHz, CD2Cl2) δ/ppm 1v69.0 (CB2), 167.5 (CD2), 166.0 (CF6), 164.7 (CF4), 164.3 (CE4), 160.6 (CC5), 159.8 (CA5), 157.9 (CN7), 157.9 (CN2), 157.3 (CF2), 157.2 (CE2), 154.2 (CA1), 150.5 (CE6), 149.5 (CC1), 149.3 (CD6), 148.8 (CB6), 138.7 (CG1), 138.3 (CD4), 138.3 (CB4), 136.5 (CN8a), 136.5 (CA2), 136.4 (CC2), 129.3 (CN4/N5), 129.3 (CN4/N5), 129.3 (CG4), 128.1 (CG2), 128.1 (CG3), 127.6 (CF5), 126.6 (CC3), 126.3 (CA3), 125.7 (CE5), 125.0 (CN4a), 122.3 (CD5), 121.8 (CE3), 121.4 (CB5), 120.7 (CF3), 119.4 (CB3), 119.4 (CD3), 117.5 (CA6), 117.3 (CN3+N6), 116.5 (CC6), 109.8 (CC4), 108.6 (CA4), 107.9 (CN8), 107.7 (CN1), 70.6 (CCH2), 70.4 (CCH2), 70.3 (CCH2), 70.0 (CCH2), 67.9 (CCH2), 67.9 (CCH2), 67.7 (CCH2), 67.5 (CCH2), 36.1 (Cquat-tBu-ring E), 36.1 (Cquat-tBu-ring F), 30.6 (CtBu-ring F), 30.6 (CtBu-ring E). UV-Vis λ/nm (ε/L mol−1 cm−1) (CH2Cl2, 1.00 × 10⁻⁵ mol L−1) 236 (107
1). [Ir(1)(5)][PF6] was isolated as an orange solid (33.0 mg, 0.025 mmol, 44.1%). 1H NMR (500 MHz, CD2Cl2) δ/ppm 8.30 (d, J = 1.9 Hz, 1H, HF3), 8.28 (d, J = 1.6 Hz, 1H, HE3), 7.79 (d, J = 5.9 Hz, 1H, H6), 7.75 (ddd, J = 8.4, 7.3, 1.3 Hz, 1H, HB4), 7.71–7.65 (overlapping m, 2H, HN4+N5), 7.64 (ddd, J = 8.6, 7.5, 1.3 Hz, 1H, HD4), 7.54 (d, J = 8.1 Hz, 1H, HB3), 7.47 (d, J = 5.3 Hz, 1H, HB6), 7.45 (d, J = 5.6 Hz, 1H, HD6), 7.41 (d, J = 1.9 Hz, 1H, HF5), 7.39 (d, J = 8.2 Hz, 1H, HD3), 7.36 (dd, J = 5.9, 1.8 Hz, 1H, HE5), 7.09 (d, J = 8.6 Hz, 1H, HC3), 7.01–6.88 (overlapping m, 8H, HN3+N6+G4+A3+D5+N1+N8+B5), 6.76 (broadened t, J ∼ 7.3 Hz, 2H, HG3), 6.58 (br, 2H, HG2), 6.41 (dd, J = 8.6, 2.5 Hz, 1H, HC4), 6.12 (dd, J = 8.6, 2.5 Hz, 1H, HA4), 5.38 (d, J = 2.5 Hz, 1H, HC6), 4.89 (d, J = 2.5 Hz, 1H, HA6), 4.09–3.94 (overlapping m, 5H, Ha+a′+e+e′+h/h′), 3.88–3.77 (overlapping m, 4H, Hh/h′+d/d′+b/b′+f/f′), 3.74–3.59 (overlapping m, 7H, Hd/d′+b/b′+f/f′+c+c′+g+g′), 1.46 (s, 9H, HtBu-ring F), 1.42 (s, 9H, HtBu-ring E). 13C NMR (126 MHz, CD2Cl2) δ/ppm 1v69.0 (CB2), 167.5 (CD2), 166.0 (CF6), 164.7 (CF4), 164.3 (CE4), 160.6 (CC5), 159.8 (CA5), 157.9 (CN7), 157.9 (CN2), 157.3 (CF2), 157.2 (CE2), 154.2 (CA1), 150.5 (CE6), 149.5 (CC1), 149.3 (CD6), 148.8 (CB6), 138.7 (CG1), 138.3 (CD4), 138.3 (CB4), 136.5 (CN8a), 136.5 (CA2), 136.4 (CC2), 129.3 (CN4/N5), 129.3 (CN4/N5), 129.3 (CG4), 128.1 (CG2), 128.1 (CG3), 127.6 (CF5), 126.6 (CC3), 126.3 (CA3), 125.7 (CE5), 125.0 (CN4a), 122.3 (CD5), 121.8 (CE3), 121.4 (CB5), 120.7 (CF3), 119.4 (CB3), 119.4 (CD3), 117.5 (CA6), 117.3 (CN3+N6), 116.5 (CC6), 109.8 (CC4), 108.6 (CA4), 107.9 (CN8), 107.7 (CN1), 70.6 (CCH2), 70.4 (CCH2), 70.3 (CCH2), 70.0 (CCH2), 67.9 (CCH2), 67.9 (CCH2), 67.7 (CCH2), 67.5 (CCH2), 36.1 (Cquat-tBu-ring E), 36.1 (Cquat-tBu-ring F), 30.6 (CtBu-ring F), 30.6 (CtBu-ring E). UV-Vis λ/nm (ε/L mol−1 cm−1) (CH2Cl2, 1.00 × 10⁻⁵ mol L−1) 236 (107![[thin space (1/6-em)]](https://www.rsc.org/images/entities/char_2009.gif) 000), 280 (52
000), 280 (52![[thin space (1/6-em)]](https://www.rsc.org/images/entities/char_2009.gif) 000), 311 (37
000), 311 (37![[thin space (1/6-em)]](https://www.rsc.org/images/entities/char_2009.gif) 000), 326 (28
000), 326 (28![[thin space (1/6-em)]](https://www.rsc.org/images/entities/char_2009.gif) 000), 350 sh (16
000), 350 sh (16![[thin space (1/6-em)]](https://www.rsc.org/images/entities/char_2009.gif) 000), 400 sh (7000). ESI-MS m/z 1177.4 [M − PF6]+ (base peak, calc. 1177.5). Found C 58.52, H 5.25, N 4.58; C64H64F6IrN4O6P requires C 58.13, H 4.88, N 4.24%.
000), 400 sh (7000). ESI-MS m/z 1177.4 [M − PF6]+ (base peak, calc. 1177.5). Found C 58.52, H 5.25, N 4.58; C64H64F6IrN4O6P requires C 58.13, H 4.88, N 4.24%.
Computational details
Dispersion-corrected density functional calculations (DFT-D) were carried out with the D.01 revision of the Gaussian 09 program package.24 The Becke's three-parameter B3LYP exchange–correlation functional25,26 was used, together with the 6-31G** basis set for C, H, N and O,27 and the “double-ζ” quality LANL2DZ basis set for the Ir atom.28 Relativistic effects were accounted for by means of an effective core potential (ECP), which was used to replace the inner core electrons of Ir. Intramolecular non-covalent interactions are expected to play a relevant role in the studied systems. Consequently, to get a better description of their molecular geometry, the Grimmés D3 dispersion term with Becke-Johnson damping was added to the B3LYP functional (B3LYP-D3).29,30 The geometries of both the singlet ground electronic state (S0) and the lowest-energy triplet state (T1) were fully optimized. No symmetry restrictions were imposed. The geometry of T1 was calculated at the spin-unrestricted UB3LYP-D3 level using a spin multiplicity of three. All the calculations were performed in the presence of the solvent (CH2Cl2). Solvent effects were considered within the self-consistent reaction field (SCRF) theory using the polarized continuum model (PCM) approach.31–33 Time-dependent DFT (TD-DFT)34–36 calculations of the lowest-lying 30 singlet excited states and the lowest-lying 10 triplets of all the complexes were performed in the presence of the solvent at the minimum-energy geometry optimized for the ground state. The geometry of the first naphthyl-centred triplet excited state of each system was first optimized at TD-DFT level, and then reoptimized at the UB3LYP-D3 level to compare with the results obtained for T1 from DFT calculations.Device preparation
LECs were prepared on top of a patterned indium tin oxide (ITO, 15 Ω per square) coated glass substrate (http://www.naranjosubstrates.com) previously cleaned as follows: (a) sonication with soap, (b) deionized water, (c) isopropanol and (d) UV-O3 lamp for 20 min. The thickness of the films was determined with an Ambios XP-1 profilometer. Prior to the deposition of the emitting layer, 80 nm of poly(3,4-ethylenedioxythiophene):poly(styrenesulfonate) (PEDOT:PSS) (CLEVIOS™ P VP AI 4083, aqueous dispersion, 1.3–1.7% solid content, Heraeus) was coated in order to increase the reproducibility of the cells. The emitting layer (100 nm) was prepared by spin-coating of a MeCN solution consisting of the iTMC with the addition of the ionic liquid (IL) 1-butyl-3-methylimidazolium hexafluorophosphate [Bmim][PF6] (>98.5%, Sigma-Aldrich) in a 4![[thin space (1/6-em)]](https://www.rsc.org/images/entities/char_2009.gif) :
:![[thin space (1/6-em)]](https://www.rsc.org/images/entities/char_2009.gif) 1 molar ratio (iTMC
1 molar ratio (iTMC![[thin space (1/6-em)]](https://www.rsc.org/images/entities/char_2009.gif) :
:![[thin space (1/6-em)]](https://www.rsc.org/images/entities/char_2009.gif) IL). The devices were then transferred to an inert atmosphere glovebox (<0.1 ppm O2 and H2O, MBraun), where a layer (70 nm) of aluminium (the top electrode) was thermally evaporated onto the devices using an Edwards Auto500 evaporator integrated in the inert atmosphere glovebox. The area of the device was 6.5 mm2. The devices were not encapsulated and were characterized inside the glovebox at room temperature.
IL). The devices were then transferred to an inert atmosphere glovebox (<0.1 ppm O2 and H2O, MBraun), where a layer (70 nm) of aluminium (the top electrode) was thermally evaporated onto the devices using an Edwards Auto500 evaporator integrated in the inert atmosphere glovebox. The area of the device was 6.5 mm2. The devices were not encapsulated and were characterized inside the glovebox at room temperature.
Device characterization
The device lifetime was measured by applying a pulsed current and monitoring the voltage and the luminance versus time by a True Colour Sensor MAZeT (MTCSiCT Sensor) with a Botest OLT OLED Lifetime-Test System. The average current density is determined by multiplying the peak current density by the time-on time and dividing by the total cycle time. The average luminance is directly obtained by taking the average of the obtained photodiode results and correlating it to the value of a luminance meter. The current efficiency is obtained by dividing the average luminance by the average current density. The electroluminescent (EL) spectra were measured using an Avantes AvaSpec-2048 Fiber Optic Spectrometer during device lifetime measurement.Results and discussion
Synthesis and characterization of ligand H21 and solvento precursor [Ir(1)(MeOH)2][PF6]
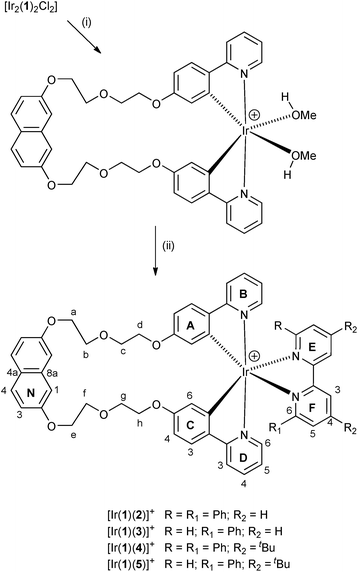
Scheme 1 summarises the synthetic route to the bis(cyclometallating) ligand H21. The precursor 2,7-bis[2-(2-hydroxyethoxy)ethoxy]naphthalene was prepared following published procedures.20,37 The choice of 2-(4-fluorophenyl)pyridine as substrate and the reaction conditions for nucleophilic substitution with 2,7-bis[2-(2-hydroxyethoxy)ethoxy]naphthalene were chosen based on those described by Clavier et al. for the formation of 8-(tert-butylthio)-2-methylquinoline.38 Compound H21 was isolated in 74.6% yield. The base peak in the electrospray mass spectrum (m/z 643.6) arose from the [M + H]+ ion, and elemental analysis was in accord with the expected composition. The 1H and 13C NMR spectra were assigned by 2D methods (COSY, NOESY, HMQC and HMBC) and the spectra were consistent with the symmetrical structure shown in Scheme 1 for H21.The conventional methodology39 for preparing complexes of the type [Ir(C^N)2(N^N)][PF6] is treatment of a [Ir(C^N)2(μ-Cl)2] dimer with two equivalents of an N^N ligand followed by anion exchange. However, the unfavourable effect that residual chloride ion has on the performance of LEC devices40 has led us to develop an alternative strategy in which the chlorido dimer is converted to an intermediate solvento complex41 by treatment of the dimer with AgPF6 in methanol (Scheme 2).42 The dimer [Ir2(1)2(μ-Cl)2] was prepared from H21 and IrCl3·xH2O under dilute conditions to ensure that the two C^N coordination sites of H21 underwent cyclometallation at the same iridium(III) centre. The dimer was then treated with AgPF6 in MeOH to give the solvento complex [Ir(1)(MeOH)2][PF6] which was used for the final reaction step without further purification. Both [Ir2(1)2(μ-Cl)2] and [Ir(1)(MeOH)2][PF6] were characterized by ESI MS and NMR spectroscopy. The base peak envelope in the mass spectrum of each complex corresponded to the [Ir(1)]+ cation. Evidence for the coordinated MeOH in [Ir(1)(MeOH)2][PF6] came from δ(1H) and δ(13C) NMR signals at 3.34 and 49.9 ppm, respectively. These values compare with δ(1H) = 3.35 ppm and δ(13C) = 49.9 ppm in [Ir(Phppy)2(MeOH)2][PF6] and [Ir(Ph2ppy)2(MeOH)2][PF6] (HPhppy = 2-(3-phenyl)phenylpyridine and HPh2ppy = 2-(3,5-diphenyl)phenylpyridine).42 Going from H21 to the coordinated ligand in [Ir2(1)2(μ-Cl)2] and [Ir(1)(MeOH)2][PF6] results in a loss in rotational freedom within the polyethyleneoxy-chain, with the consequence that each pair of CH2 protons appears as a diastereotopic pair (see Experimental section and discussion of the [Ir(1)(N^N)]+ complexes).
Synthesis and characterization of [Ir(1)(N^N)][PF6] complexes
The complexes [Ir(1)(N^N)][PF6] with N^N = 2, 3, 4 or 5 were prepared by reaction of [Ir(1)(MeOH)2][PF6] with the N^N ligand in MeOH at reflux in the presence of NH4PF6 (Scheme 2). After work up, [Ir(1)(2)][PF6], [Ir(1)(3)][PF6], [Ir(1)(4)][PF6] and [Ir(1)(5)][PF6] were isolated in 44.1–75.0% yields. The base peak in the electrospray mass spectrum of each compound corresponded to [M − PF6]+ and the isotope pattern of the peak envelope was as predicted. The 1H and 13C NMR spectra of the complexes were assigned by using COSY, NOESY, HMQC and HMBC experiments. The cations [Ir(1)(2)]+ and [Ir(1)(4)]+ are C2 symmetric and Fig. 2 shows the solution 1H NMR spectrum of [Ir(1)(2)][PF6]. The change in the appearance of the alkyl signals on going from H21 (Fig. 1) to [Ir(1)(2)][PF6] (Fig. 2) is consistent with each CH2 group in the coordinated ligand exhibiting a diastereotopic pair of protons. The 1H NMR spectrum of [Ir(1)(4)][PF6] is similar to that of [Ir(1)(2)][PF6], but with the absence of the signal for HE4 and the addition of a singlet at δ 1.40 ppm arising from the tBu substituent in ligand 4. The low frequency shift of the signal for HA6 (δ = 4.62 ppm in [Ir(1)(2)][PF6] and δ = 4.65 ppm in [Ir(1)(4)][PF6]) is due to a combination of HA6 being sandwiched in a V-shaped cavity between a phenyl and pyridine ring (as observed in related [Ir(C^N)2(N^N)]+ complexes23,43) and from its proximity to one or more oxygen atoms of the polyethyleneoxy-chain. Unfortunately, no X-ray quality single crystals of any of the four complexes could be grown. In Fig. 2, the broadened signal at δ 6.55 ppm for protons HG2 (the ortho-protons on the 6- and 6′-phenyl substituents of ligand 2) is consistent with hindered rotation of the phenyl rings as observed in other [Ir(C^N)2(N^N)]+ complexes with 6-phenyl-2,2′-bipyridine or 6,6′-diphenyl-2,2′-bipyridine N^N ligands.44,45 A similarly broadened resonance for HG2 appears at δ 6.58 ppm in the 1H NMR spectrum of [Ir(1)(4)][PF6].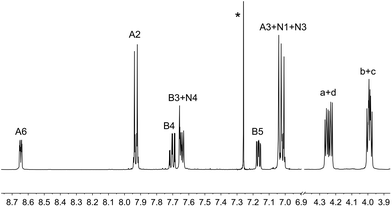 | ||
| Fig. 1 500 MHz 1H NMR spectrum of a CDCl3 solution of H21; scale in δ/ppm. * = residual CHCl3. See Scheme 1 for ring labels. | ||
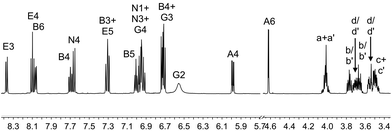 | ||
| Fig. 2 The aromatic and alkyl regions of the 500 MHz 1H NMR spectrum of [Ir(1)(2)][PF6] in CD2Cl2; scale δ/ppm. See Scheme 2 for atom labels. | ||
On going from [Ir(1)(2)]+ and [Ir(1)(4)]+ to [Ir(1)(3)]+ and [Ir(1)(5)]+, the complex is desymmetrized. This is apparent from the 1H NMR spectrum for [Ir(1)(3)][PF6] (Fig. 3) compared to that of [Ir(1)(2)][PF6] (Fig. 2). Signals for both HG2 (δ = 6.57 ppm) and HG3 (δ = 6.76 ppm) are broadened in the 1H NMR spectrum of [Ir(1)(3)][PF6] (Fig. 3), and similarly broadened signals are observed for HG2 (δ = 6.58 ppm) and HG3 (δ = 6.76 ppm) in [Ir(1)(5)][PF6]. As in [Ir(1)(2)][PF6] and [Ir(1)(4)][PF6], this indicates hindered rotation of the 6-phenyl substituent.
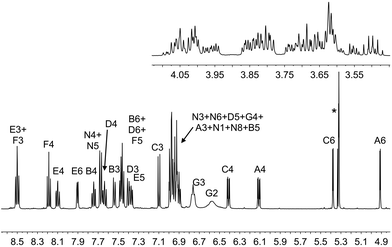 | ||
| Fig. 3 The aromatic and alkyl regions of the 500 MHz 1H NMR spectrum of [Ir(1)(3)][PF6] in CD2Cl2; scale δ/ppm. See Scheme 2 for atom labels. * = overlapping signals for residual CDHCl2 and CH2Cl2. | ||
Electrochemistry
The electrochemical behaviour of the [Ir(1)(N^N)][PF6] complexes was investigated using cyclic voltammetry and data are shown in Table 1. A representative cyclic voltammogram (CV) is depicted in Fig. 4. Each complex exhibits an irreversible oxidation and a quasi-reversible reduction process, which are compared to the reference compound [Ir(ppy)2(4)][PF6] (Hppy = 2-phenylpyridine). The value of Eox1/2 is only marginally affected by the introduction of electron-releasing phenyl and/or tert-butyl groups on the ancillary ligands (e.g. from +0.80 to +0.76 V on going from [Ir(1)(3)][PF6] to [Ir(1)(4)][PF6]) leading to a slightly destabilized HOMO. These findings are consistent with the oxidation process being centred on the iridium and C^N ligand, as discussed previously.42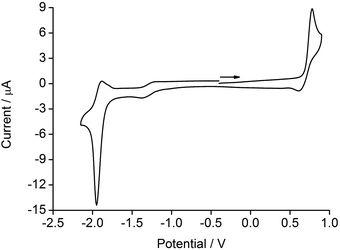 | ||
| Fig. 4 Cyclic voltammogram for [Ir(1)(5)][PF6] in CH2Cl2 (see Table 1 for conditions) referenced to Fc/Fc+; → = direction of scan. | ||
| Compound | E ox1/2/V | E red1/2/V | ΔE1/2/V |
|---|---|---|---|
| [Ir(1)(2)][PF6] | +0.82irr | −1.81qr | 2.63 |
| [Ir(1)(3)][PF6] | +0.80irr | −1.84qr | 2.64 |
| [Ir(1)(4)][PF6] | +0.76irr | −1.96qr | 2.72 |
| [Ir(1)(5)][PF6] | +0.77irr | −1.92qr | 2.69 |
| [Ir(ppy)2(4)][PF6] | +0.87irr | −1.94irr | 2.81 |
The reduction processes centred on the N^N ligand are similar for [Ir(1)(4)][PF6] and [Ir(1)(5)][PF6] (−1.96 V and −1.92 V, respectively) compared to −1.94 V for [Ir(ppy)2(4)][PF6]. On going from [Ir(1)(2)][PF6] to [Ir(1)(4)][PF6] and from [Ir(1)(3)][PF6] to [Ir(1)(5)][PF6], electron-releasing tert-butyl groups are introduced into the N^N domain and there is a significant shift of Ered1/2 to more negative potentials. This is consistent with the LUMO of the complex being localized on the N^N ligand as discussed below and in agreement with, for example, [Ir(ppy)2(2)][PF6].43
Photophysical properties
The solution absorption spectra of [Ir(1)(N^N)][PF6] with N^N = 2–5 are compared in Fig. 5; the complex [Ir(ppy)2(4)][PF6] (which has previously been reported)23 is used as a reference compound, differing from [Ir(1)(4)][PF6] only by the introduction of the naphthyl-containing linker between the cyclometalling C^N ligands. The highest-energy absorption band (236 or 237 nm) in each of the spectra of the [Ir(1)(N^N)][PF6] complexes is assigned to naphthyl-centred π → π* transitions; this band is absent in the spectrum of [Ir(ppy)2(4)][PF6].23 The profile of the absorption bands above ∼270 nm is similar for the five complexes, consistent with the absorptions between 270 and 375 nm arising from π → π* transitions centred on the ppy, 6-Phbpy or 6,6′-Ph2bpy units. The weakest absorptions at ∼400–425 nm are assigned to metal-to-ligand charge transfer (MLCT) transitions.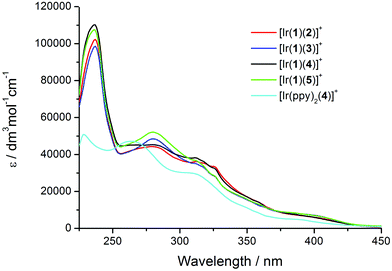 | ||
| Fig. 5 Solution absorption spectra of [Ir(1)(N^N)][PF6] complexes and reference compound [Ir(ppy)2(4)][PF6] in CH2Cl2 (1.00 × 10⁻⁵ mol L−1). | ||
Upon excitation at 280 nm, the complexes all exhibit orange emission. The solution emission spectra are shown in Fig. 6 and emission maxima, quantum yields and lifetimes are given in Tables 2 and 3. Introducing the electron-releasing tert-butyl substituents results in the expected blue-shift in λmaxem (23 nm on going from [Ir(1)(3)][PF6] to [Ir(1)(5)][PF6], and 26 nm from [Ir(1)(2)][PF6] to [Ir(1)(4)][PF6]). Introducing the naphthyl-containing linker between the two ppy moieties has little effect on λmaxem (558 nm in model compound [Ir(ppy)2(4)][PF6] and 564 nm in [Ir(1)(4)][PF6]) consistent with the emission originating from a mixture of MLCT and LLCT transitions6 involving the Ir(III) metal centre and the ppy units of the C^N ligands in the HOMO and the N^N ligand in the LUMO as discussed below. This is consistent with the electrochemical data (Table 1). In degassed solutions, the [Ir(1)(N^N)][PF6] orange emissions exhibit photoluminescence quantum yields (PLQYs) in the range 6–18% (Table 2) with lifetimes of between 135 and 370 ns (Table 3). Fig. 7 depicts the emission spectra of solid-state samples of the complexes. For [Ir(1)(2)][PF6] and [Ir(1)(3)][PF6], going from solution to solid leads to a blue-shift in λmaxem, whereas for the complexes containing the tert-butyl substituents, λmaxem is little affected. Both the PLQY and emission lifetimes are enhanced from solution to solid state (Tables 2 and 3). We note that the solution PLQY recorded for the reference complex [Ir(ppy)2(4)][PF6] of 1% (Table 2) is consistent with the 0.07% previously reported.23
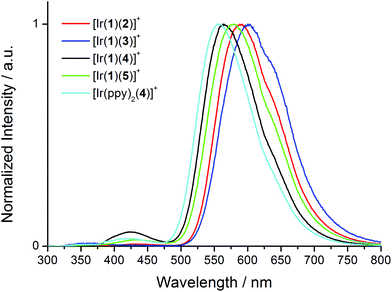 | ||
| Fig. 6 Normalized solution emission spectra of [Ir(1)(N^N)][PF6] complexes and reference compound [Ir(ppy)2(4)][PF6] in CH2Cl2 (1.00 × 10⁻⁵ mol L−1) excited at 280 nm. | ||
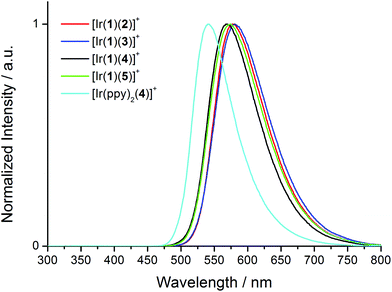 | ||
| Fig. 7 Normalized solid state emission spectra of [Ir(1)(N^N)][PF6] complexes and reference compound [Ir(ppy)2(4)][PF6] excited at 280 nm. | ||
| Complex cation | CH2Cl2 solution | Powder | ||
|---|---|---|---|---|
| λ maxem [nm] | PLQYb [%] | λ maxem [nm] | PLQY [%] | |
| a λ exc = 280 nm. b Argon degassed. c A value of 555 nm has been reported for a CH2Cl2 solution of [Ir(ppy)2(4)][PF6].23 | ||||
| [Ir(1)(2)]+ | 434, 590 | 16 | 578 | 35 |
| [Ir(1)(3)]+ | 361, 601 | 6 | 581 | 19 |
| [Ir(1)(4)]+ | 425, 564 | 9 | 567 | 20 |
| [Ir(1)(5)]+ | 435, 578 | 18 | 575 | 21 |
| [Ir(ppy)2(4)]+ | 420, 558c | 1 | 540 | 12 |
| CH2Cl2 solution | Powder | ||||||
|---|---|---|---|---|---|---|---|
| Complex cation | λ maxem [nm] |
τ
av![[thin space (1/6-em)]](https://www.rsc.org/images/entities/char_2009.gif) b [ns] b [ns] |
τ 1 [ns] (A1) | τ 2 [ns] (A2) |
τ
av![[thin space (1/6-em)]](https://www.rsc.org/images/entities/char_2009.gif) b [ns] b [ns] |
τ 1 [ns] (A1) | τ 2 [ns] (A2) |
| a λ exc = 280 nm; lifetimes were measured using a Hamamatsu Quantaurus-Tau (see Experimental section) and some values of λmaxem differ slightly from those in Table 2 where spectra were recorded on a Shimadzu RF-5301PC spectrofluorometer. b Biexponential fit using the equation τav = ∑Aiτi/∑Ai where Ai is the pre-exponential factor of the lifetime. | |||||||
| [Ir(1)(2)]+ | 587 | 381 | 370 (17![[thin space (1/6-em)]](https://www.rsc.org/images/entities/char_2009.gif) 296) 296) |
576 (624) | 545 | 436 (9095) | 703 (3884) |
| [Ir(1)(3)]+ | 601 | 159 | 145 (7394) | 649 (49) | 407 | 374 (11![[thin space (1/6-em)]](https://www.rsc.org/images/entities/char_2009.gif) 665) 665) |
686 (740) |
| [Ir(1)(4)]+ | 564 | 144 | 135 (72![[thin space (1/6-em)]](https://www.rsc.org/images/entities/char_2009.gif) 891) 891) |
245 (3871) | 678 | 569 (28![[thin space (1/6-em)]](https://www.rsc.org/images/entities/char_2009.gif) 144) 144) |
949 (6768) |
| [Ir(1)(4)]+ | 420 | 4 | 3 (44![[thin space (1/6-em)]](https://www.rsc.org/images/entities/char_2009.gif) 137) 137) |
56 (27) | |||
| [Ir(1)(5)]+ | 579 | 365 | 344 (16![[thin space (1/6-em)]](https://www.rsc.org/images/entities/char_2009.gif) 410) 410) |
543 (1241) | 462 | 337 (8836) | 579 (5543) |
The emission spectra of the [Ir(1)(N^N)][PF6] complexes as amorphous thin films with the composition used in LEC devices were also recorded (Fig. S1†). The spectra are similar and follow the same trends discussed above for the powder spectra with the emission maxima slightly red-shifted ([Ir(1)(2)][PF6]: 583 nm, [Ir(1)(3)][PF6]: 589 nm, [Ir(1)(4)][PF6]: 574 nm, [Ir(1)(5)][PF6]: 579 nm). The PLQY values (see Table 4) obtained in thin film are comparable to those determined in powder (21.9% for [Ir(1)(5)][PF6], 17.5% for [Ir(1)(4)][PF6] and 15.5% for [Ir(1)(3)][PF6]) except for [Ir(1)(2)][PF6] which shows a significantly lower PLQY of 22.6% compared to 35% in the powder (Table 2).
![[thin space (1/6-em)]](https://www.rsc.org/images/entities/char_2009.gif) :
:![[thin space (1/6-em)]](https://www.rsc.org/images/entities/char_2009.gif) [Bmim][PF6] 4
[Bmim][PF6] 4![[thin space (1/6-em)]](https://www.rsc.org/images/entities/char_2009.gif) :
:![[thin space (1/6-em)]](https://www.rsc.org/images/entities/char_2009.gif) 1 molar ratio
1 molar ratio
| LEC | Ir-iTMC |
t
max![[thin space (1/6-em)]](https://www.rsc.org/images/entities/char_2009.gif) a/h a/h |
L max/cd m−2 |
t
1/2![[thin space (1/6-em)]](https://www.rsc.org/images/entities/char_2009.gif) b/h b/h |
Efficacyc/cd A−1 | PCEd/lm W−1 | EQEe/% | PLQYf/% |
|---|---|---|---|---|---|---|---|---|
| a Time to reach the maximum luminance Lmax. b Time to reach one-half of the maximum luminance. c Maximum efficacy. d Maximum power conversion efficiency. e Maximum external quantum efficiency. f Photoluminescence quantum yield in thin film using the same composition than for the device active layer (λexc = 320 nm). | ||||||||
| A | [Ir(1)(2)][PF6] | 48.6 | 91 | 785 | 4.2 | 2.1 | 1.8 | 22.6 |
| B | [Ir(1)(3)][PF6] | 52.1 | 67 | 581 | 3.1 | 1.7 | 1.3 | 17.5 |
| C | [Ir(1)(4)][PF6] | 61.8 | 54 | 626 | 2.5 | 1.3 | 0.8 | 15.5 |
| D | [Ir(1)(5)][PF6] | 0.6 | 133 | 31 | 5.4 | 2.2 | 2.1 | 21.9 |
| E | [Ir(ppy)(4)][PF6] | 3.3 | 146 | 26 | 6.4 | 3.7 | 2.6 | — |
A comparison of Fig. 6 and 7 reveals that each complex in solution, most noticeably [Ir(1)(4)][PF6], exhibits a second emission at higher energies than the dominant band, and that this emission band is absent in the powder samples. Since the aim of introducing the naphthyl domain into the [Ir(C^N)2(N^N)]+ complex was to generate a dual emitter, the appearance of the second band, albeit weak, demanded further investigation. The absence of the band in the solid state samples suggested that the high-energy emission might arise from dissociated ligand. Fig. 8 shows an overlay of the normalized emission spectra of [Ir(1)(4)][PF6], [Ir(ppy)2(4)][PF6], H21 and 4. Both [Ir(1)(4)][PF6] and [Ir(ppy)2(4)][PF6] exhibit a band with λmaxem ∼ 420 nm (Table 2), suggesting that the origin of the emission is not the naphthyl domain. Note that the previously reported emission spectrum of [Ir(ppy)2(4)][PF6] did not extend to below 450 nm.23 Model compounds HOnaphth (HOnaphth = 2,7-bis[2-(2-hydroxyethoxy)ethoxy]naphthalene) and H21 both show a structured emission at 331 and 344 nm typical of naphthalene;46 in addition H21 shows an emission at 410 nm. Unexpectedly, excitation of a CH2Cl2 solution of ligand 4 gives rise to an extremely similar PL spectrum as that of H21 and HOnaphth (Fig. 8). Repeated measurements for 4 and comparisons with the emission spectrum of 5 and with the reported emission spectrum of 4,4′-di-tert-butyl-2,2′-bipyridine (λmaxem = 357 nm)47 validated the result.
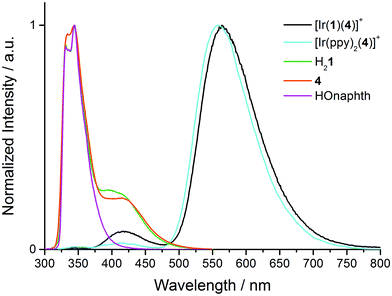 | ||
| Fig. 8 Normalized solution emission spectra of [Ir(1)(4)][PF6], [Ir(ppy)2(4)][PF6], H21, HOnaphth and 4 in CH2Cl2 (∼1.00 × 10⁻⁵ mol L−1). Compounds were excited at 280 nm. | ||
Excitation spectra of [Ir(1)(4)][PF6] and [Ir(ppy)2(4)][PF6] (Fig. S2†) reveal the origins of the 564 and 425 nm emissions in [Ir(1)(4)][PF6], and the 558 and 420 nm bands in [Ir(ppy)2(4)][PF6]. The low-energy MLCT emissions for both complexes arise from absorptions over the whole region from 230 to 500 nm, and the profiles of the excitation spectra are similar to the absorption spectra shown in Fig. 5, but, as expected, lack the naphthyl band at 237 nm. The 425 or 420 nm emission results from two absorption bands at ∼258 and ∼358 nm (Fig. 9, black and cyan spectra). The excitation spectra for [Ir(1)(4)][PF6] and [Ir(ppy)2(4)][PF6] resemble that of 4 (Fig. 9). In contrast, the excitation spectrum of H21 for the emission at 410 nm (Fig. 9, green spectrum) is broader. The similarity between the excitation spectra of [Ir(1)(4)][PF6], [Ir(ppy)2(4)][PF6] and free ligand 4 indicate that the high-energy emission around 420 nm arises from a fluorescent excited state of coordinated ligand 4. Although an extremely low concentration impurity could be responsible for such observations, the method of measuring and the reproducibility of recorded solutions of independently synthesized compounds makes this scenario unlikely.
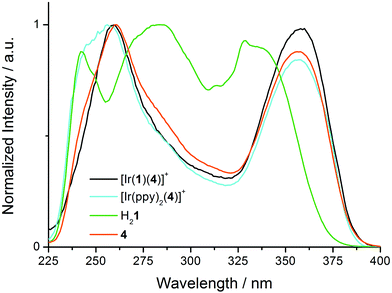 | ||
| Fig. 9 Normalized excitation spectra for CH2Cl2 solutions (1.00 × 10⁻⁵ M) of [Ir(1)(4)][PF6], [Ir(ppy)2(4)][PF6], H21 and 4 each at a fixed emission wavelength of 420 nm. | ||
The PLQY increases from 1% to 9% on going from [Ir(ppy)2(4)][PF6] to [Ir(1)(4)][PF6], but this is not necessarily a consequence of partial energy transfer from the naphthyl unit (PLQY = 15% for H21) to the Ir(III) coordination sphere. Excited-state lifetime measurements of [Ir(1)(4)][PF6] (τav = 144 ns for the 564 nm and τav = 4 ns for the 420 nm emission band, Table 3) corroborate the fact that the higher-energy emission arises from a fluorescent excited state being in the same range as for H21 (τav = 6 ns for the 420 nm emission band).
Theoretical calculations
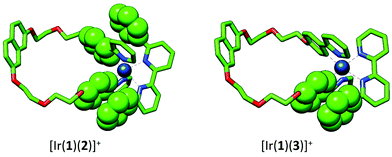
To gain a better understanding of the electrochemical and photophysical properties of complexes [Ir(1)(N^N)]+, (N^N = 2–5), a combined DFT/TD-DFT theoretical investigation was undertaken at the B3LYP-D3/(6-31G** + LANL2DZ) level in the presence of the solvent (CH2Cl2) (see the Experimental section for full computational details). Calculations were also performed for the reference complex [Ir(ppy)2(4)]+ for comparison purposes.The geometry of the complexes in their ground electronic state (S0) was optimized without imposing any symmetry restriction. The calculated geometries reproduce the trends observed typically on this type of complexes, showing a distorted octahedral coordination of the iridium atom.6,48Fig. 10 displays the minimum-energy optimized structures of complexes [Ir(1)(2)]+ and [Ir(1)(3)]+ as representative examples. Table S1† summarizes the values of the geometrical parameters defining the iridium coordination sphere and of selected distances and dihedral angles. For all the complexes, the pendant phenyl rings introduced as R and R1 substituents in the N^N ligand (Scheme 2) present intracation face-to-face π-stacking interactions with the phenyl rings of the closest ppy in the cyclometallating ligand. The calculated centroid–centroid distances between rings A and G in Scheme 2 range from 3.40 to 3.56 Å, in good agreement with the X-ray values reported for complexes [Ir(ppy)2(2)]+ and [Ir(ppy)2(3)]+.48 The steric hindrance produced by the phenyl substituents induces a twisting between the rings of the bpy ligand. The twisting angle is higher for [Ir(1)(2)]+ (32.8°), [Ir(1)(4)]+ (38.3°) and [Ir(ppy)2(4)]+ (37.1°) than for [Ir(1)(3)]+ (21.3°) and [Ir(1)(5)]+ (24.9°) because in the former two pendant phenyl rings are introduced in R and R1 positions. For all the [Ir(1)2(N^N)]+ complexes, the cyclometallating ligand 1 remains in an expanded disposition (Fig. 10), featuring a distance from the centroid of the naphthalene group to the iridium atom of 10.6–10.8 Å.
The geometry of the complexes in their first triplet excited state (T1) was also optimized using the spin-unrestricted UB3LYP-D3/(6-31G**+LANL2DZ) approach. It is worth to note that the face-to-face intracation interactions observed in the ground state are preserved in T1, and that the naphthalene-iridium distance remains almost constant. The most important changes are found for the bpy ligand that becomes more planar in T1 (twisting angles in the 13–18° range, Table S1, ESI†). This points to a higher electron density on the bpy ligand in T1, which would stabilize the planar form as it favors the electronic delocalization.
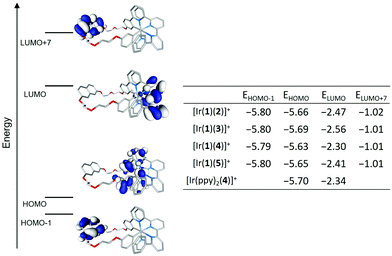
Fig. 11 displays the isovalue contours calculated for the highest-occupied (HOMO) and lowest-unoccupied (LUMO) molecular orbitals of complex [Ir(1)(2)]+ as a representative example. Orbitals HOMO−1 and LUMO+7, which respectively correspond to the highest-occupied and lowest-unoccupied molecular orbitals centred on the naphthalene group of ligand 1, are also displayed. The topology of the corresponding MOs of all the [Ir(1)(N^N)]+ complexes fully reproduces that of the selected example. The table inserted in Fig. 11 summarizes the MO energies calculated for the [Ir(1)(N^N)]+ complexes and compares them with those obtained for the HOMO and LUMO of [Ir(ppy)2(4)]+. As it is usually found for ppy-based cyclometallated Ir-iTMCs,6,44,45 the HOMO results from a mixture of dπ orbitals of Ir(III) and phenyl π orbitals, with some contribution from the pyridine rings, of the cyclometallating ligand, whereas the LUMO is located over the bpy of the ancillary ligand. The similar energy values estimated for the HOMO of [Ir(1)(N^N)]+ are in good agreement with the experimental Eox1/2 values (Table 1), which do not change greatly along the series. The introduction of electron-releasing tert-butyl groups in the N^N ligand slightly destabilizes the HOMO of [Ir(1)(4)]+ and [Ir(1)(5)]+, in good agreement with the slightly lower Eox1/2 recorded for these complexes. The effect of the substituents is higher in the LUMO, centred on the ancillary ligand. It becomes stabilized along the series [Ir(1)(4)]+ (−2.30 eV) > [Ir(ppy)2(4)]+ (−2.34 eV) > [Ir(1)(5)]+ (−2.41 eV) > [Ir(1)(2)]+ (−2.47 eV) > [Ir(1)(3)]+ (−2.56 eV), in quite good correlation with the less negative Ered1/2 values recorded along this series (Table 1).
The HOMO–LUMO gaps calculated for [Ir(1)(2)]+ (3.20 eV) and [Ir(1)(3)]+ (3.13 eV) are lower than those computed for [Ir(1)(4)]+ (3.33 eV) and [Ir(1)(5)]+ (3.24 eV) in good accord with the trends observed for the electrochemical gap ΔE1/2. If light emission in these complexes originates from a state described by the HOMO → LUMO excitation, MO calculations predict that [Ir(1)(4)]+ would emit more in the blue that the rest of the complexes and close to the emission of [Ir(ppy)2(4)]+. This is in fact the trend observed in solution for the λmaxem values (Table 2). The significant energy difference between the LUMO and the LUMO+7 centred on the naphthalene moiety leads us to expect that states associated to this moiety will appear at high energies and will not contribute to the emission.
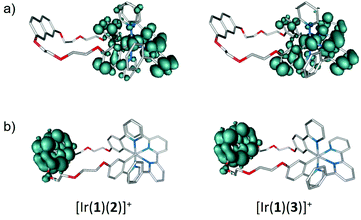
The nature of the low-lying triplet states was first studied by performing TD-DFT calculations at the optimized geometry of the ground state (S0). The vertical excitation energies and electronic descriptions computed for the lowest-lying triplet states of the [Ir(1)(N^N)]+ complexes and those of [Ir(ppy)2(4)]+ are given in Table S2.† All the complexes present a first triplet excited state (T1) mainly defined by the HOMO → LUMO excitation, which implies an electron transfer from the Ir-ppy environment, where the HOMO is localized, to the bpy ligand, where the LUMO resides (see Fig. 11). The T1 state therefore shows a mixed 3MLCT/3LLCT character, and the calculated excitation energies ([Ir(ppy)2(4)]+: 2.56 eV > [Ir(1)(4)]+: 2.55 eV > [Ir(1)(5)]+: 2.53 eV > [Ir(1)(2)]+: 2.48 eV > [Ir(1)(3)]+: 2.43 eV) follow the trend expected on the basis of the HOMO–LUMO gap. The T1 state was further examined by optimizing its structure at the spin-unrestricted UB3LYP-D3 level as described above. The unpaired-electron spin density distribution calculated for this state (Fig. 12a) matches the topology of the HOMO → LUMO excitation and therefore corroborates the electron transfer from the Ir-ppy environment to the N^N ligand, thus confirming the 3MLCT/3LLCT character of T1. The electronic nature predicted for T1 is in good agreement with the broad an unstructured shape of the emission bands observed experimentally (Fig. 6 and 7).
Back to the TD-DFT calculation of triplet states, the first excited state involving the naphthyl group of ligand 1 is found 0.3–0.4 eV above T1 (Table S2†). As was to be expected, it is mainly described by the HOMO−1 → LUMO+7 excitation, and its vertical excitation energy from S0 remains almost constant (2.85–2.86 eV) for all the [Ir(1)(N^N)]+ complexes, as the structural differences between these complexes concern the N^N ligand from which the naphthyl is far apart. The spin-density distribution calculated for this state is shown in Fig. 12b and clearly reflects the localization of the electronic transition on the naphthyl unit. After full-geometry relaxation at the UB3LYP-D3 level, the naphthyl-centred triplet state is calculated 0.38, 0.41, 0.28 and 0.30 eV above the HOMO → LUMO T1 triplet for [Ir(1)(2)]+, [Ir(1)(3)]+, [Ir(1)(4)]+ and [Ir(1)(5)]+, respectively. This energy difference is large enough to discard the contribution of the naphthyl-centred triplet excited state to the phosphorescence emission, which is predicted to occur from the lowest-energy, HOMO → LUMO, 3MLCT/3LLCT T1 state.
TD-DFT calculations were also performed for singlet excited states to investigate the nature of the bands appearing in the experimental absorption spectra (Fig. 5). Singlet excited states with mainly MLCT character and small oscillator strengths are found in the 400 nm region, followed by ligand-centred (LC) π → π* states involving both the ppy and bpy moieties with some MLCT/LLCT character between 400 and 300 nm. No excited state implying the naphthyl moiety of ligand 1 is found below 300 nm. According to the theoretical results, it is unlikely that emission, fluorescent or phosphorescent, takes place from naphthyl-centred excited states.
Electroluminescence devices
The electroluminescence properties of complexes [Ir(1)(N^N)][PF6] with N^N = 2–5 and complex [Ir(ppy)(4)][PF6] were investigated by incorporating them as emitters in LECs. From now on, LECs containing [Ir(1)(2)][PF6], [Ir(1)(3)][PF6], [Ir(1)(4)][PF6], [Ir(1)(5)][PF6] and [Ir(ppy)(4)][PF6] are referred as LECs A–E, respectively (Table 4). The LECs were prepared on ITO-patterned glass substrates in a double-layer structure. They consist of a PEDOT:PSS layer (80 nm) and the electroluminescent active layer (100 nm) sandwiched between two electrodes. Aluminium was thermally evaporated as the top cathode (70 nm). The LECs were characterized under inert conditions using a pulsed current driving of 25 A m−2 (average current density), a frequency of 1000 Hz and duty cycles of 50%. This operation method provides faster response and longer lifetimes than constant voltage operation.49 In LECs, the initial limited injection is assisted by the ion accumulation at the electrode interface and the formation of electrochemical p- and n-doped regions. Therefore, the behaviour of LECs is mainly governed by the ion mobility in the amorphous thin film. Even though iTMCs are intrinsically ionic, additional ions are usually added in the active layer to speed up the device response and to balance the carriers injected. In this work, the ionic liquid (IL) 1-butyl-3-imidazolium hexafluoridophosphate [Bmim][PF6] was added to the active layer at a molar iTMC![[thin space (1/6-em)]](https://www.rsc.org/images/entities/char_2009.gif) :
:![[thin space (1/6-em)]](https://www.rsc.org/images/entities/char_2009.gif) IL ratio of 4
IL ratio of 4![[thin space (1/6-em)]](https://www.rsc.org/images/entities/char_2009.gif) :
:![[thin space (1/6-em)]](https://www.rsc.org/images/entities/char_2009.gif) 1.50–52
1.50–52
Fig. 13 displays the luminance versus time curves for LECs A–E, and Table 4 collects the parameters that summarize the device performances. The turn-on time (tmax) is defined as the time to reach the maximum luminance (Lmax) and the device lifetime (t1/2) is the time to reach one-half of Lmax after this value is achieved. LEC devices can be divided in two groups with LECs D and E, which incorporate complexes [Ir(1)(5)][PF6] and [Ir(ppy)(4)][PF6], showing shorter tmax and faster luminance decays than LECs A–C (Table 4). LECs D and E show tmax, and t1/2 below 3.5 and 35 hours, respectively, whereas devices A–C have longer turn-on times above 45 hours and a much more stable behaviour with t1/2 values ranging from 581 to 785 hours. In contrast, LECs D and E achieve higher luminance values above 100 cd m−2 (133 and 146 cd m−2, respectively) compared with LECs A–C, which show maximum luminances of 91, 67 and 54 cd m−2, respectively. The maximum values obtained for the efficacy, the power conversion efficiency (PCE) and the external quantum efficiency (EQE) of LEC D (5.4 cd A−1, 2.2 lm W−1 and 2.1%, respectively) are slightly lower than those found for LEC E (6.4 cd A−1, 3.7 lm W−1 and 2.6%), and are similar to those reported for other orange-emitting Ir-iTMC-LECs under pulsed current operation.49,53 The efficiency, PCE and EQE values found for LECs A–C are smaller than those obtained for D, and decrease in passing from A to B and to C (Table 4). This trend is in agreement with the trend of the PLQY for the amorphous thin film (device environment) of the complexes [Ir(1)(2)][PF6], [Ir(1)(3)][PF6] and [Ir(1)(4)][PF6].
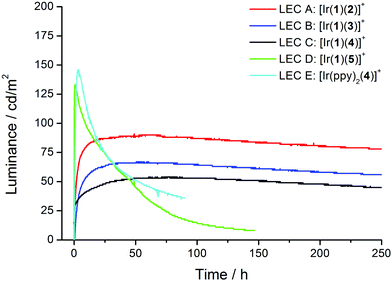 | ||
| Fig. 13 Luminance vs. time for the LECs driven using a pulsed current of 25 A m−2 (average current density) at a frequency of 1000 Hz and duty cycles of 50%. | ||
The main differentiator between the complexes [Ir(1)(5)][PF6] and [Ir(ppy)(4)][PF6] used to prepare LECs D and E is the naphthyl-bridged functionalization of the ppy ligands in the case of LEC D. Yet both the device responses tmax and t1/2 are comparable for these two devices, which indicates that the ppy functionalization does not influence the ionic movement in the films. Therefore, the longer tmax and t1/2 found for LECs A–C should not be ascribed to the large size of ligand 1. Moreover, the [Ir(1)(2)][PF6] complex, used in the fabrication of LEC A, exhibits the highest PLQY in thin film (22.6%), whereas the device efficiency is superior for D incorporating a complex with a slightly lower PLQY (21.9%). Considering these PLQY values and a typical outcoupling of 20%, the theoretical maximum EQEs predicted for LECs A and D when all injected electrons and holes combine have very similar values of 4.5% and 4.4%, respectively. As the EQE achieved for D (2.1%) is slightly closer to the theoretical value than that obtained for A (1.8%), we can hypothesize that the lower exciton-quenching for D could be the result of a better-balanced carrier injection due to the faster response. Hence, for the devices with slower response (devices A–C), lower efficiencies were achieved. Comparable characteristics have been observed for similar orange complexes reported in LECs.43
The electroluminescence (EL) spectrum of all the LECs was registered during the operation of the devices (Fig. S3†). All the LECs show orange electroluminescence with maxima in the 580–590 nm range but for LEC C ([Ir(1)(4)][PF6]) which emits at 575 nm. The EL spectra are similar to the PL spectra recorded in powder (Fig. 7) and in thin film (Fig. S1†).
Conclusions
We have prepared and characterized a series of cyclometallated [Ir(C^N)2(N^N)][PF6] compounds in which the two cyclometallating C^N units are connected by a naphthyl-containing linker. The N^N ligand (2–5) is a 2,2′-bipyridine functionalized with phenyl and tert-butyl groups. The electrochemical and photophysical properties were compared with those of [Ir(ppy)2(4)][PF6]. The complexes containing the naphthyl-unit exhibit similar absorption spectra, which differ from that of [Ir(ppy)2(4)][PF6] only in the presence of an intense absorption at ∼236 nm arising from naphthyl-centred π → π* transitions. Excitation at 280 nm leads to an orange emission for solutions of each complex, and going from solution to powder or thin film leads to little change or to a small blue shift in the emission. The incorporation of the naphthalene unit does not lead to a desirable blue contribution to the emission, and DFT/TD-DFT calculations were performed to understand this observation. The energy difference between the LUMO and the lowest-unoccupied MO centred on the naphthyl moiety (LUMO+7) is large enough to explain why there is no contribution from the naphthyl-centred triplet excited state to the phosphorescence emission. Singlet excited states were also investigated. LECs using the [Ir(1)(N^N)][PF6] and [Ir(ppy)2(4)][PF6] complexes in the emissive layer led to long living devices with modest turn-on times. The presence of the naphthyl-bridge between the cyclometallating units does not significantly alter the device response, indicating that it does not play a significant role in the ionic transport.Acknowledgements
We thank the Swiss National Science Foundation (Grant number 200020_144500), the European Research Council (Advanced Grant 267816 LiLo) and the University of Basel for financial support. This work has also been supported by the European Community's Seventh Framework Programme (LUMINET Grant 316906), the Spanish Ministry of Economy and Competitiveness (MINECO) (MAT2014-55200 CTQ2015-71154-P and Unidad de Excelencia María de Maeztu MDM-2015-0538), European Feder funds (CTQ2015-71154-P) and the Generalitat Valenciana (Prometeo2016/135). C.M. thanks MINECO for her predoctoral contract.Notes and references
- Q. Pei, G. Yu, C. Zhang, Y. Yang and A. J. Heeger, Science, 1995, 269, 1086 CrossRef CAS PubMed.
- K. M. Maness, R. H. Terrill, T. J. Meyer, R. W. Murray and R. M. Wightman, J. Am. Chem. Soc., 1996, 118, 10609 CrossRef CAS.
- S. Van Reenen, P. Matyba, A. Dzwilewski, R. A. J. Janssen, L. Edman and M. Kemerink, J. Am. Chem. Soc., 2010, 132, 13776 CrossRef CAS PubMed.
- L. Flamigni, A. Barbieri, C. Sabatini, B. Ventura and F. Barigelletti, Top. Curr. Chem., 2007, 281, 143 CrossRef CAS.
- M. S. Lowry and S. Bernhard, Chem. – Eur. J., 2006, 12, 7970 CrossRef CAS PubMed.
- R. D. Costa, E. Ortí, H. J. Bolink, F. Monti, G. Accorsi and N. Armaroli, Angew. Chem., Int. Ed., 2012, 51, 8178 CrossRef CAS PubMed.
- J. D. Slinker, J. Rivnay, J. S. Moskowitz, J. B. Parker, S. Bernhard, H. D. Abruna and G. G. Malliaras, J. Mater. Chem., 2007, 17, 2976 RSC.
- J. D. Slinker, A. A. Gorodetsky, M. S. Lowry, J. Wang, S. Parker, R. Rohl, S. Bernhard and G. G. Malliaras, J. Am. Chem. Soc., 2004, 126, 2763 CrossRef CAS PubMed.
- C. Ulbricht, B. Beyer, C. Friebe, A. Winter and U. S. Schubert, Adv. Mater., 2009, 21, 4418 CrossRef CAS.
- H.-C. Su, H.-F. Chen, Y.-C. Shen, C.-T. Liao and K.-T. Wong, J. Mater. Chem., 2011, 21, 9653 RSC.
- H.-C. Su, H.-F. Chen, F.-C. Fang, C.-C. Liu, C.-C. Wu, K.-T. Wong, Y.-H. Liu and S.-M. Peng, J. Am. Chem. Soc., 2008, 130, 3413 CrossRef CAS PubMed.
- L. He, J. Qiao, L. Duan, G. Dong, D. Zhang, L. Wang and Y. Qiu, Adv. Funct. Mater., 2009, 19, 2950 CrossRef CAS.
- J. Wu, F. Li, Q. Zeng, C. Nie, P. C. Ooi, T. Guo, G. Shan and Z. Su, Org. Electron., 2016, 28, 314 CrossRef CAS.
- S. Tang, J. Pan, H. A. Buchholz and L. Edman, J. Am. Chem. Soc., 2013, 135, 3647 CrossRef CAS PubMed.
- Y. Nishikitani, H. Takeuchi, H. Nishide, S. Uchida, S. Yazaki and S. Nishimura, J. Appl. Phys., 2015, 118, 225501 CrossRef.
- T. Akatsuka, C. Roldán-Carmona, E. Ortí and H. J. Bolink, Adv. Mater., 2014, 26, 770 CrossRef CAS PubMed.
- S. Tang, H. A. Buchholz and L. Edman, ACS Appl. Mater. Interfaces, 2015, 7, 25955 CAS.
- H. B. Wu, H. F. Chen, C. T. Liao, H. C. Su and K. T. Wong, Org. Electron. Phys. Mater. Appl., 2012, 13, 483 CAS.
- J.-S. Lu, H.-F. Chen, J.-C. Kuo, R. Sun, C.-Y. Cheng, Y.-S. Yeh, H.-C. Su and K.-T. Wong, J. Mater. Chem. C, 2015, 3, 2802 RSC.
- M. Asakawa, P. R. Ashton, S. E. Boyd, C. L. Brown, R. E. Gillard, O. Kocian, F. M. Raymo, J. F. Stoddart, M. S. Tolley, A. J. P. White and D. J. Williams, J. Org. Chem., 1997, 62, 26 CrossRef CAS PubMed.
- C. O. Dietrick-Buchecker, P. A. Marnot and J.-P. Sauvage, Tetrahedron Lett., 1982, 23, 5291 CrossRef.
- T. Kauffmann, J. König and A. Woltermann, Chem. Ber., 1976, 109, 3864 CrossRef CAS.
- M. Lepeltier, T. K.-M. Lee, K. K.-W. Lo, L. Toupet, H. Le Bozec and V. Guerchais, Eur. J. Inorg. Chem., 2005, 110 CrossRef CAS.
- M. J. Frisch, G. W. Trucks, H. B. Schlegel, G. E. Scuseria, M. A. Robb, J. R. Cheeseman, G. Scalmani, V. Barone, B. Mennucci, G. A. Petersson, H. Nakatsuji, M. Caricato, X. Li, H. P. Hratchian, A. F. Izmaylov, J. Bloino, G. Zheng, J. L. Sonnenberg, M. Hada, M. Ehara, K. Toyota, R. Fukuda, J. Hasegawa, M. Ishida, T. Nakajima, Y. Honda, O. Kitao, H. Nakai, T. Vreven, J. A. Montgomery, Jr., J. E. Peralta, F. Ogliaro, M. Bearpark, J. J. Heyd, E. Brothers, K. N. Kudin, V. N. Staroverov, R. Kobayashi, J. Normand, K. Raghavachari, A. Rendell, J. C. Burant, S. S. Iyengar, J. Tomasi, M. Cossi, N. Rega, N. J. Millam, M. Klene, J. E. Knox, J. B. Cross, V. Bakken, C. Adamo, J. Jaramillo, R. Gomperts, R. E. Stratmann, O. Yazyev, A. J. Austin, R. Cammi, C. Pomelli, J. W. Ochterski, R. L. Martin, K. Morokuma, V. G. Zakrzewski, G. A. Voth, P. Salvador, J. J. Dannenberg, S. Dapprich, A. D. Daniels, Ö. Farkas, J. B. Foresman, J. V. Ortiz, J. Cioslowski and D. J. Fox, Gaussian 09, Revision D.01, Gaussian, Inc., Wallingford, CT, 2009 Search PubMed.
- C. Lee, W. Yang and R. G. Parr, Phys. Rev. B: Condens. Matter., 1988, 37, 785–789 CrossRef CAS.
- A. D. Becke, J. Chem. Phys., 1993, 98, 5648–5652 CrossRef CAS.
- M. M. Francl, W. J. Pietro, W. J. Hehre, J. S. Binkley, M. S. Gordon, D. J. DeFrees and J. A. Pople, J. Chem. Phys., 1982, 77, 3654–3665 CrossRef CAS.
- P. J. Hay and W. R. Wadt, J. Chem. Phys., 1985, 82, 299–310 CrossRef CAS.
- S. Grimme, J. Antony, S. Ehrlich and H. Krieg, J. Chem. Phys., 2010, 132, 154104 CrossRef PubMed.
- S. Grimme, S. Ehrlich and L. Goerigk, J. Comput. Chem., 2011, 32, 1456–1465 CrossRef CAS PubMed.
- J. Tomasi and M. Persico, Chem. Rev., 1994, 94, 2027–2094 CrossRef CAS.
- C. S. Cramer and D. G. Truhlar, Solvent Effects and Chemical Reactivity, Kluwer, 1996, pp. 1–80 Search PubMed.
- J. Tomasi, B. Mennucci and R. Cammi, Chem. Rev., 2005, 105, 2999–3094 CrossRef CAS PubMed.
- M. E. Casida, C. Jamorski, K. C. Casida and D. R. Salahub, J. Chem. Phys., 1998, 108, 4439 CrossRef CAS.
- C. Jamorski, M. E. Casida and D. R. Salahub, J. Chem. Phys., 1996, 104, 5134 CrossRef CAS.
- M. Petersilka, U. J. Gossmann and E. K. U. Gross, Phys. Rev. Lett., 1996, 76, 1212 CrossRef CAS PubMed.
- H. S. Chow, E. C. Constable, R. Frantz, C. E. Housecroft, J. Lacour, M. Neuburger, D. Rappoport and S. Schaffner, New J. Chem., 2009, 33, 376 RSC.
- S. Clavier, S. Øystein, S. Hansen, L.-O. Gerlach, T. Högberg and J. Berman, Org. Biomol. Chem., 2003, 1, 4248 CAS.
- See for example: F. Neve, A. Crispini, S. Campagna and S. Serroni, Inorg. Chem., 1999, 38, 2250 CrossRef CAS and references therein.
- G. E. Schneider, H. J. Bolink, E. C. Constable, C. D. Ertl, C. E. Housecroft, A. Pertegas, J. A. Zampese, A. Kanitz, F. Kessler and S. B. Meier, Dalton Trans., 2014, 43, 1961 RSC.
- B. Schmid, F. O. Garces and R. J. Watts, Inorg. Chem., 1994, 33, 9 CrossRef CAS.
- A. M. Bünzli, E. C. Constable, C. E. Housecroft, A. Prescimone, J. A. Zampese, G. Longo, L. Gil-Escrig, A. Pertegás and H. J. Bolink, Chem. Sci., 2015, 6, 2843 RSC.
- R. D. Costa, E. Ortí, H. J. Bolink, S. Graber, C. E. Housecroft, M. Neuburger, S. Schaffner and E. C. Constable, Chem. Commun., 2009, 2029 RSC.
- E. Baranoff, H. J. Bolink, E. C. Constable, M. Delgado, D. Häussinger, C. E. Housecroft, M. K. Nazeeruddin, M. Neuburger, E. Ortí, G. E. Schneider, D. Tordera, R. M. Walliser and J. A. Zampese, Dalton Trans., 2013, 42, 1073 RSC.
- D. Tordera, A. M. Bünzli, A. Pertegás, J. M. Junquera-Hernández, E. C. Constable, J. A. Zampese, C. E. Housecroft, E. Ortí and H. J. Bolink, Chem. – Eur. J., 2013, 19, 8597 CrossRef CAS PubMed.
- See for example: D. M. Hercules and L. B. Rogers, Spectrochim. Acta, 1959, 15, 393 CrossRef.
- A. Abedi and V. Amani, Synth. React. Inorg., Met. Nano-Metal Chem., 2014, 44, 1326 CrossRef CAS.
- R. D. Costa, F. Monti, G. Accorsi, A. Barbieri, H. J. Bolink, E. Ortí and N. Armaroli, Inorg. Chem., 2011, 50, 7229 CrossRef CAS PubMed.
- D. Tordera, S. Meier, M. Lenes, R. D. Costa and E. Ortí, Adv. Mater., 2012, 24, 897 CrossRef CAS PubMed.
- J. D. Slinker, C. Y. Koh, G. G. Malliaras, M. S. Lowry and S. Bernhard, Appl. Phys. Lett., 2005, 86, 173506 CrossRef.
- Y. Shen, D. D. Kuddes, C. A. Naquin, T. W. Hesterberg, C. Kusmierz, B. J. Holliday and J. D. Slinker, Appl. Phys. Lett., 2013, 102, 203305 CrossRef.
- R. Sun, C.-T. Liao and H.-C. Su, Org. Electron., 2014, 15, 2885 CrossRef CAS.
- D. Tordera, A. Pertegás, N. M. Shavaleev, R. Scopelliti, E. Ortí, H. J. Bolink, E. Baranoff, M. Grätzel and M. K. Nazeeruddin, J. Mater. Chem., 2012, 22, 19264 RSC.
Footnote |
| † Electronic supplementary information (ESI) available: Tables S1 and S2: Computed geometrical parameters for Ir-iTMCs and lowest triplet excited states. Fig. S1–S3: Photoluminescence, excitation and electroluminescence spectra. See DOI: 10.1039/c6dt03082c |
| This journal is © The Royal Society of Chemistry 2016 |

