 Open Access Article
Creative Commons Attribution 3.0 Unported Licence
New insights into the comprehension of the magnetic properties of dinuclear MnIII compounds with the general formula [{MnL(NN)}2(μ-O)(μ-n-RC6H4COO)2]X2†
Luis
Escriche-Tur
*ab,
Mercè
Font-Bardia
c,
Belén
Albela
b and
Montserrat
Corbella
*ad
aDepartament de Química Inorgànica i Orgànica (Secció inorgánica), Universitat de Barcelona, C/Martí i Franquès 1-11, 08028 Barcelona, Spain. E-mail: luis.escrichetur@gmail.com; montse.corbella@qi.ub.es
bLaboratoire de Chimie, ENS de Lyon, Université de Lyon, 46 Allée d'Italie, 69364 Lyon Cedex 07, France
cCristallografia, Mineralogia i Dipòsits Minerals, Universitat de Barcelona, Martí i Franquès s/n, 08028 Barcelona, Spain
dInstitud de Nanociència i Nanotecnologia de la Universitat de Barcelona (IN2UB), Av. Joan XXIII s/n, 08028 Barcelona, Spain
First published on 30th May 2016
Abstract
Five new dinuclear Mn(III) compounds with benzoato derivative bridges [{Mn(bpy)L}2(μ-O)(μ-n-RC6H4COO)2]X2 (n-R = 3-MeO, 4-MeO and 4-tBu, X = NO3− and ClO4−) were synthesised and characterised. According to X-ray diffraction, the X anions tend to be coordinated to the Mn ions and may occupy the place of the monodentate ligand L. Two structural isomers that only differ in one of their monodentate ligands have been obtained with the 3-MeOC6H4COO− bridges. For all compounds, the Mn(III) ions display elongated octahedra with a pronounced rhombic distortion. To quantify these distortions separately, the elongation and rhombicity parameters Δ and ρ have been defined. The magnetic study shows a good relationship between the distortion of the coordination polyhedra and the zero field splitting parameters (DMn and EMn). From the magnetic data of a powder sample, it is possible to determine the sign and magnitude of DMn for ferromagnetic systems or weak antiferromagnetic systems with DMn < 0. For this kind of dinuclear compound, the R group at the meta position, the rhombic distortion of the octahedra, and large torsion angles between the Jahn–Teller axes lead to ferromagnetic interactions.
Introduction
The interest in the magnetic properties of dinuclear MnIII compounds with the [Mn2(μ-O)(μ-R′COO)2]2+ core lies in the versatility of their magnetic behaviour, which ranges from moderate ferro- to antiferromagnetic, with a ground state S = 4 and S = 0, respectively. The Mn ions in these compounds show an octahedral geometry with pronounced axial and rhombic distortions. The axial distortion is distinctive of MnIII ions, the octahedra can be elongated in the direction of the terminal ligands or compressed in the direction of the oxo bridging ligand. In general, those compounds that have compressed octahedra display ferromagnetic coupling, while those with elongated octahedra show antiferromagnetic coupling. When the predominant distortion is rhombic, the interaction may be either ferro- or antiferromagnetic.1–5Compounds with tridentate amines as blocking ligands usually display compressed distortion and, accordingly, a significant ferromagnetic interaction is observed.1,6–9 Nevertheless, some compounds displaying rhombic distortion may also be found, which show a weak antiferromagnetic interaction.10,11
When the capping ligand is bidentate, such as 2,2′-bipyridine (bpy) or 1,10-phenanthroline (phen), the sixth position of the coordination octahedra is occupied by a monodentate ligand, which provides greater flexibility in the coordination environment and gives distortions of different types and degrees.2 However, there is only one compound displaying compressed octahedra around the Mn(III) ions, [{Mn(bpy)(N3)}2(μ-O)(μ-C6H5COO)2], and it shows an important ferromagnetic coupling.12,13 The rest of them display elongated coordination octahedra toward the monodentate ligands. However, the magnitude of this distortion is sensitive to the specific monodentate ligand and its donor or acceptor character.2,4
In the last few years, we have focussed our attention on the study of the magnetic properties of this kind of dinuclear compound with benzoate-derivative bridges2–4,14,15 and the factors that determine the magnetic interaction. The interest is centred on the structural changes promoted by the monodentate ligand and the steric hindrance due to the substituent of the benzoato derivative. The analysis of the magnetic properties of compounds with 2-RC6H4COO− bridging ligands showed that the magnetic interaction for this kind of compound also depends on the relative orientation of the Jahn–Teller axes of the MnIII ions and the planarity between the aromatic ring and the carboxylate group.2
Furthermore, the magnetic anisotropy or zero-field splitting (ZFS) is one of the most important properties that characterises a metal ion with S > 1/2.16 Particularly, the MnIII ion is known to display significant axial (D) and rhombic (E) anisotropy parameters.17 The ZFS has been studied on several occasions for mononuclear compounds, providing an idea about the nature and magnitude of these parameters.16–19 Nevertheless, the determination of the single-ion anisotropy for polynuclear compounds is very challenging, since the overall magnetic properties are dependent on both the isotropic (Mn⋯Mn interactions) and the asymmetric interactions (referred to as ZFS).16,20
In this work we analyse the magnetic properties of a family of seven compounds with the general formula [{Mn(bpy)L}2(μ-O)(μ-n-RC6H4COO)2]X2, where n-R = 2-MeO (1 and 2), 3-MeO (3, 4, and 5), 4-MeO (6), or 4-tBu (7), X = NO3 (1, 3, and 4) or ClO4 (2, 5, 6, and 7), and L = H2O, EtOH, or X. Compounds 1 and 2 were recently published, but a deep discussion of their magnetic properties was not reported.21 The crystal structures of the new compounds (3–7) are reported here. The magnetic coupling constant and the ZFS parameters of the MnIII ions have been determined and the limits of detection for the sign and magnitude of these parameters have been evaluated. Moreover, the analysis of the structural parameters and the magnetic data of twenty-six analogous compounds has been carried out with the aim to find the ligands that could contribute to obtain systems with a ground state S = 4.
Experimental
Synthesis
All manipulations were performed under aerobic conditions. Reagents and solvents were obtained from commercial sources and used without further purification. NBu4MnO4 was prepared as described in the literature.22Caution! Perchlorate salts of compounds containing organic ligands are potentially explosive. Only small quantities of these compounds should be prepared.
X-ray crystallography
The data collection for compounds 3, 4, 5 and 7 was carried out at 100 K on a Bruker Apex-II diffractometer, whereas for 6, it was carried out at 273 K on a MAR345 diffractometer, both equipped with graphite monochromated Mo Kα radiation (λ = 0.71073 Å). Cell parameters were refined by the least-squares method using around 9900 reflections. Between 29![[thin space (1/6-em)]](https://www.rsc.org/images/entities/char_2009.gif) 302 and 123
302 and 123![[thin space (1/6-em)]](https://www.rsc.org/images/entities/char_2009.gif) 002 reflections were collected using the Φ- and ω-scan (Bruker Apex-II) or Φ-scan (MAR345) method. Data were corrected for absorption effects using the multi-scan (3, 5 and 7) or empirical (4 and 6) method (SADABS).23 Table S1† summarises crystallographic data collection and structure refinement details.
002 reflections were collected using the Φ- and ω-scan (Bruker Apex-II) or Φ-scan (MAR345) method. Data were corrected for absorption effects using the multi-scan (3, 5 and 7) or empirical (4 and 6) method (SADABS).23 Table S1† summarises crystallographic data collection and structure refinement details.
The structures were solved by direct methods and refined by full-matrix least-squares using SHELXL-97.24 Non-hydrogen atoms were refined anisotropically, whereas hydrogen atoms were computed and refined with isotropic thermal parameters riding on their respective carbon or oxygen atoms.
Compound 3·2CH3CN crystallises in the monoclinic space group C2/c. The asymmetric unit consists of half of the neutral complex [{Mn(bpy)(NO3)}2(μ-3-MeOC6H4CO2)2(μ-O)] located on a 2-fold rotation axis and a molecule of acetonitrile. A total of 286 parameters were refined in the final refinement on F2 using no restraints.
Compound 4·1/2H2O·1/2MeCN crystallises in the triclinic space group P![[1 with combining macron]](https://www.rsc.org/images/entities/char_0031_0304.gif) . The asymmetric unit consists of a cationic complex [{Mn(bpy)(H2O)}(μ-3-MeOC6H4CO2)2(μ-O){Mn(bpy)(NO3)}]+, a nitrate anion, a 50% occupancy acetonitrile molecule and a 50% occupancy water molecule. A total of 556 parameters were refined in the final refinement on F2 using 63 restraints.
. The asymmetric unit consists of a cationic complex [{Mn(bpy)(H2O)}(μ-3-MeOC6H4CO2)2(μ-O){Mn(bpy)(NO3)}]+, a nitrate anion, a 50% occupancy acetonitrile molecule and a 50% occupancy water molecule. A total of 556 parameters were refined in the final refinement on F2 using 63 restraints.
Compound 5 crystallises in the triclinic space group P![[1 with combining macron]](https://www.rsc.org/images/entities/char_0031_0304.gif) . The asymmetric unit consists of a cationic complex [{Mn(bpy)(H2O)}(μ-3-MeOC6H4CO2)2(μ-O){Mn(bpy)(ClO4)}]+, a perchlorate anion and disordered molecules of solvent. The program SQUEEZE (part of the PLATON package of crystallographic software)25 was used to calculate the solvent disorder and remove its contribution to the overall intensity data.26 Fifty-one electrons were found in a 161 Å3 void, corresponding to the diffuse contribution of a dichloromethane and a water molecule. A total of 592 parameters were refined in the final refinement on F2 using 286 restraints.
. The asymmetric unit consists of a cationic complex [{Mn(bpy)(H2O)}(μ-3-MeOC6H4CO2)2(μ-O){Mn(bpy)(ClO4)}]+, a perchlorate anion and disordered molecules of solvent. The program SQUEEZE (part of the PLATON package of crystallographic software)25 was used to calculate the solvent disorder and remove its contribution to the overall intensity data.26 Fifty-one electrons were found in a 161 Å3 void, corresponding to the diffuse contribution of a dichloromethane and a water molecule. A total of 592 parameters were refined in the final refinement on F2 using 286 restraints.
Compound 6·1/3MeCN·1/3H2O crystallises in the trigonal space group R![[3 with combining macron]](https://www.rsc.org/images/entities/char_0033_0304.gif) . The asymmetric unit consists of a [{Mn(bpy)(H2O)}(μ-3-MeOC6H4CO2)2(μ-O){Mn(bpy)(ClO4)}]+ complex, a perchlorate anion and disordered acetonitrile (on the 3-fold axis) and water molecules (around and on the 3-fold axis). A total of 591 parameters were refined in the final refinement on F2 using 38 restraints.
. The asymmetric unit consists of a [{Mn(bpy)(H2O)}(μ-3-MeOC6H4CO2)2(μ-O){Mn(bpy)(ClO4)}]+ complex, a perchlorate anion and disordered acetonitrile (on the 3-fold axis) and water molecules (around and on the 3-fold axis). A total of 591 parameters were refined in the final refinement on F2 using 38 restraints.
Compound 7 crystallises in the orthorhombic space group Pca2(1). The asymmetric unit consists of two conformational isomers of the cationic complex [{Mn(bpy)(EtOH)}(μ-4-tBuC6H4CO2)2(μ-O){Mn(bpy)(ClO4)}]+ and two perchlorate anions. A total of 1244 parameters were refined in the final refinement on F2 using 480 restraints.
Physical characterisation
Chemical analyses (C, H, N and Cl) were carried out by the “Centres Científics i Tecnològics” of the Universitat de Barcelona and by the “Servei de Microanàlisi” of the “Consell Superior d'Investigacions Científiques (CSIC)”. Infrared spectra were recorded on KBr pellets in the 4000–400 cm−1 range with a Thermo Nicolet Avatar 330 FTIR spectrometer. Magnetic susceptibility (χM) measurements (2–300 K) were carried out in a Quantum Design MPMS XL5 SQUID Magnometer at the Unitat de Mesures Magnètiques (Universitat de Barcelona), using a field of 200 G. Pascal's constants were used to estimate the diamagnetic corrections for each compound. Magnetisation measurements were carried out in the range 1.8–6.8 K and at six different magnetic fields (0.5, 1.0, 2.0, 3.0, 4.0 and 5.0 T).Results and discussion
Synthesis
The synthetic method used to obtain the dinuclear MnIII compounds 3–7 consists of a comproportionation reaction between MnII and MnO4− in the presence of a benzoic derivative acid and 2-2′-bipyridine (bpy), which leads to compounds with the general formula [{Mn(bpy)(L)}(μ-n-RC6H4CO2)2(μ-O){Mn(bpy)(L′)}]X2–m, where n-R = 3-MeO (3–5), 4-MeO (6) or 4-tBu (7) and X = NO3 (3 and 4) or ClO4 (5–7). L and L′ are monodentate ligands that can be H2O, EtOH or X. If both positions (L and L′) are occupied by X, like in compound 3, a neutral complex is formed. In the rest of compounds (4–7), only one of the monodentate positions is occupied by the anion X, so the complex is a monovalent cation. The syntheses and crystal structures of compounds with n-R = 2-MeO (1 and 2) were recently published.21 The synthesis of compounds with X = NO3 and n-R = 4-MeO and 4-tBu was also previously reported, but no X-ray suitable crystals were obtained.14The perchlorate compounds (5–7) are much more soluble than nitrate compounds (3 and 4) in acetonitrile solution, as reported before for analogous compounds with n-R = 2-Me and n-R = 2-F.4 Thus, while the nitrate compounds (3 and 4) could be crystallised from the acetonitrile solution, the perchlorate compounds (5–7) did not crystallise from the mother liquor. Compound 5 was obtained by slow diffusion of n-hexane (precipitant) into an acetonitrile solution of 5 layered with CH2Cl2. Compounds 6 and 7 are insoluble in ethanol solution, so they were crystallised by mixing a very concentrated solution of acetonitrile mother liquor with ethanol (6) or using ethanol instead of acetonitrile in the synthesis (7).
The IR spectra of these compounds show several characteristic bands assigned to the asymmetric and symmetric vibrations of the carboxylate groups (∼1560 and 1365 cm−1, respectively), the bypyridine (∼1600, 1498, 1480 and 1450 cm−1) and the Mn–O–Mn group (∼730 cm−1). The value Δν = νa(COO) − νs(COO) ≈ 200 cm−1 is indicative of carboxylate ligands coordinated in bidentate bridging mode (μ1,3).27 Compounds (5–7) display a strong band at ∼1110 cm−1 and a medium band at ∼620 cm−1, both assigned to the perchlorate anion. Compounds 3 and 4 display an intense band at ∼1352 cm−1 corresponding to the nitrate anion, which overlaps the νs(COO).
Compounds 3 and 4 are structural isomers that only differ from one of the monodentate ligands (3, L = L′ = NO3; 4, L = H2O and L′ = NO3) and are obtained under very similar conditions. However, the presence of water in the mother liquor favours the formation of 4, whereas 3 is obtained in dry acetonitrile. Fortunately, these two compounds can be easily differentiated by the shape of their crystals (Fig. S1†) and their IR spectra in the 960–800 cm−1 window (Fig. S2†). While 3 crystallises as big blocks and displays a band centred at 902 cm−1 of moderate intensity and two weak ones at 919 and 876 cm−1, 4 crystallises as small star-shaped agglomerations of needles and shows a pair of bands at 916 and 884 cm−1. To determine the suitable conditions to obtain the two compounds separately, several syntheses were performed controlling the addition of water. A pure sample of 3 was only isolated when dry acetonitrile was used. On the other hand, 4 was crystallised with a H2O/MeCN volume ratio of 0.02. Note that higher ratios than this are unnecessary and lead to the decomposition of the Mn compound. If H2O vapour diffusion is used as a crystallisation method, a mixture of the two compounds was obtained, indicating that humidity should be controlled. Hence, it is convenient to observe the sample under a magnifying glass to ensure the purity of the sample.
Description of structures
The crystal structures of compounds 3–7 are shown in Fig. 1. In all these compounds, the two MnIII ions show a distorted octahedral environment and are linked by one oxo and two μ1,3-n-RC6H4COO− bridges. Each manganese ion is bound to a 2,2′-bipyridine (bpy) ligand, and the hexacoordination of each Mn ion is completed by a monodentate ligand. In compound 3, the monodentate ligands are nitrate anions, so the resulting complex is neutral. In compounds 4–7, one of the monodentate ligands is a NO3− (4) or a ClO4− anion (5–7) and the other one is a water molecule (4 and 5) or EtOH (6 and 7), resulting in a cationic complex.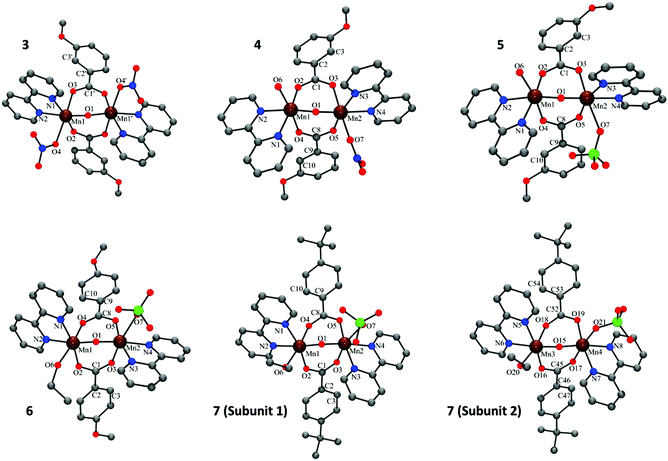 | ||
| Fig. 1 Crystal structures of compounds 3–7. Hydrogen atoms were omitted for clarity. Colour code: Mn, brown; C, grey; O, red; N, blue; Cl, green. | ||
The Mn⋯Mn distance is ∼3.15 Å and the Mn–Ob–Mn angle is ∼123°. The Mn–Ob bond distances of the oxo bridges are ∼1.78 Å and the Mn–N distances are ∼2.06 Å. The carboxylate ligands are coordinated in a syn–syn conformation mode. One of the oxygen atoms is placed trans to the monodentate ligand, with a Mn–Ot distance of ∼2.16 Å, whereas the other oxygen atom is placed in a cis position, with a shorter Mn–Oc distance (∼1.96 Å). The Mn–L bond lengths of the monodentate ligands are the largest in the first coordination sphere and are in the range 2.17–2.48 Å. Selected interatomic distances for these compounds are listed in Table S2† (for 3), Table S3† (for 4–6) and Table S4† (for 7). More particular details concerning the structures and intermolecular interactions may be found in the ESI.†
The structural parameters of these compounds are in agreement with those reported for compounds with the same [Mn2(μ-O)(μ-n-RC6H4CO2)2]2+ core.2,4,5,14,15,21,28 However, it is worth remarking that 6, with a Mn2–O7 of 2.48 Å (Mn–OClO4), has the longest Mn–L bond distance found for this kind of compound.
In these five compounds, the carboxylate group and the aromatic ring of the benzoate derivative are almost coplanar, having a twist angle ω(O–Ccarb–Car–C′ar) in the range of 0–17°. The relative orientation of the two coordination octahedra is near perpendicularity, with the torsion angle τ(L–Mn⋯Mn–L) between 68 and 117°. The values of these angles are also in agreement with those reported for compounds with meta- and para-benzoate derivatives (n = 3 and 4).5,14,28 In contrast, compounds with ortho-benzoate derivatives (n = 2) usually show higher ω values.2,4,15
As mentioned before, all MnIII ions in these compounds display elongated octahedra along the monodentate ligand direction; thus, the Jahn–Teller elongation axes should be approximately situated on the Ot–Mn–L direction. Besides, they also show a rhombic distortion (the Mn–Ob bond distance is significantly smaller than Mn–Oc). Considering the z axis in the Ot–Mn–L direction and the x axis in the oxo-bridge direction (Fig. 2), approximate values of the octahedron axis lengths can be found by addition of Mn-ligand distances: x = d(Mn–Ob) + d(Mn–Nt), y = d(Mn–Oc) + d(Mn–Nc) and z = d(Mn–L) + d(Mn–Ot).
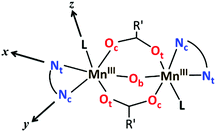 | ||
| Fig. 2 Schematic representation of the structure of the dinuclear MnIII complexes with the axes of the octahedron. | ||
Formerly, G. Fernández et al. described the distortion parameter (λ)4 as λ = (z − y)/(y − x) and it was used for several series of compounds.2,5,14 This parameter, which normally ranges from 0.2 to 3.5, offers the possibility to identify the predominant distortion (elongated octahedron if λ > 2, rhombic distortion if 2 > λ > 1, compressed octahedron if λ < 1). However, it does not allow us to quantify both distortions separately, which could be essential to better rationalise the axial and rhombic anisotropies of the MnIII ions (see below). In addition, λ shows an overstatement of the elongation when the rhombic distortion is very small. For instance, the Mn2 ion in 6 shows a very small rhombic distortion (x ≈ y); so, the λ parameter becomes enormous (value of 10) compared to the other MnIII ions in compounds 1–5, 7 (values between 1.3 and 3.8) (see Table 1).
Hence, in order to quantify both distortions, we defined two parameters for the elongation (Δ) and rhombicity (ρ) with the following formulae:
 | (1) |
 | (2) |
 . While Δ represents how different the Jahn–Teller axis is from the average length between x and y axes, ρ represents the distortion within the xy plane. Both parameters are dimensionless and can be expressed in the form of percentage for better clarity. For all these compounds (1–7), Δ should be greater than ρ (Δ > ρ) and both of them should be positive, characteristic of elongated octahedra with small or moderate rhombic distortion. This model can also be applied to compressed octahedra, in this case Δ < 0. In both kinds of octahedra, |Δ| > |ρ| (the absolute value of the elongation parameter should be greater than the absolute value of the rhombic one). If |Δ| < |ρ|, the axes are improperly assigned. And if |Δ| ≈ |ρ|, the octahedron has a pronounced rhombic distortion or the axes are improperly assigned.
The axis length and the Δ and ρ parameters for compounds 1–7 are listed in Table 1. Note that the average values of the axes follow the trend z > y > x with their respective standard deviations (s) following the trend sz > sy > sx, which indicates that the length for the z axis is the most variable. The resulting Δ and ρ distortions are in the ranges 10.0–17.9% and 1.7–5.8%, respectively; and, in accord with that explained above, these values are consistent with elongated octahedra with different degrees of rhombic distortion.
Magnetic properties
Magnetic susceptibility (χM) data were recorded for compounds 3–7 from 300 to 2 K. χMT vs. T plots for 3–7 are shown in Fig. 3. Note that the curves are remarkably different. The χMT values at room temperature are between 5.3 and 6.3 cm3 mol−1 K, which are close to the expected value for two uncoupled MnIII ions. For compounds 3–5, the χMT values remain almost constant until 100 K; but they increase below this temperature, reaching maximum values of 7.1 (3), 7.0 (4) and 6.7 (5) cm3 mol−1 K at ∼13 K. This behaviour is indicative of a ferromagnetic coupling (spin ground state S = 4). Below 13 K, χMT values slightly decrease due the zero-field splitting, as expected for MnIII ions. On the other hand, for compounds 6 and 7, the χMT values decrease as the temperature falls (more pronouncedly in the case of 7), indicative of an antiferromagnetic coupling (spin ground state S = 0). However, these compounds show different behaviour at very low temperature: for 7 the χMT reaches zero, characteristic of an isolated singlet ground state; while for 6 the χMT value at 2 K is 0.9 cm3 mol−1 K, indicating a non-negligible population in the first excited states. The magnetic study for compounds 1 and 2 was recently reported.21 Both compounds present a weaker antiferromagnetic coupling than 6 and 7, and show deviations in the low temperature range of the χMT vs. T plot, similar to 6.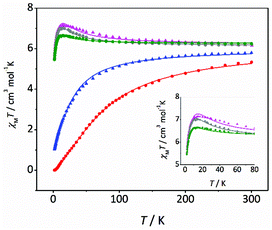 | ||
| Fig. 3 χ M T vs. T plots for compounds 3 (pink triangles), 4 (grey circles), 5 (green circles), 6 (blue triangles) and 7 (red circles). The solid lines are the best fits of the experimental data. | ||
χ M T vs. T data of compound 7 were fitted with the PHI program,29 considering the Heisenberg spin Hamiltonian H = –2JS1S2, whose results are presented in Table 2. On the other hand, the magnetic data of compounds 3–6 could not be fitted considering an isotropic system, as also happened with the aforementioned compounds 1 and 2.21 Indeed, it was necessary to include the ZFS parameters to fit the experimental χMT vs. T data of compounds 3–6.
| Ref. | G | 2J /cm−1 | D Mn /cm−1 | E Mn /cm−1 | E Mn/|DMn| | R SUS(RMAG)d |
|---|---|---|---|---|---|---|
| a Referred to the spin Hamiltonian H = −2JS1·S2. b ZFS parameter related to the axial anisotropy. c ZFS parameter related to the rhombic anisotropy. d R SUS = ∑[(χMT)exp − (χMT)calcd]2/∑[(χMT)exp]2; RMAG = ∑[(M/Nμβ)exp − (M/Nμβ)calcd]2/∑[(M/Nμβ)exp]2. e Kept constant. | ||||||
| 1 21 | 2.01 | −2.3 | −4.6 | +1.0e | 0.22 | 3.1 × 10⁻⁵ (3.0 × 10⁻³) |
| 2 21 | 2.01 | −0.7 | −3.0 | — | — | 9.0 × 10⁻⁵ (1.1 × 10⁻³) |
| 3 | 2.04 | +1.8 | −5.1 | +1.1 | 0.22 | 1.3 × 10⁻⁴ (2.5 × 10⁻⁴) |
| 4 | 2.02 | +1.3 | −4.1 | +1.1 | 0.27 | 2.3 × 10⁻⁵ (3.4 × 10⁻⁴) |
| 5 | 2.04 | +0.52 | −3.1 | +0.66 | 0.21 | 2.4 × 10⁻⁵ (9.5 × 10⁻⁴) |
| 6 | 2.00 | −4.8 | −5.3 | +1.0e | 0.19 | 3.1 × 10⁻⁴ (4.3 × 10⁻³) |
| 7 | 2.04 | −16.0 | — | — | 1.5 × 10⁻⁴ (—) | |
The zero-field splitting (ZFS) effect removes the degeneration of the MS states of each S level, and the energy gap between the MS states (DS and ES) depends on the magnitudes and signs of the anisotropy parameters of the MnIII ions, DMn and EMn.30 In the case of MnIII ions with elongated octahedral geometry like in compounds 3–7, negative and moderate values of DMn are expected.16–19 The low symmetry of the octahedra in these compounds also causes a pronounced rhombic distortion; so, significant EMn values are also expected.18,19 In addition, DMn and EMn are directional and, consequently, their relative orientation may affect the ZFS of each state (DS and ES). Particularly for the compounds presented here, DMn vectors should be approximately located along the z axis according to Fig. 2. Hence, their relative orientation (β angle) may have a pronounced effect on the MS splitting, since they would be around orthogonality (β ≈ 90°). This can affect the low temperature range of the χMT vs. T plot if there is any populated state with S ≠ 0. So, this could have some influence for compounds with weak or moderate antiferromagnetic magnetic interactions.
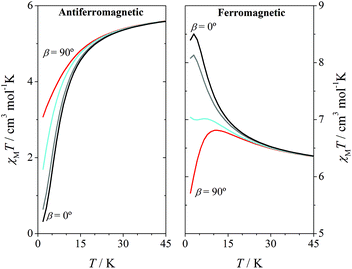
With the aim to see the effect of the relative disposition of the distortion axes, several simulations of the χMT vs. T plot were carried out with fixed values of 2J and DMn, but modifying the β angles between 0 and 90°. As it could be expected, for systems with strong antiferromagnetic interactions the effect of the β angle on the χMT vs. T plot is negligible. However, for systems with weak and moderate antiferromagnetic interactions, a significant effect on the shape of the graph was observed. Fig. 4 shows the χMT vs. T plot for systems with 2J = ±1 cm−1 and DMn = –4 cm−1. For the antiferromagnetic system with parallel Jahn–Teller axes (β = 0), χMT values fall to zero at low temperature, as expected for a ground state S = 0; however, when the axes are orthogonal (β = 90°), a significant deviation of the graph is observed.
It is well known that for systems with ferromagnetic interaction, the ZFS of the ground state S = 4 justifies the decay of the χMT values at low temperatures. This effect is influenced by the relative orientation of the Jahn–Teller axes (as in antiferromagnetic compounds): the χMT maximum shifts to a higher temperature and the χMT value of the maximum decreases for β = 90°.
To acquire more information, magnetisation (M) data were collected for compounds 3–6 in the range 1.8–6.8 K, applying magnetic fields between 0.5 and 5.0 T. M/Nμβvs. HT−1 plots for compounds 4–6 are shown in Fig. 5 and S7.† The non-superposition of the various isofield lines is indicative of a significant ZFS. All plots present similar features, without showing saturation at the highest field and lowest temperature, with maximum M/Nμβ values around 6Nβ for the ferromagnetic compounds 3–5 and 2.8Nβ for the antiferromagnetic compound 6. For compound 7, which shows χMT values close to zero at low temperature, no significant magnetisation signal can be expected.
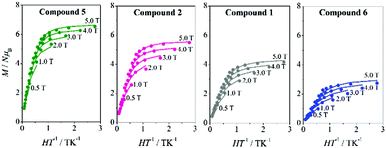 | ||
| Fig. 5 M/Nμβvs. HT−1 plots for 5 (green), 221 (pink), 121 (grey), and 6 (blue). The solid lines are the best fits of the experimental data. | ||
The question arises whether one can determine the sign of ZFS parameters by fitting χMT vs. T and M/Nμβvs. HT−1 plots and upon the precision of the results obtained from these fits. To solve these matters, several simulations of the χMT vs. T and M/Nμβvs. HT−1 plots were performed by screening different 2J and DMn values, all of them considering a relative orientation of the Jahn–Teller axes β = 90°.
For compounds with antiferromagnetic coupling (S = 0 ground state), the effect of the DMn parameter can only be observed if the first excited state (S = 1) is populated; for moderate or strong antiferromagnetic interactions (|2J| > 6 cm−1), the population of this excited state at low temperature is almost negligible and the effect of the DMn parameter is unnoticed. The ZFS of the S = 1 state strongly depends on the DMn parameter, since |DS=1| = 4.2|DMn|.
For compounds with ferromagnetic coupling (S = 4 ground state), the effect of the DMn parameter is always observable because it affects the ground state. However, for the same DMn value, the ZFS of the S = 4 (DS=4) is much smaller than the ZFS of the S = 1 (|DS=1| = 10|DS=4| for parallel Jahn–Teller axes).
When the anisotropy parameter (DMn) is small, (|DMn| ≤ 2 cm−1), the effect of their magnitude and sign on the χMT vs. T and M/Nμβvs. HT−1 plots is unimportant; although its effect could be noticed in the M/Nμβvs. HT−1 plot, the assignment of the sign of DMn would be ambiguous. On the other hand, for greater |DMn| values the differences between the plots simulated with positive and negative DMn values become more relevant as |DMn| increases.
The information obtained from each one of these plots complements the other one. Magnetisation plots are very sensitive to the magnitude and sign of DMn, except for compounds with moderate–strong antiferromagnetic coupling. However, the quantification of the magnetic coupling constant (2J) should not be performed using this plot. The χMT vs. T plot is, contrary to the previous one, highly affected by the 2J value, but the DMn parameter only affects in the low temperature range. For compounds with weak antiferromagnetic interactions, different behaviour could be observed as a function of the sign of DMn. When DMn > 0, χMT values tend to zero upon cooling and, consequently, the DMn value cannot be determined from these data; whereas, when DMn < 0, the χMT vs. T plot shows a deviation at low temperature (χMT values do not reach zero) and the magnitude of DMn should have some influence on the fitting of the experimental data. For ferromagnetic compounds, the χMT vs. T plots show differences depending on the magnitude of DMn, but the effect of the sign is sometimes insignificant.
To sum up, the determination of the magnitude and sign of the ZFS parameters of the single ion (DMn) can only be performed for compounds displaying ferromagnetic or weak antiferromagnetic coupling. For a good accuracy it is necessary to fit the χMT vs. T and M/Nμβvs. HT−1 data simultaneously, the first allows the determination of the magnetic coupling constant (2J) and the magnetisation data allow the determination of the ZFS parameters of the single ions (DMn).
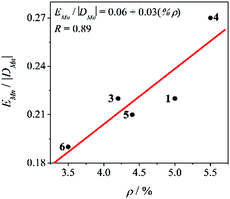
Therefore, the χMT vs. T and M/Nμβvs. HT−1 plots of compounds 3–6 were fitted simultaneously using the PHI program (H = –2JS1S2),29 considering the zero-field splitting (ZFS) parameters of manganese ions (DMn and EMn) and a relative orientation of the Jahn–Teller axes of 90°. Table 2 shows the results for the best fit of the experimental data for compounds 3–7. Compounds 3–6 and those reported previously (1 and 2) show negative values of DMn. Particularly for compounds 1, 2, and 6, with a weak antiferromagnetic behaviour, the sign and magnitude of the DMn are relevant for both the χMT vs. T and M/Nμβvs. HT−1 plots. Moreover, the values obtained for DMn are consistent with elongated MnIII ions with distorted octahedral geometry, which typically give moderate and negative DMn.16–19 The EMn/|DMn| ratios, which are in the range 0.19–0.27, are in agreement with elongated octahedra with rhombic distortion (x ≠ y). Furthermore, a good correlation between the EMn/|DMn| ratio and the rhombic distortion (ρ) is found, as could be seen in Fig. 6. This highlights the importance of quantifying the axial and rhombic distortions of the MnIII ions separately.
Magneto-structural correlations
Table 3 summarises the magnetic coupling constants and selected structural parameters for compounds 1–7 and nineteen other analogous compounds with benzoato derivative bridges ([{MnL(NN)}2(μ-O)(μ-n-RC6H4COO)2]X2). As may be observed, the magnetic coupling constants for these compounds (2J) range from −16.0 to +17.6 cm−1, compound 7 showing the most antiferromagnetic coupling. These compounds are classified according to the positions of the R group. As mentioned before, magneto-structural correlations for compounds with the R group at the ortho position (n = 2) had been reported previously.2 The structural parameters analysed were the distortion of the octahedra, the relative orientation of both polyhedra and the twist angles between the benzoate ring and the COO group (Fig. 7). Now, the same structural parameters are analysed for compounds with the R group at the meta and para positions (n = 3 and 4, respectively).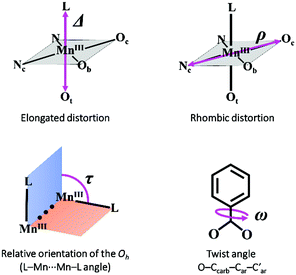 | ||
| Fig. 7 Structural parameters considered in the magneto-structural correlations for compounds with the formula [{MnL(NN)}2(μ-O)(μ-n-RC6H4COO)2]X2. | ||
| Ref. | n-R | NN | X | L | 2J /cm−1 | Mn–O–Mn/° | Δ /% | ρ /% | ω /° | τ /° | γ /° |
|---|---|---|---|---|---|---|---|---|---|---|---|
a
H = −2J(S1·S2).
b Average elongation (eqn (1)):  .
c Average rhombicity (eqn (2)): ρ = (y − x)/x.
d Average O–Ccarb–Car–C′ar angle.
e Relative orientation of the Oh: L–Mn⋯Mn–L angle.
f Mn–O–N–O torsion angle; abbreviations: bpy = 2,2′-bipyridine, phen = 1,10-phenanthroline. .
c Average rhombicity (eqn (2)): ρ = (y − x)/x.
d Average O–Ccarb–Car–C′ar angle.
e Relative orientation of the Oh: L–Mn⋯Mn–L angle.
f Mn–O–N–O torsion angle; abbreviations: bpy = 2,2′-bipyridine, phen = 1,10-phenanthroline.
|
|||||||||||
| A 15 | 2-Cl | Phen | ClO4 | H2O/H2O | −12.6 | 122.9 | 11.2 | 4.5 | 77.9 | 88.3 | |
| B 2 | 2-Cl | Bpy | ClO4 | H2O/ClO4 (3/1) | −10.9 | 122.8 | 13.3 | 3.5 | 56.5 | 92.6 | |
| C 4 | 2-Me | Bpy | ClO4 | H2O/ClO4 | −5.6 | 122.3 | 13.8 | 3.7 | 46.9 | 101.1 | |
| D 4 | 2-F | Bpy | ClO4 | H2O/ClO4 | −3.5 | 124.4 | 12.7 | 4.8 | 19.5 | 93.6 | |
| 1 21 | 2-MeO | Bpy | NO3 | H2O/NO3 | −2.3 | 123.5 | 10.8 | 5.0 | 36.2 | 78.1 | 0 |
| 2 21 | 2-MeO | Bpy | ClO4 | H2O/ClO4 | −0.7 | 122.8 | 12.2 | 4.4 | 29.2 | 95.2 | |
| E 4 | 2-Me | Bpy | NO3 | H2O/NO3 | −0.5 | 123.1 | 10.7 | 4.2 | 28.8 | 97.2 | 79 |
| F 2 | 2-Cl | Phen | — | NO3/NO3 | −0.3 | 124.4 | 9.7 | 4.7 | 38.1 | 101.7 | 22 |
| G 4 | 2-F | Bpy | NO3 | H2O/NO3 | +1.4 | 125.1 | 11.2 | 5.0 | 18.6 | 89.2 | 18 |
| H 15 | 2-Cl | Phen | ClO4 | H2O/H2O | +2.7 | 122.9 | 9.7 | 4.9 | 46 | 102 | |
| I 2 | 2-Cl | Bpy | NO3 | H2O/NO3 | +3.0 | 123.0 | 9.4 | 5.4 | 25.4 | 108.5 | 22 |
| J 33 | 2-COOH | Bpy | NO3 | H2O/NO3 (3/1) | +4.7 | 123.5 | 11.2 | 4.6 | 19.9 | 96.4 | 68 |
| 5 | 3-MeO | Bpy | ClO4 | H2O/ClO4 | +0.5 | 123.9 | 12.8 | 4.4 | 10.7 | 102.3 | |
| 4 | 3-MeO | Bpy | NO3 | H2O/NO3 | +1.3 | 124.7 | 11.8 | 5.2 | 11.8 | 92.8 | 8 |
| 3 | 3-MeO | Bpy | NO3 | NO3/NO3 | +1.8 | 124.5 | 12.4 | 4.2 | 16.9 | 117.2 | 3 |
| K 28 | 3-Cl | Phen | ClO4 | H2O/H2O | +5.7 | 121.0 | 11.6 | 4.7 | 3.9 | 120.6 | |
| L 28 | 3-Cl | Bpy | NO3 | H2O/H2O | +11.8 | 122.4 | 9.0 | 5.4 | 5.8 | 112.7 | |
| 7 | 4-tBu | Bpy | ClO4 | EtOH/ClO4 | −16.0 | 120.8 | 13.2 | 4.1 | 3.8 | 73.7 | |
| M 5 | 4-Br | Bpy | ClO4 | EtOH/ClO4 | −6.8 | 122.8 | 14.6 | 4.0 | 10.7 | 94.1 | |
| 6 | 4-MeO | Bpy | ClO4 | EtOH/ClO4 | −5.2 | 123.5 | 15.6 | 3.5 | 11.7 | 95.5 | |
| N 5 | 4-Cl | Phen | ClO4 | EtOH/EtOH | 0 | 122.1 | 11.1 | 4.1 | 6.7 | 88.9 | |
| O 14 | 4-F | Bpy | NO3 | H2O/H2O | +1.4 | 124.4 | 10.0 | 5.1 | 9.3 | 99 | |
| P 14 | 4-Me | Bpy | NO3 | H2O/H2O | +1.5 | 122.1 | 10.9 | 4.4 | 7.3 | 112 | |
| Q 3 | H | Bpy | — | OH/NO3 | +2.0 | 124.1 | 10.8 | 5.3 | 10.2 | 94.9 | 8 |
| R 14 | 4-CF3 | Bpy | NO3 | H2O/H2O | +5.7 | 122.2 | 10.6 | 4.2 | 7.5 | 116 | |
| S 13 | H | Bpy | — | N3/N3 | +17.6 | 122.0 | 5.3 | 7.4 | 5.0 | 108.1 | |
In our previous work, we saw the influence of different structural parameters on the magnetic interaction individually.2 Now, we would like to correlate these parameters aiming to find the one being more predominant for the magnetic interactions.
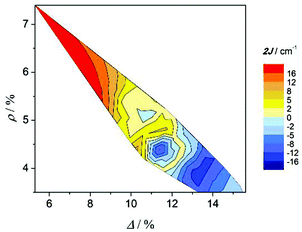
In previous work2–4 it was reported that the elongation of the octahedra is related to the antiferromagnetic behaviour. With the aim to see the effect of both distortion parameters on the magnetic coupling, Fig. 8 shows the contour plot of the rhombicity parameter (ρ) versus the elongation parameter (Δ) and the magnetic interaction (2J) for compounds collected in Table 3. Two facts can be deduced from this graph: firstly, the Δ and ρ parameters are inversely proportional; and, secondly, compounds with the ferromagnetic interaction show Δ ≈ ρ, while compounds with an antiferromagnetic interaction show Δ ≫ ρ. These results are consistent with those reported previously;2 however, the new distortion parameters, which consider the elongation and the distortion of the xy plane separately, give a more accurate correlation.
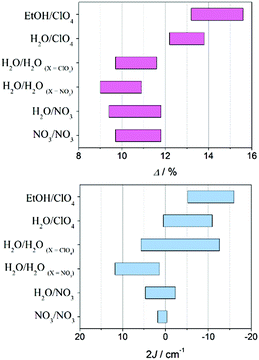 | ||
| Fig. 9 Ranges for the elongation parameter Δ (top) and magnetic coupling constant J (bottom) for [{MnL(NN)}2(μ-O)(μ-n-RC6H4COO)2]X2 compounds depending on their L ligand. | ||
Concerning the distortion parameter, compounds with perchlorate as the monodentate ligand display the largest elongations of the octahedra, Δ values being between 12 and 16%. This effect is magnified if they also contain ethanol. On the other hand, compounds containing water or nitrate show similar Δ values, but in a lower range (9–12%) than the ones with perchlorate.
Accordingly, compounds with perchlorate ligands show a more antiferromagnetic interaction than those with nitrate ligands. Surprisingly, compounds with L = H2O/H2O and perchlorate as counter-anions (non-coordinated) show more antiferromagnetic couplings than those with nitrate counter-anions, and this difference is more acute than that found for the elongation parameter (Δ). So, most compounds with the perchlorate ligand or counter-anion show antiferromagnetic behaviour, while compounds with the nitrate ligand or counter-anion show ferromagnetic behaviour. The cause of this fact may lie either in the resulting packing that each counter-anion provides or in the electronic effects promoted by hydrogen bonds Mn–OH2⋯X (through the monodentate ligand).
Moreover, it was reported4 that the magnetic interaction is also sensitive to the orientation of the nitrate ligand. When the NO3− ligand is positioned perpendicular to the z axis, with γ (MnONO torsion angle) close to 90°, it may act as a π-acid ligand and decreases the antiferromagnetic contributions. The three new compounds herein reported with the nitrate ligand (1, 3 and 4) show a parallel disposition of these ligands, so we can expect a negligible π-acid effect of this ligand.
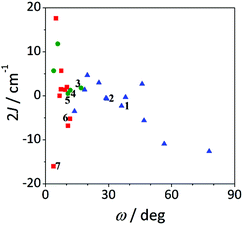
The correlation between this angle, the elongation parameter, and the magnetic interaction is shown in Fig. 12. As indicated, compounds with substantial elongation of the octahedra show antiferromagnetic behaviour. However, for Δ > 10% two regions where compounds display strong antiferromagnetic behaviour may be seen in the two extremes of the ω values.
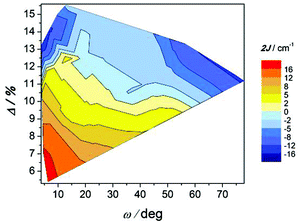 | ||
| Fig. 12 Magnetic coupling constant 2J vs. twist angle O–Ccarb–Car–C′ar (ω) and the elongation parameter (Δ) for compounds with the formula [{MnL(NN)}2(μ-O)(μ-n-RC6H4COO)2]X2. | ||
The effect of the ω angle on the magnetic coupling has been reported for compounds A and H, two conformational isomers that have different ground states (spinomers). According to these theoretical studies, for ω ≈ 0 and 90°, the disposition of the orbitals of the carboxylate ligands is appropriate for overlapping with the d orbitals of the Mn ions; while for ω ≈ 45°, the topology of the orbitals changes and the antiferromagnetic contribution is reduced.15 The results shown in Fig. 12 are in agreement with this study; for similar elongation values, the weaker antiferromagnetic behaviour is observed for a stacked configuration of the benzoate ring (ω ≈ 40°).
On the other hand, the most ferromagnetic compounds show small ω and Δ values; the slight elongation of the octahedra should be the major contribution to the ferromagnetic character.
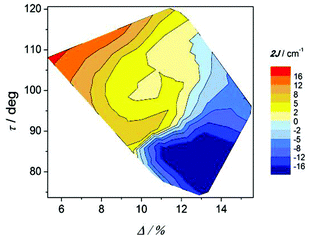
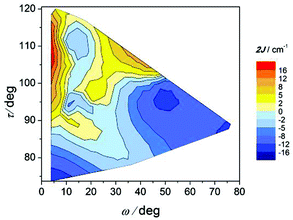
The effect of the twist of the phenyl ring (ω) and the relative orientation of the octahedra (τ) on the magnetic coupling constant (2J) can be seen in Fig. 13. As in the precedent graph, two well defined regions with important negative 2J values are observed for τ angles below 100° at the two extremes of the ω values. For ω < 10°, the magnetic interaction seems to be dictated by the τ angle, since the bigger this angle is, the more ferromagnetic the compound is. Nevertheless, as the phenyl ring losses the coplanarity with the COO group (ω > 10°), ω becomes more relevant than τ for the magnetic coupling.
Moreover, it was previously reported that, with similar structural parameters, compounds with an electron-withdrawing group show a more ferromagnetic behaviour than those with electron-donating groups.14 The Hammett constant (σ) is related to the electronic effect of the R group, and has two contributions, due to the inductive and resonance effects.31,32 Resonance contribution can only occur for substituents at the ortho and para positions. So, when the R group is at the meta position, the σmeta only depends on the inductive effect. Moreover, inductive effects diminish with the distance between R and COO groups. Thus, for the same R group, σmeta is generally greater than σpara and, consequently, the 3-R group has a major electron-withdrawing character compared to the 4-R group.
Conclusions
Five new dinuclear Mn(III) compounds with benzoato derivative bridges [{Mn(bpy)L}2(μ-O)(μ-n-RC6H4COO)2]X (n-R = 3-MeO, 4-MeO and 4-tBu) are reported. According to XRD, the X anions tend to be coordinated to the Mn ions and may occupy the place of the monodentate ligands L. Two structural isomers that only differ in their monodentate ligands have been obtained with the 3-MeOC6H4COO− ligand. For all compounds, the MnIII ions show elongated octahedra with a pronounced rhombic distortion, the distortion axis being in the direction of the monodentate ligand. To quantify these distortions separately, the elongation and rhombicity parameters Δ and ρ have been defined.The magnetic measurements revealed that compounds with n-R = 3-MeO display a ferromagnetic behaviour with the ground state S = 4, whereas compounds with n-R = 4-MeO and 4-tBu show an antiferromagnetic behaviour with the ground state S = 0. The Jahn–Teller axes of the Mn ions in these compounds are close to orthogonality and this fact has an important effect on the magnetic behaviour in the low temperature range for compounds with ferromagnetic or weak antiferromagnetic behaviour. Fitting all the magnetic data simultaneously, χM and M, makes it possible to determine the sign and magnitude of the ZFS parameters. For all compounds, DMn values are moderate and negative and the EMn/|DMn| ratio is correlated with the rhombicity parameter (ρ).
Structural and magnetic data of twenty-six analogous compounds have been analysed and some new conclusions may be drawn:
(a) The elongation (Δ) and rhombicity (ρ) parameters are inversely proportional.
(b) The most elongated octahedra correspond to compounds with L = ClO4 or EtOH. Consequently, compounds with L = EtOH/ClO4 show the most antiferromagnetic behaviour.
(c) The torsion angle between the phenyl and the COO groups of the benzoic derivative (ω) is only important for compounds with the R group at the ortho position.
(d) The structural parameters leading to the ferromagnetic behaviour are rhombic distortion of the octahedra, coplanarity between the phenyl ring and the COO group, and a large angle between the Jahn–Teller axes.
(e) All compounds with the R group at the meta position (n = 3) exhibit ferromagnetism; this position provides a major electron-withdrawing character to the R group.
Acknowledgements
This work was supported by the Ministerio de Ciencia e Innovación of Spain (project CTQ2012-30662 and CTQ2015-63614-P). L.E. thanks the University of Barcelona for the APIF fellowship. We are thankful to S. Speed for her contribution to the resolution of crystal structures.References
- R. Hotzelmann, K. Wieghardt, U. Floerke, H. J. Haupt, D. C. Weatherburn, J. Bonvoisin, G. Blondin and J. J. Girerd, J. Am. Chem. Soc., 1992, 114, 1681–1696 CrossRef CAS.
- V. Gómez, M. Corbella, O. Roubeau and S. J. Teat, Dalton Trans., 2011, 40, 11968–11975 RSC.
- M. Corbella, R. Costa, J. Ribas, P. H. Fries, J.-M. Latour, L. Öhrström, X. Solans and V. Rodríguez, Inorg. Chem., 1996, 35, 1857–1865 CrossRef CAS.
- G. Fernández, M. Corbella, G. Aullón, M. A. Maestro and J. Mahía, Eur. J. Inorg. Chem., 2007, 2007, 1285–1296 CrossRef.
- M. Corbella, V. Gómez, B. Garcia, E. Rodriguez, B. Albela and M. A. Maestro, Inorg. Chim. Acta, 2011, 376, 456–462 CrossRef CAS.
- C. Bolm, N. Meyer, G. Raabe, T. Weyhermüller and E. Bothe, Chem. Commun., 2000, 2435–2436 RSC.
- K. Wieghardt, U. Bossek, B. Nuber, J. Weiss, J. Bonvoisin, M. Corbella, S. E. Vitols and J. J. Girerd, J. Am. Chem. Soc., 1988, 110, 7398–7411 CrossRef CAS.
- T. K. Lal and R. Mukherjee, Inorg. Chem., 1998, 37, 2373–2382 CrossRef CAS.
- S. Mahapatra, T. K. Lal and R. Mukherjee, Inorg. Chem., 1994, 33, 1579–1580 CrossRef CAS.
- F. J. Wu, D. M. Kurtz, K. S. Hagen, P. D. Nyman, P. G. Debrunner and V. A. Vankai, Inorg. Chem., 1990, 29, 5174–5183 CrossRef CAS.
- J. E. Sheats, R. S. Czernuszewicz, G. C. Dismukes, A. L. Rheingold, V. Petrouleas, J. Stubbe, W. H. Armstrong, R. H. Beer and S. J. Lippard, J. Am. Chem. Soc., 1987, 109, 1435–1444 CrossRef CAS.
- J. B. Vincent, K. Folting, J. C. Huffman and G. Christou, Biochem. Soc. Trans., 1988, 16, 822–823 CrossRef CAS.
- J. B. Vincent, H. L. Tsai, A. G. Blackman, S. Wang, P. D. W. Boyd, K. Folting, J. C. Huffman, E. B. Lobkovsky, D. N. Hendrickson and G. Christou, J. Am. Chem. Soc., 1993, 115, 12353–12361 CrossRef CAS.
- M. Corbella, G. Fernández, P. González, M. Maestro, M. Font-Bardia and H. Stoeckli-Evans, Eur. J. Inorg. Chem., 2012, 2012, 2203–2212 CrossRef CAS.
- V. Gómez, M. Corbella and G. Aullón, Inorg. Chem., 2010, 49, 1471–1480 CrossRef PubMed.
- R. Boča, Coord. Chem. Rev., 2004, 248, 757–815 CrossRef.
- S. Gomez-Coca, E. Cremades, N. Aliaga-Alcalde and E. Ruiz, J. Am. Chem. Soc., 2013, 135, 7010–7018 CrossRef CAS PubMed.
- G. Aromí, J. Telser, A. Ozarowski, L.-C. Brunel, H.-M. Stoeckli-Evans and J. Krzystek, Inorg. Chem., 2005, 44, 187–196 CrossRef PubMed.
- C. Duboc, D. Ganyushin, K. Sivalingam, M.-N. Collomb and F. Neese, J. Phys. Chem. A, 2010, 114, 10750–10758 CrossRef CAS PubMed.
- M. Retegan, M.-N. Collomb, F. Neese and C. Duboc, Phys. Chem. Chem. Phys., 2012, 15, 223–234 RSC.
- L. Escriche-Tur, M. Corbella, M. Font-Bardia, I. Castro, L. Bonneviot and B. Albela, Inorg. Chem., 2015, 54, 10111–10125 CrossRef CAS PubMed.
- T. Sala and M. V. Sargent, J. Chem. Soc. Chem. Commun., 1978, 253–254 RSC.
- SADABS, Version 2008/1; Sheldrick, Bruker AXS Inc., 2008 Search PubMed.
- G. M. Sheldrick, Acta Crystallogr., Sect. A: Fundam. Crystallogr., 2007, 64, 112–122 CrossRef PubMed.
- A. L. Spek, J. Appl. Crystallogr., 2003, 36, 7–13 CrossRef CAS.
- P. van der Sluis and A. L. Spek, Acta Crystallogr., Sect. A: Fundam. Crystallogr., 1990, 46, 194–201 CrossRef.
- G. B. Deacon and R. J. Phillips, Coord. Chem. Rev., 1980, 33, 227–250 CrossRef CAS.
- V. Gómez and M. Corbella, Eur. J. Inorg. Chem., 2012, 2012, 3147–3155 CrossRef.
- N. F. Chilton, R. P. Anderson, L. D. Turner, A. Soncini and K. S. Murray, J. Comput. Chem., 2013, 34, 1164–1175 CrossRef CAS PubMed.
- O. Kahn, Molecular magnetism, VCH, 1993 Search PubMed.
- L. P. Hammett, Trans. Faraday Soc., 1938, 34, 156–165 RSC.
- L. P. Hammett, J. Am. Chem. Soc., 1937, 59, 96–103 CrossRef CAS.
- C. Chen, H. Zhu, D. Huang, T. Wen, Q. Liu, D. Liao and J. Cui, Inorg. Chim. Acta, 2001, 320, 159–166 CrossRef CAS.
Footnote |
| † Electronic supplementary information (ESI) available: Photographs of the crystals of compounds 3 and 4, the 960–800 cm−1 window of the transmittance infrared spectra for 3 and 4, crystal data and structure refinement for compounds 3–7, particular details and intermolecular interactions concerning the crystal structures of compounds 3–7, tables containing interatomic distances and angles for 3–7, and M/Nμβvs. HT−1 plots for compounds 3 and 4. X-ray crystallographic file in CIF format for the structure determination of compounds 3–7. CCDC 1469362–1469366. For ESI and crystallographic data in CIF or other electronic format see DOI: 10.1039/c6dt01097k |
| This journal is © The Royal Society of Chemistry 2016 |


