
 Open Access Article
 This Open Access Article is licensed under a
 Creative Commons Attribution 3.0 Unported Licence
Studies of viomycin, an anti-tuberculosis antibiotic: copper(II) coordination, DNA degradation and the impact on delta ribozyme cleavage activity
K.
Stokowa-Sołtys
*a,
N. A.
Barbosa
a,
A.
Kasprowicz
b,
R.
Wieczorek
a,
N.
Gaggelli
c,
E.
Gaggelli
c,
G.
Valensin
c,
J.
Wrzesiński
b,
J.
Ciesiołka
b,
T.
Kuliński
b,
W.
Szczepanik
a and
M.
Jeżowska-Bojczuk
*a
aFaculty of Chemistry, University of Wrocław, F. Joliot-Curie 14, 50-383 Wrocław, Poland. E-mail: kamila.stokowa-soltys@chem.uni.wroc.pl; malgorzata.jezowska-bojczuk@chem.uni.wroc.pl
bInstitute of Bioorganic Chemistry, Polish Academy of Sciences, Noskowskiego 12/14, 61-704 Poznań, Poland
cDepartment of Biotechnology, Chemistry and Pharmacy, University of Siena Via Aldo Moro, 2-53100 Siena, Italy
First published on 18th April 2016
Abstract
Viomycin is a basic peptide antibiotic, which is among the most effective agents against multidrug-resistant tuberculosis. In this paper we provide the characteristics of its acid base properties, coordination preferences towards the Cu(II) ions, as well as the reactivity of the resulting complexes against plasmid DNA and HDV ribozyme. Careful coordination studies throughout the wide pH range allow for the characterisation of all the Cu(II)–viomycin complex species. The assignment of proton chemical shifts was achieved by NMR experiments, while the DTF level of theory was applied to support molecular structures of the studied complexes. The experiments with the plasmid DNA reveal that at the physiological levels of hydrogen peroxide the Cu(II)–viomycin complex is more aggressive against DNA than uncomplexed metal ions. Moreover, the degradation of DNA by viomycin can be carried out without the presence of transition metal ions. In the studies of antigenomic delta ribozyme catalytic activity, viomycin and its complex are shown to modulate the ribozyme functioning. The molecular modelling approach allows the indication of two different locations of viomycin binding sites to the ribozyme.
Introduction
Tuberculosis is a serious global health problem caused by the bacillus Mycobacterium tuberculosis,1 associated with the human population since antiquity.2 It is one of the oldest and most pervasive respiratory transmitted diseases.3 According to the World Health Organization (WHO) report, this infection has reached every corner of the globe. In 2013, an estimated 9.0 million people developed tuberculosis and 1.5 million died from the disease.4 Therefore, tuberculosis is still considered to be a huge threat to mankind.5 Attempts to develop a TB remedy began in the 1940s with great optimism. Soon after, streptomycin was introduced.6 Nowadays, treatment of tuberculosis consists mainly of applying first-line antitubercular agents, which include streptomycin, isoniazid, rifampicin, ethambutol and pyrazinamide. These drugs are more effective and less toxic than the second-line agents, such as capreomycin, viomycin, amikacin, ciprofloxacin or ethionamide.7It is worthy of note that the average plasma concentration of serum copper in healthy people is around 1.02![[thin space (1/6-em)]](https://www.rsc.org/images/entities/char_2009.gif) ± 0.2 μg mL−1. This value is increased in tuberculosis patients and reaches 1.24 ± 0.1 μg mL−1 before the start of treatment and goes down to 1.16 ± 0.04 μg mL−1 after four weeks of antitubercular therapy.8 It has been shown that some parameters such as age, sex, smoking habit and use of oral contraceptive pills can affect serum copper levels.9–11 It is also well known that some medicines include functional groups that enable them to interact with some biomolecules as well as with metal ions present in physiological fluids. Recent findings endorse the chelating effect of ethambutol, leading to a decrease in serum levels of cationic trace elements, e.g. copper. The studies have shown a significant reduction of the serum copper concentration by approx. 30% after 10 days of treatment with this drug. These results support the hypothesis that ethambutol may alter the serum copper concentration in humans. This may be partly due to the chemical structure of ethambutol which is similar to that of penicillamine,11 a well-known chelator used, inter alia, for copper removal in Wilson's disease.12 In general, copper easily forms strong complexes with nitrogen donors, also present in polypeptide molecules.13,14 Therefore, tuberactinomycins may chelate copper ions very effectively.15
± 0.2 μg mL−1. This value is increased in tuberculosis patients and reaches 1.24 ± 0.1 μg mL−1 before the start of treatment and goes down to 1.16 ± 0.04 μg mL−1 after four weeks of antitubercular therapy.8 It has been shown that some parameters such as age, sex, smoking habit and use of oral contraceptive pills can affect serum copper levels.9–11 It is also well known that some medicines include functional groups that enable them to interact with some biomolecules as well as with metal ions present in physiological fluids. Recent findings endorse the chelating effect of ethambutol, leading to a decrease in serum levels of cationic trace elements, e.g. copper. The studies have shown a significant reduction of the serum copper concentration by approx. 30% after 10 days of treatment with this drug. These results support the hypothesis that ethambutol may alter the serum copper concentration in humans. This may be partly due to the chemical structure of ethambutol which is similar to that of penicillamine,11 a well-known chelator used, inter alia, for copper removal in Wilson's disease.12 In general, copper easily forms strong complexes with nitrogen donors, also present in polypeptide molecules.13,14 Therefore, tuberactinomycins may chelate copper ions very effectively.15
Viomycin and capreomycin are basic peptide antibiotics, structurally related, which are among the most effective agents against multidrug-resistant tuberculosis.16–18 From the coordination point of view, the most important difference between them is the presence of a serine residue in viomycin instead of α,β-diaminopropionic acid in the capreomycin molecule. Hence, it is interesting how the absence of the least basic amino function would affect the metal ion binding process by viomycin, bearing in mind that this group is responsible for anchoring Cu(II) ions by capreomycin.15
The mechanism of action of several antibiotics on pathogenic bacteria involves their interactions with RNA molecules, especially with ribosomal RNAs.19 It has been shown that two peptide antibiotics, viomycin and capreomycin, inhibit protein synthesis in prokaryotic organisms. The postulated mechanism relies on the inhibition of the translocation process resulting in their antibacterial activity.20 Crystallographic analysis of T. thermophilus ribosome has revealed that tuberactinomycin family antibiotics, including viomycin and capreomycin, are specifically placed in a cleft between the small and large ribosomal subunits, interacting with helix 44 of 16S rRNA and helix 69 of 23S rRNA.16 In addition, tuberactinomycins impact the catalytic activity of several ribozymes. Viomycin inhibits the catalytic activity of group I introns and cis-acting delta ribozymes.21,22 However, in the case of VS ribozyme, viomycin at a concentration over 100 μM increases its activity.23
Recently, we have studied the protonation of capreomycin and the ability of this drug to coordinate Cu(II) ions.15 The results were extremely useful for explaining the impact of capreomycin and its complex on the catalytic activity of the delta ribozyme and for evaluating the possible mechanisms of modulation of ribozyme activity.24 In this report we describe the results of comprehensive studies of viomycin, which is structurally related to capreomycin. We attempted to determine copper(II) coordination properties of this drug, its DNA degradation abilities, and the impact on delta ribozyme cleavage activity.
Results and discussion
Investigation of Cu(II) binding by viomycin
In addition to lysine, serine and diaminopropionic acid, viomycin (Fig. 1) contains the unusual noncoded amino acids, viomycidine and ureidodehydroalanine.25 In order to calculate the stability constants for the Cu(II)–viomycin complexes, the acid–base characteristics of the ligand had to be determined. Titration of viomycin in a wide pH range allowed calculation of its pKa values. A viomycin molecule has three positively charged functional groups able to lose protons (β-NH3+, ε-NH3+ of β-lysine and a guanidine moiety of viomycidine). According to the predictions, the presence of the hydroxyl group in the viomycidine residue (res. 6) increases the pKa value of the guanidine moiety beyond the range detectable by the potentiometric method.26 In consequence, the studied ligand behaves as the H2L molecule able to dissociate only two protons from β-lysine (res. 1). The lower pKa value may be attributed to the amino group in the β-position, while the higher one – to the amino group in the ε-position.27 The obtained constants, collected in Table 1, are apparently higher by a ca. 0.2 log unit than the respective values calculated for capreomycin.15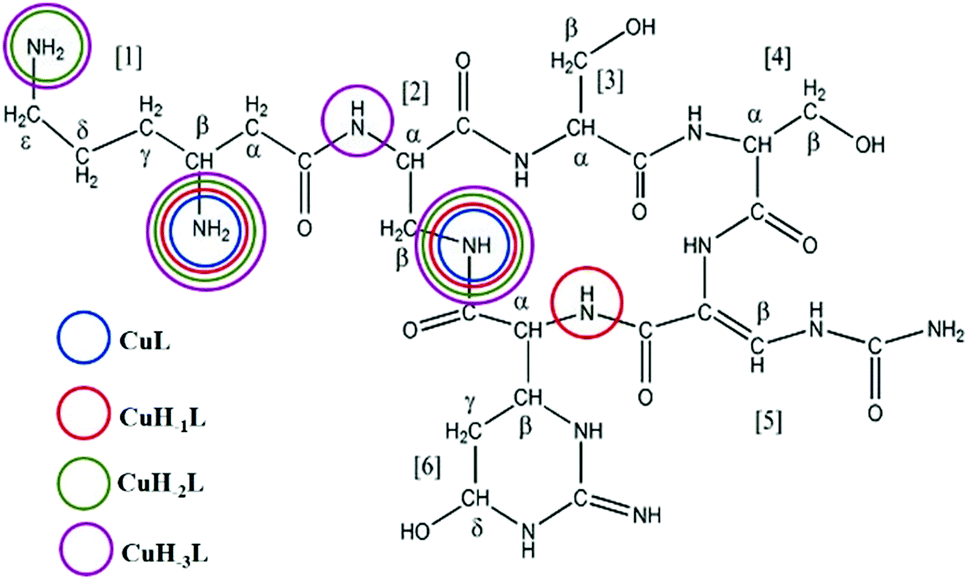 | ||
| Fig. 1 The molecular structure of viomycin with donor atoms highlighted. | ||
| Potentiometry | UV-Vis | CD | EPR | |||||
|---|---|---|---|---|---|---|---|---|
| logβa |
pKab |
λ [nm] | ε [M−1 cm−1] | λ [nm] | Δε [M−1 cm−1] | A ∥ [G] | g ∥ | |
|
a Overall stability constant (β) expressed by equations: for ligand: β(HnL) = [HnL]/([L][H+]n); for complexes: β(CuHnL) = [CuHnL]/([Cu][L][H+]n); charges omitted for better clarity of the formulae, statistical errors on the last digits of stability constant are given in parentheses.
b Deprotonation constant (pKa) expressed by equations: for ligand: pKa = logβ(HnL) − logβ(Hn−1L); for complexes: pKa = logβ(CuHnL) − logβ(CuHn−1L).
|
||||||||
| H2L | 18.341(1) | 8.13 | 267 | 23873 |
259 | −4.77 | — | |
| HL | 10.212(1) | 10.21 | 269 | 24658 |
259 | −4.78 | ||
| CuL | 9.45(1) | 7.65 | 634 | 61 | 255 | −5.85 | 179 | 2.27 |
| 644 | −0.22 | |||||||
| CuH−1L | 1.80(2) | 8.46 | 585 | 82 | 245 | −6.71 | 185 | 2.24 |
| 288 | +4.45 | |||||||
| 629 | −0.42 | |||||||
| CuH−2L | −6.66(2) | 9.24 | 573 | 113 | 242 | −8.80 | 188 | 2.22 |
| 298 | +9.00 | |||||||
| 586 | +0.26 | |||||||
| 725 | −0.31 | |||||||
| CuH−3L | −15.90(3) | 10.81 | 545 | 123 | 240 | −9.57 | 202 | 2.19 |
| 297 | 10.09 | |||||||
| 520 | −0.31 | |||||||
| 628 | −0.12 | |||||||
| 725 | −0.20 | |||||||
| CuH−4L | −26.71(4) | — | 542 | 128 | 238 | −11.95 | 202 | 2.19 |
| 298 | 9.50 | |||||||
| 567 | −1.06 | |||||||
A more basic character of viomycin is induced by the above mentioned presence of a hydroxyl group in the viomycidin residue which also affects the pKa values of both remaining amino groups.
Complexes of metal ions with biomolecules, such as polypeptides, may exist in several isomers. The spatial surrounding of the metal centre may influence charge distribution and thus have an impact on the complex properties. As a result of the differences in pKa values of the anchoring amino groups between the two structurally familiar tuberactinomycins, viomycin coordinates Cu(II) ions at a slightly higher pH value compared to capreomycin.15 Under the most acidic conditions, first a CuL complex is formed (Fig. 2). In this case, the metal ion is bound by two nitrogen donors, which can be confirmed by the spectroscopic parameters. The d–d transition appears at 634 nm in the UV-Vis spectra and at 644 nm in the CD spectra (Table 1).28 Analysis of the coordination sphere executed by EPR spectroscopy at the maximum concentration of the species also confirms the proposed binding mode (A∥ = 179 G, g∥ = 2.27).29 Apart from the d–d transitions, the CD spectra also yield the CT ones (λ = 255 nm). The band at around 260 nm was previously observed in a solution of the free antibiotic. However, its intensity was about one unit lower. Thus, it may be presumed that an increase of its intensity results from overlapping of the intraligand band and the CT transition NH2 → Cu(II).30
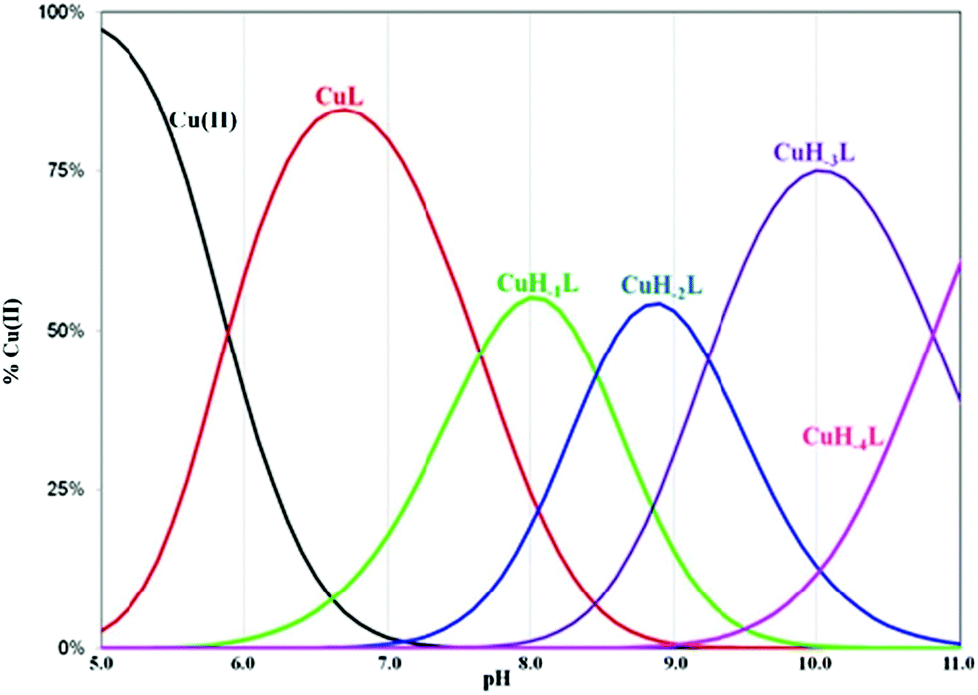 | ||
| Fig. 2 The distribution diagram of the Cu(II)–viomycin complexes in aqueous solution. | ||
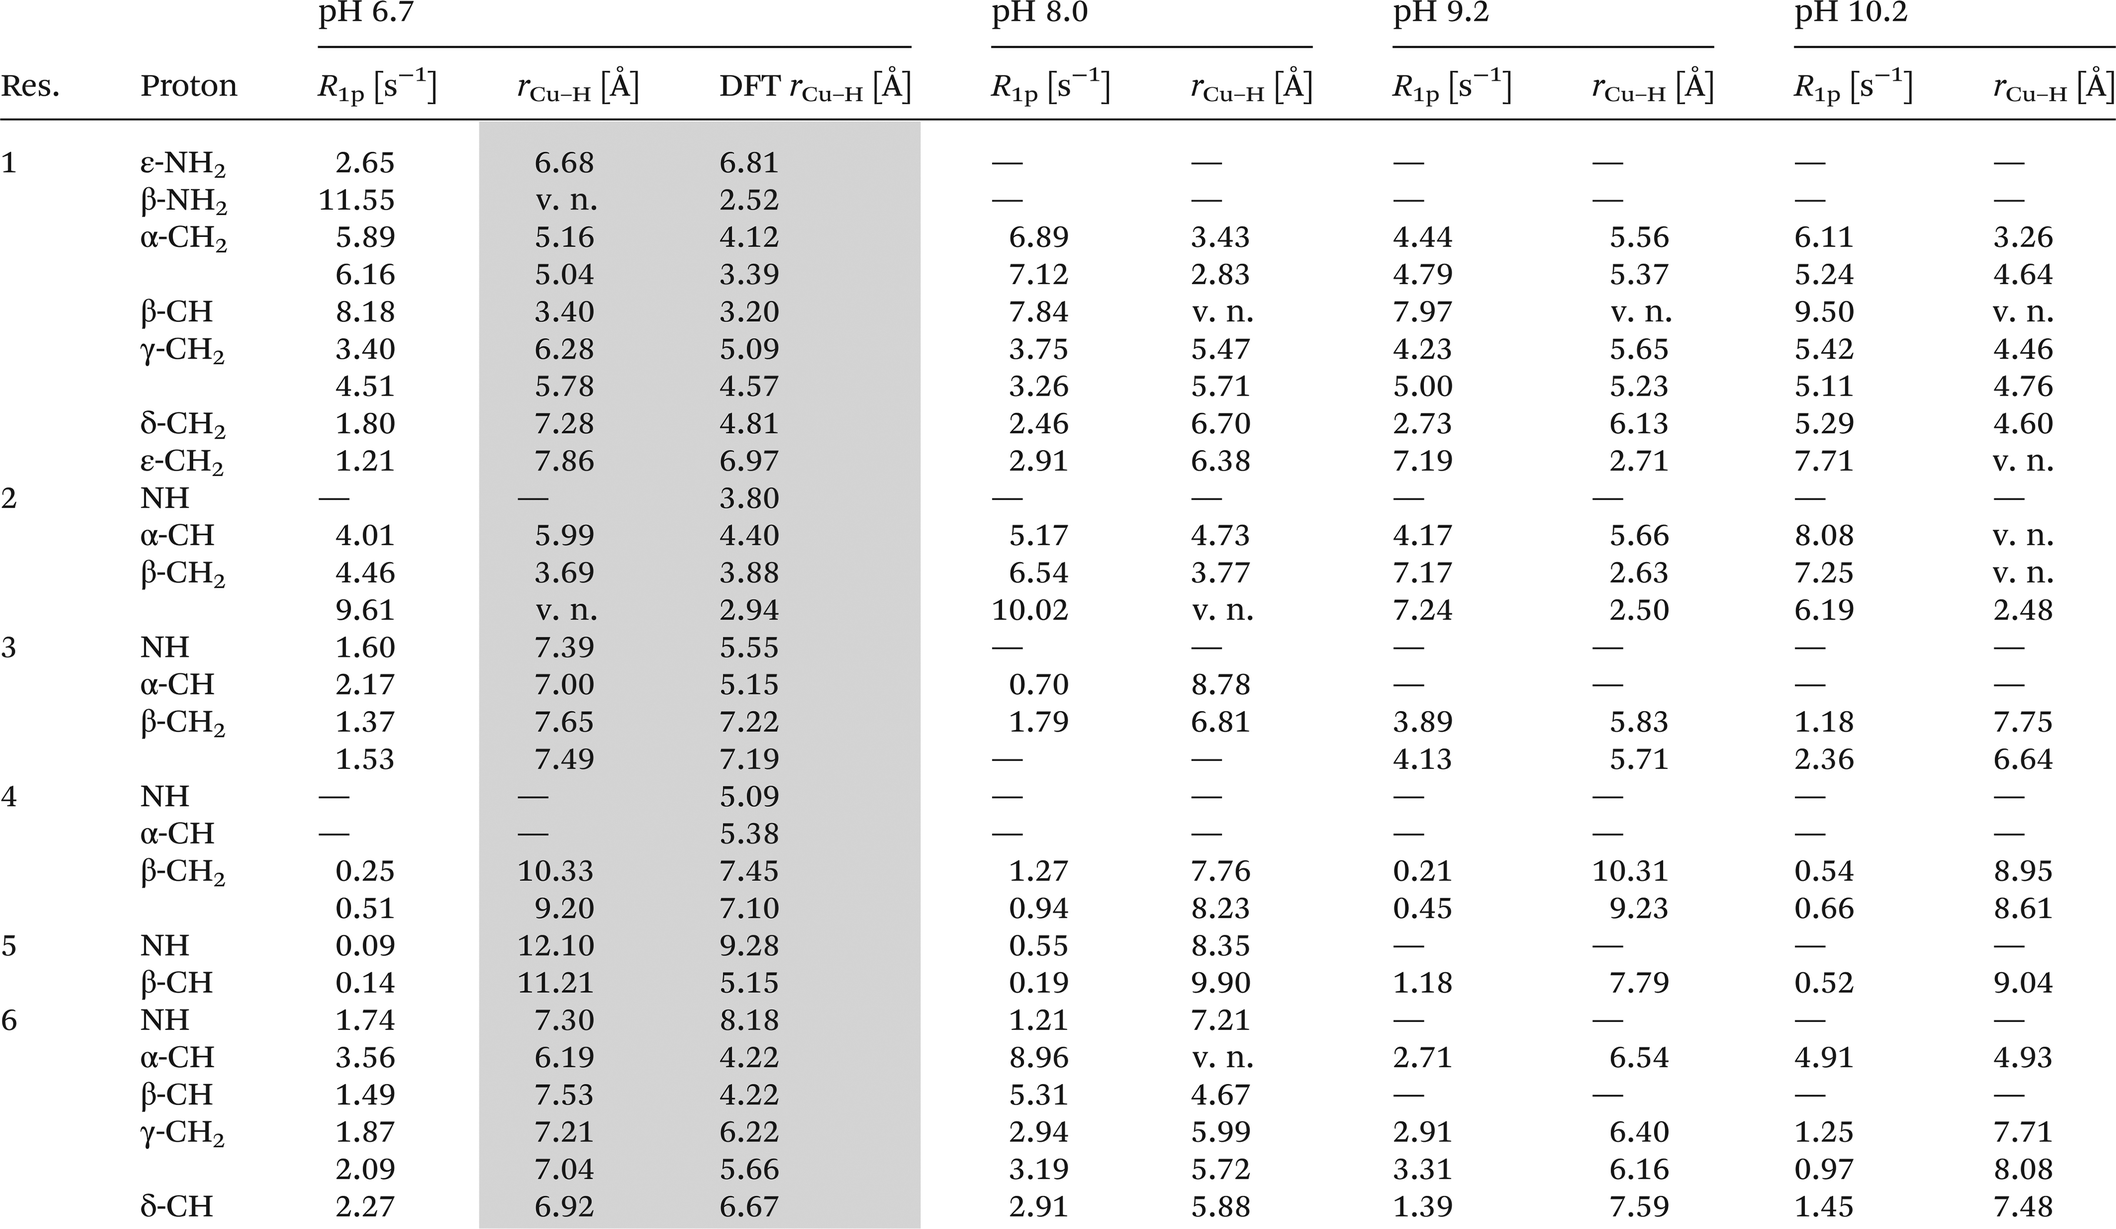
In order to unambiguously establish the coordination pattern of the CuL complex, 1H-NMR methods were applied. The assignment of proton chemical shifts (Table 2) of viomycin was achieved by COSY, TOCSY and NOESY experiments. 1H-NMR spectra show a remarkable overlapping of signals in the region around 3.9 ppm. Both in this case and with regard to chemical shifts and relaxation rates of α-protons falling into the water suppression region (around 4.7 ppm) we obtained the relative values exclusively by 2D-NMR experiments. Addition of 0.04 eq. of Cu(II) to the ligand solution selectively affects proton spin–lattice relaxation rates (Table 3). Proton longitudinal relaxation rates R1 (= 1/T1) were measured both in the absence and in the presence of metal ions and used to identify the binding sites of copper ions. At all studied pH values, the 1H-NMR spectra of viomycin bound to copper ions (at the molar ratio M:L = 1:25) do not show substantial broadening of proton signals as compared to the free ligand. The only exception concerns the β-CH of residue 1, clearly affected at all pH values.
| Residue | Proton | pH 6.7 | pH 8.0 | pH 9.2 | pH 10.2 |
|---|---|---|---|---|---|
| 1 | ε-NH2 | 8.17 | — | — | — |
| β-NH2 | 6.47 | — | — | — | |
| α-CH2 | 2.72 | 2.67 | 2.50 | 2.50 | |
| 2.65 | 2.56 | 2.38 | 2.38 | ||
| β-CH | 3.61 | 3.48 | 3.23 | 3.22 | |
| γ-CH2 | 1.80 | 1.70 | 1.57 | 1.55 | |
| 1.76 | 1.64 | 1.50 | 1.50 | ||
| δ-CH2 | 1.79 | 1.75 | 1.73 | 1.73 | |
| ε-CH2 | 3.10 | 3.10 | 2.99 | 3.00 | |
| 2 | NH | 7.75 | 7.75 | — | — |
| α-CH | 4.26 | 4.26 | 4.13 | 4.13 | |
| β-CH2 | 4.14 | 4.13 | 3.90 | 3.90 | |
| 3.88 | 3.88 | 3.21 | 3.21 | ||
| 3 | NH | 7.76 | 7.70 | — | — |
| α-CH | 4.83 | 4.80 | 4.72 | 4.72 | |
| β-CH2 | 3.95 | 3.94 | 4.25 | 4.25 | |
| 3.86 | 3.85 | 3.85 | 3.85 | ||
| 4 | NH | 7.75 | 7.75 | — | — |
| α-CH | 4.69 | 4.68 | 4.68 | 4.68 | |
| β-CH2 | 4.12 | 4.12 | 3.79 | 3.78 | |
| 3.11 | 3.10 | 3.12 | 3.10 | ||
| 5 | NH | 7.97 | 7.98 | 7.99 | 7.98 |
| β-CH | 8.03 | 8.02 | 8.02 | 8.02 | |
| 6 | NH | 7.70 | 7.75 | — | — |
| α-CH | 5.20 | 5.20 | 5.20 | 5.20 | |
| β-CH | 5.04 | 4.85 | 4.75 | 4.75 | |
| γ-CH2 | 2.06 | 2.06 | 2.06 | 2.06 | |
| 1.60 | 1.60 | 1.62 | 1.62 | ||
| δ-CH | 4.63 | 4.62 | 4.62 | 4.62 |
| v. n. – very near; missing values are due to severe overlapping or bad fitting. |
|---|
|
At pH 6.7, the proton spin–lattice relaxation enhancements (R1p, Table 3) suggest the β-amino group of residue 1 (Nβ res. 1) and the β-amide group of residue 2 (Nβ res. 2) as the anchoring sites for copper(II) (Fig. 1). Indeed, β-NH2 and β-CH of residue 1, and β-CH2 of residue 2 show the highest values of R1p as compared to the other protons of the ligand. After calculating the proton paramagnetic spin–lattice relaxation rates of viomycin, as the difference between the rates measured in the presence and in the absence of Cu(II) ions, R1p = R1obs − R1free, and by using an exchange time τM = 4.80 ± 0.01 ms and a correlation time τc = τR = 0.75 ± 0.02 ns (the same value has been calculated for all the studied complexes), we obtained the Cu–H distances for a majority of viomycin protons, by following the methods described in the Experimental section. The Cu–H distances are reported in Table 3.
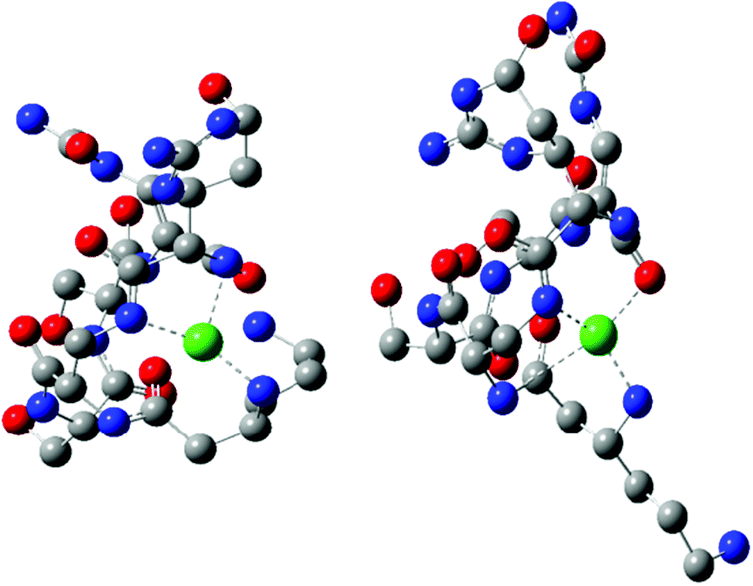
Quantum-chemistry methods are a useful tool to predict the structure and stability of the complexes.31–33 Therefore, we used the DFT level of theory to support the molecular structure of the above mentioned complex. We found that thermodynamically stable, multiple connected CuL species can exist in two forms: complex A, where a cation binds the peptide via three interactions – two Cu–N which are supported by Cu–O and complex B with only two Cu–N bonds (Fig. 3). In complex A, the first Cu–N bond is formed by β-NH2 (Nβ res. 1) with the length of 2.020 Å and the second one between the cation and amide nitrogen (Nα res. 6; 2.007 Å). The third interaction Cu–Oβ (res. 5) is weaker, with the distance between atoms equal to 2.147 Å. Despite fewer interactions, the second investigated CuL species (Fig. 3, complex B) is more stable than complex A (by 128.87 kcal mol−1), forming more effective Cu–N interactions. Both distances, Cu–Nβ (res. 1) and Cu–Nβ (res. 2), are in this case significantly shorter in comparison with complex A: 1.950 and 1.953 Å, respectively. The stability of theoretically investigated complexes allows us to expect complex B to be observed by the experimental methods used in the case of CuL {2N type of coordination}. DFT has been proved as a method that offers good agreement with NMR data.34–36 The comparison between theoretically calculated metal–proton distances and 1H-NMR is presented in Table 3; the values of rCu–H show a good agreement between the theoretically predicted complex and the experimentally observed structure of CuL. The observed discrepancy between rCu–H in residues 5 and 6 can be assigned to the difference between static DFT calculations and low rotation barriers of the side chains of 5 and 6 residues in real complexes.37–39 A and B complexes have a similar internal hydrogen bond (HB) network. We found 5 HBs in complex A and 4 HBs in complex B (Table 4). Hydrogen bonds play a stabilizing role, however in a cyclic and relatively small viomycin molecule most of the HBs are significantly bent. Therefore, a large part of the stabilizing effect of the HB which we have found in linear peptides40,41 must be missing in this case. Interestingly, regular α-helical fragments were found in both A and B complexes.
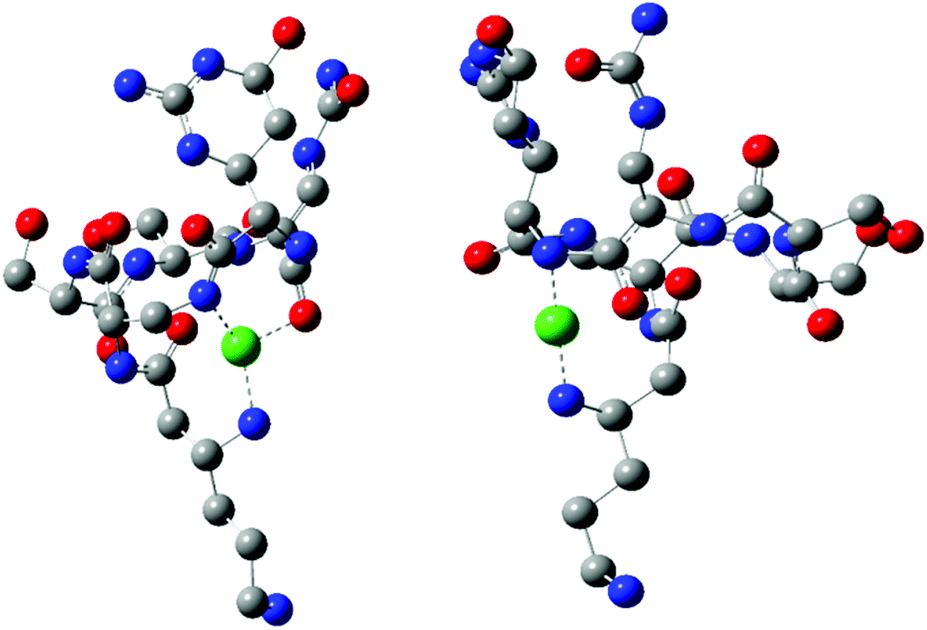 | ||
| Fig. 3 Structures of DFT calculated CuL complexes: A (left) and B (right). | ||
| Complex | Fragment | H⋯Y | X⋯Y | X–H⋯Y |
|---|---|---|---|---|
| A | CO(res. 5)⋯HO(res. 6) | 1.930 | 2.802 | 147.1 |
| CO(res. 4)⋯HN(res. 5) | 1.836 | 2.726 | 143.4 | |
| CO(res. 1)⋯HN(res. 5) | 1.863 | 2.833 | 157.9 | |
| CO(res. 2)⋯HN(res. 6) | 1.843 | 2.855 | 167.9 | |
| OH(res. 4)⋯H(res. 3) | 1.984 | 2.959 | 173.6 | |
| B | OH(res. 6)⋯CH(res. 5) | 1.744 | 2.680 | 155.3 |
| CO(res. 4)⋯HN(res. 5) | 2.016 | 2.898 | 143.2 | |
| OH(res. 4)⋯H(res. 3) | 2.167 | 3.146 | 179.4 | |
| C | CO(res. 5)⋯HO(res. 6) | 1.700 | 2.682 | 166.0 |
| CO(res. 5)⋯HN(res. 4) | 1.960 | 2.753 | 132.7 | |
| OH(res. 3)⋯H(res. 4) | 2.032 | 2.991 | 165.8 | |
| CO(res. 3)⋯HN(res. 1) | 2.061 | 3.086 | 170.4 | |
| CO(res. 6)⋯HN(res. 1) | 1.676 | 2.698 | 161.0 | |
| CO(res. 1)⋯HN(res. 5) | 2.023 | 3.010 | 163.0 | |
| D | CO(res. 5)⋯HO(res. 6) | 1.803 | 2.769 | 167.5 |
| CO(res. 4)⋯HN(res. 5) | 1.847 | 2.714 | 140.5 | |
| CO(res. 1)⋯HN(res. 5) | 1.608 | 2.696 | 166.8 | |
| OH(res. 6)⋯OC(res. 2) | 1.741 | 2.632 | 147.5 | |
| OH(res. 3)⋯H(res. 4) | 2.081 | 3.060 | 178.2 | |
| E | OH(res. 3)⋯OH(res. 4) | 1.969 | 2.944 | 173.6 |
| CO(res. 4)⋯HN(res. 5) | 1.988 | 2.797 | 134.4 | |
| CO(res. 1)⋯HN(res. 5) | 1.872 | 2.836 | 156.5 | |
| OH(res. 6)⋯OC(res. 5) | 1.657 | 2.643 | 165.8 | |
| F | OH(res. 3)⋯H(res. 4) | 2.001 | 2.971 | 170.0 |
| CO(res. 4)⋯HN(res. 5) | 2.124 | 2.723 | 115.5 | |
| OH(res. 6)⋯OC(res. 5) | 1.652 | 2.597 | 154.4 | |
| CO(res. 1)⋯HN(res. 5) | 1.782 | 2.757 | 158.9 | |
| G | OH(res. 3)⋯OH(res. 4) | 2.054 | 3.030 | 174.4 |
| OH(res. 6)⋯OC(res. 5) | 1.702 | 2.679 | 164.7 | |
| CO(res. 2)⋯HN(res. 5) | 2.000 | 2.806 | 134.1 | |
| HN(res. 5)⋯CO(res. 1) | 1.773 | 2.760 | 159.4 |
The CuL species deprotonates with pKa 7.65 forming a CuH−1L complex (Fig. 2 and Table 1). This value corresponds to the removal of a proton from the second amide group and suggests its involvement in the coordination process.42 This is supported by the spectroscopic data analysis. Spectral parameters are characteristic for the system with three nitrogen donors bound to the Cu(II) ion.30 Both UV-Vis and CD spectra reveal the shift of the d–d transition band towards shorter wavelengths (λ = 585 and 629 nm, respectively). In parallel, the EPR spectra show an increase of the hyperfine splitting constant with a simultaneous decrease of the g∥ factor (A∥ = 185 G, g∥ = 2.24). At pH 8.0, where CuH−1L is dominating, proton paramagnetic relaxation enhancements (Table 3) fully confirm that the coordination of metal ions is accomplished by one deprotonated β-amino group (Nβ res. 1) and two amide groups (Nβ res. 2 and Nα res. 6), as shown by the circles in Fig. 1. In addition to the high values of R1p measured for β-CH of residue 1 and β-CH2 of residue 2 (like in CuL), we also obtained a value of R1p of the same order of magnitude for the α-CH of residue 6. After the calculation of the proton paramagnetic spin–lattice relaxation rate using an exchange time τM = 5.51 ± 0.01 ms, we obtained the Cu–H distances for CuH−1L species (Table 3).
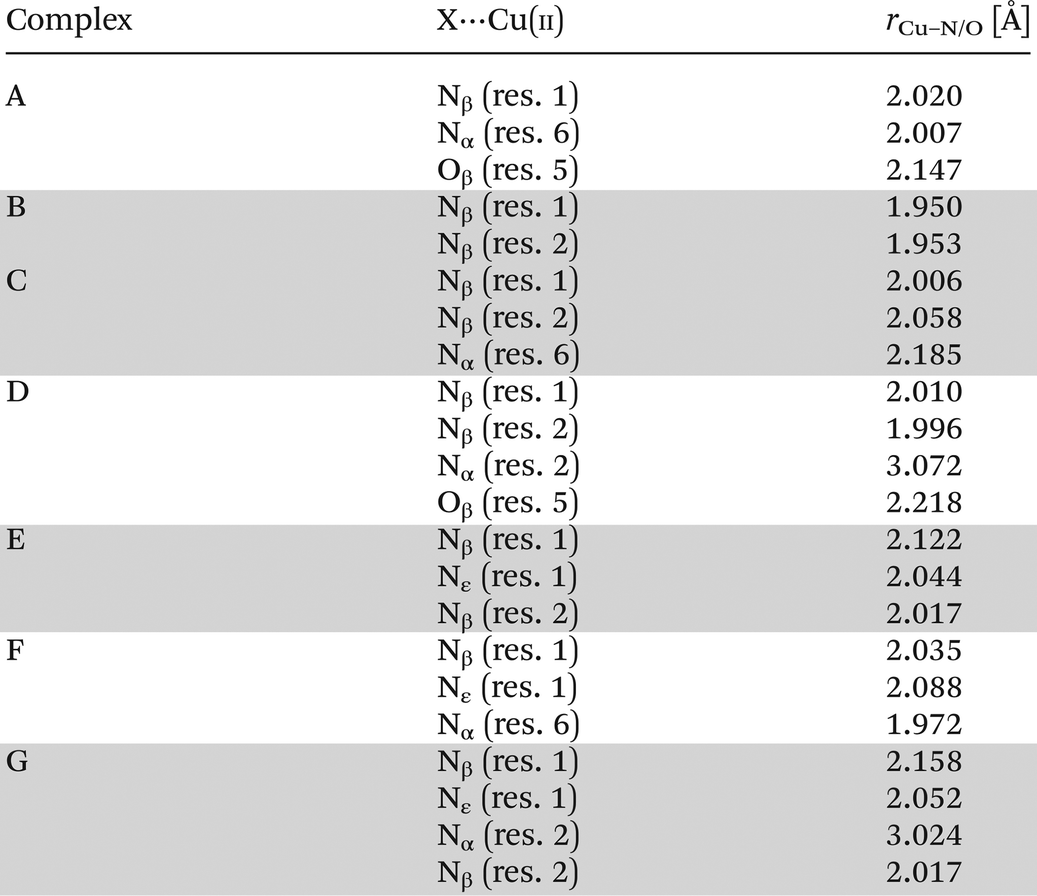
Two CuH−1L complexes were found by DFT calculations: complex C forms three metal–peptide coordination bonds and complex D – four metal–peptide coordination bonds (Fig. 4). Both CuH−1L complexes display similar stability – C is only 11.1 kcal mol−1 more stable than complex D. Also in this case we found only one complex where Cu–N interactions are supported by a weak Cu–O (2.218 Å) bond (complex D). A careful investigation of the metal–peptide interplay shows that Cu–N bond lengths are shorter in C than in the D complex, as shown in Table 5. In complex C nitrogens form three short and strong Cu–N interactions with distances between 2.006 and 2.185 Å, while in complex D – three interactions with the length between 1.996–3.072 Å and one Cu–O bond (2.218 Å). The bonds between nitrogen and metal ion determine the stability of the complex. A comparison of an average Cu–N bond of the C and D complexes (2.083 Å vs. 2.359 Å) explains the greater stability of complex C in comparison with complex D. Both complexes build a very similar HB network. However, complex C has more linear bonds (three out of six are close to 170°) and cooperative HBs that guarantee greater stabilization43–45 in comparison with complex D. In both cases, we found α-helical fragments, defined by one 4–13 type hydrogen bond CO(res. 3)⋯HN(res. 5) in complex C and CO(res. 1)⋯HN(res. 5) in complex D. All parameters of HBs for complexes C and D can be found in Table 5.
 | ||
| Fig. 4 Molecular model based on DFT calculation of CuH−1L complexes: C (left) and D (right). | ||
|
The binding of Cu(II) to the above mentioned donors can yield substantial tension in the CuH−1L complex. A similar process has been observed in the studies of the Cu(II)–capreomycin system. The tension in the latter complex resulted in the rearrangement of its structure and formation of another coordination bond via ε-NH2 together with the parallel breakage of the Cu(II)–N amide bond.15 An answer to the question whether viomycin binds metal ions in a similar way was provided by a comparison of the spectroscopic data. The formation of the CuH−2L species (the next {3N} complex) is accompanied by CD spectral changes (Table 1). The deprotonation of the next amino group of residue 1, together with the rearrangement of the donor set, generate the CuH−2L species (Fig. 2). NMR data (Table 3) clearly indicate that the amide group of residue 6 (Nα res. 6) is replaced in this case by ε-NH2 of residue 1 (Nε res. 1) in the donor set.
As a result of DFT calculations, we found complex E, where (Nβ res. 1), (Nε res. 1), (Nβ res. 2) nitrogens are involved in copper binding (Fig. 5). Another possibility of CuH−2L spatial construction is complex F (Fig. 5), where (Nα res. 6), (Nβ res. 1), (Nε res. 1) donors are engaged in the coordination. Despite the fact that complex F has an average metal–peptide bond shorter (2.032 Å) than complex E (average 2.061 Å; Table 5), complex E is more stable by 11.9 kcal mol−1; noteworthily such a small difference between average metal–peptide bonds (0.029 Å) fails here as a relative stability factor. Moreover, C and E {3N} species have two identical nitrogen donors (Nβ res. 2 and Nβ res. 1). The difference between these complexes lies only in the change of one metal connection: from (Nα res. 6) to (Nε res. 1). The transition from complex C to E is possible with a low energy barrier since ε-NH2 of res. 1 is the most flexible fragment of a viomycin molecule.
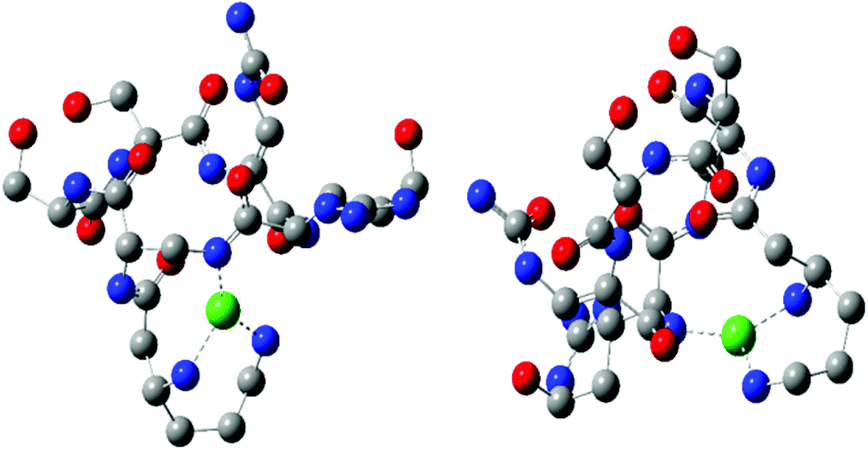 | ||
| Fig. 5 DFT optimized structure of CuH−2L complexes: E (left) and F (right). | ||
The next proton dissociation results in the formation of CuH−3L, predominant at pH 10.2. The spectroscopic parameters (Table 1) show the change in the equatorial surrounding of the central metal ion and their values admittedly indicate the involvement of four nitrogen donors in the binding.29 In turn, 1H-NMR proton paramagnetic relaxation rates allow us to suggest that the Cu(II) ion is bound to two amino- and two amide groups, respectively of residues 1 and 2 (Nβ and Nε res. 1; Nα and Nβ res. 2), (Table 3). Using the DFT calculations, we only found one thermodynamically stable {4N} complex G (CuH−3L, Fig. 6) which can be considered as a deprotonated complex E with one new metal–peptide interaction between Nα of res. 2 and a Cu(II) ion. Complex G forms a set of four HBs very similar to that of complex E (Table 4).
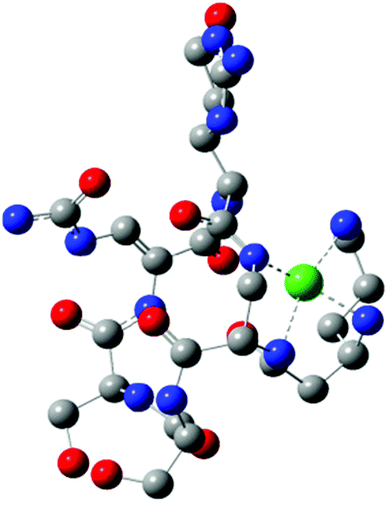 | ||
| Fig. 6 CuH−3L complex structure calculated at the DFT level of theory – complex G. | ||
A further increase of the solution pH value leads to the last proton dissociation and formation of the CuH−4L species. We did not observe any significant changes in the spectroscopic parameters, mainly UV-Vis and EPR, which allows us to assume that the deprotonation originates from the non-bonding moiety in the antibiotic molecule (guanidine group, res. 6). Only CD spectra show symmetry rising of the complex. This may be associated with the loss of the positive charge on the guanidine moiety. In consequence, it leads to a decrease of charges repelling between res. 6 and the Cu(II) ion. In the absence of metal ions the ligand deprotonation constant is outside the electrode detection range. In complexed viomycin this value is lower (pKa = 10.81), which suggests an increase of system acidity resulting from the neighboring group coordination process.46
Comparison of Cu(II) affinity of anti-tuberculosis agents
Viomycin, capreomycin and ethambutol are members of the anti-tuberculosis agent family. The first two peptide antibiotics are second-line anti-tuberculous drugs while ethambutol (acetylenic amino alcohol) is a first-line drug. It has been evidenced that the serum copper(II) pool is elevated during tuberculosis around 21%.47 Even more interesting is the fact that this pool may be decreased during treatment and return to normal levels. One of the possible explanations is that anti-tuberculosis agents may chelate Cu(II) ions and influence their homeostasis.48 Therefore, it was reasonable to compare the strength of copper(II) binding by the three aforementioned anti-tuberculous drugs.What is apparent in the distribution curves in Fig. 7 is that metal ions are most effectively bound by viomycin. At physiological pH, up to 70% of their pool is bound by the antibiotic, and the remaining 30% by capreomycin. In contrast, ethambutol which is considered as an effective chelator of these ions, which affect its homeostasis in the human body, has no effect in this system (binding less than 1‰ of Cu(II) ions). It can be assumed that treatment with capreomycin and, in particular, viomycin, may cause a faster return to the physiological level of the Cu(II) ion concentration, than in the case of ethambutol. This can entail not only the desired effects but also disturb copper homeostasis. This may be particularly dangerous during a long-term use of viomycin and may be responsible for its side effects.
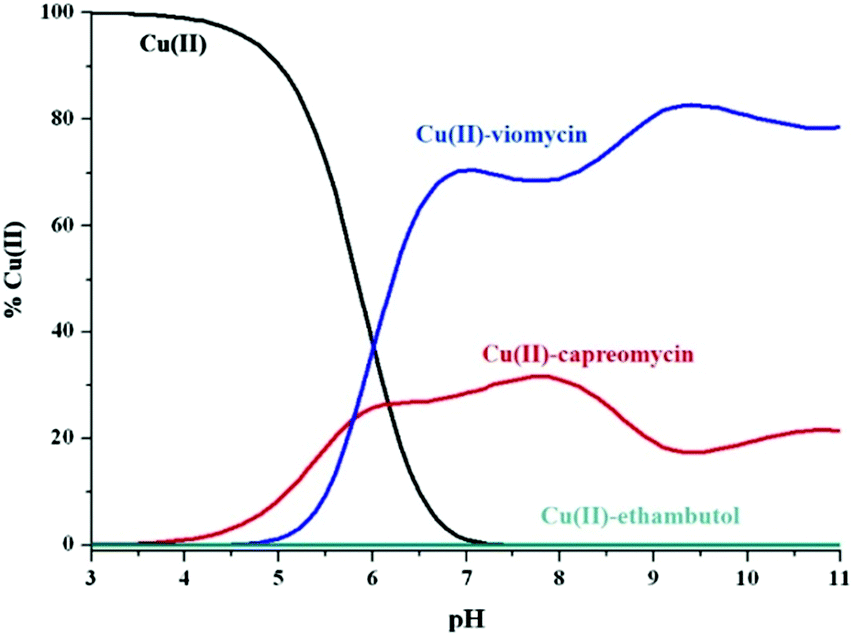 | ||
| Fig. 7 The competitive diagram of copper(II) speciation among viomycin, capreomycin and ethambutol with molar ratios 1:1.1, [Cu(II)] = 1 mM. | ||
Plasmid DNA damage by Cu–viomycin complexes
The type of interactions between Cu(II)–antibiotic complexes and DNA is difficult to predict. Such species may behave differently, exhibiting similar nicking properties as uncomplexed metal ions,49 drastically enhancing this process as in the case of e.g. kanamycin A50 and capreomycin or even inhibiting damage as observed in the case of the blasticidin S complex.51 Despite several similarities shared with capreomycin, viomycin binds Cu(II) ions in a quite distinct manner and with a much higher stability. Of particular interest is therefore to verify whether these differences have any influence on the DNA degradation process.In the first experiment, the interaction of the complex as well as its components on the plasmid DNA was investigated. All the ingredients were added to the DNA samples, accompanied or not by hydrogen peroxide. In the presence of a metal ion or its complex, H2O2 is the source of reactive oxygen species. Its activation by a metallic medium may testify to the pro-oxidative properties of the studied substance. The results presented in Fig. 8 clearly show that at the H2O2 concentration of 50 μM (Fig. 8a) or 25 μM (Fig. 8b), the Cu(II)–viomycin complex (odd lanes) is more aggressive against DNA than uncomplexed metal ions (even lanes). This is confirmed by complete plasmid destruction (lanes 3 and 5) or the presence of considerable amounts of the linear form III (lanes 7, 9, and 11). This form occurs as a result of the double strand scissions within the sugar-phosphate backbone. At the lower reagent concentrations (Fig. 8b, lanes 6–11), the difference between the plasmid destruction pattern for the complex and metal ions is insignificant. The most unexpected result is that at 500 μM (lane 12) free viomycin induces total DNA degradation, similarly to the complex at the same concentration (lanes 3 and 5).
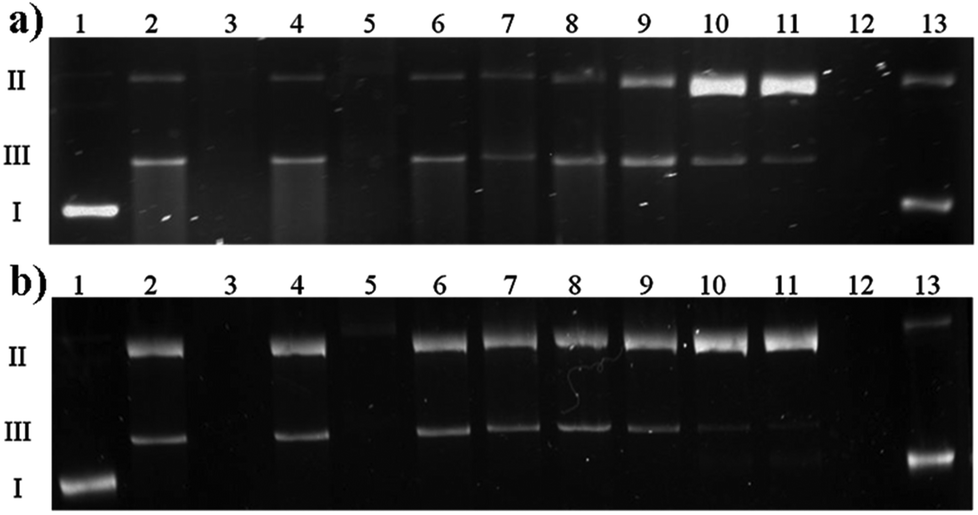 | ||
| Fig. 8 Comparison of interaction of uncomplexed Cu(II) ions (even lanes) and the Cu(II)–viomycin (odd lanes) on plasmid DNA in the presence of H2O2 (a) 50 μM, (b) 25 μM. Lane 1, plasmid; lane 2, plasmid + 500 μM Cu(II) + H2O2; lane 3, plasmid + 500 μM complex + H2O2; lane 4, plasmid + 250 μM Cu(II) + H2O2; lane 5, plasmid + 250 μM complex + H2O2; lane 6, plasmid + 100 μM Cu(II) + H2O2; lane 7, plasmid + 100 μM complex + H2O2; lane 8, plasmid + 50 μM Cu(II) + H2O2; lane 9, plasmid + 50 μM complex + H2O2; lane 10, plasmid + 10 μM Cu(II) + H2O2; lane 11, plasmid + 10 μM complex + H2O2, lane 12, plasmid + 500 μM viomycin + H2O2, lane 13, plasmid + 10 μM viomycin + H2O2. | ||
The data from the previous experiment prompted us to more thoroughly investigate the activity of viomycin alone. Results depicted in Fig. 9 show that the substantial extent of plasmid degradation is observed at higher antibiotic concentrations (lanes 2 and 3). It can be concluded that the genetic material damage is not associated with oxidizing conditions (a similar experiment in the presence of 25 μM H2O2, data not shown), but it is an unusual feature of the studied antibiotic. Additionally, pre-incubation of a viomycin solution under conditions where a majority of the protein DNases undergo deactivation (5 min, 100 °C)52 did not influence its ability to destroy DNA (data not shown).
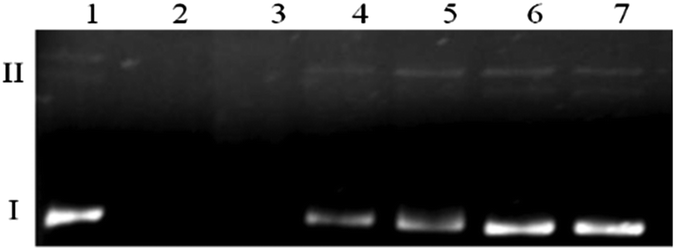 | ||
| Fig. 9 The impact of viomycin on plasmid DNA. Lane 1, plasmid; lane 2, plasmid + 500 μM viomycin; lane 3, plasmid + 250 μM viomycin; lane 4, plasmid + 100 μM viomycin; lane 5, plasmid + 50 μM viomycin; lane 6, plasmid + 10 μM viomycin; lane 7, plasmid + 5 μM viomycin. | ||
A direct comparison of the complex influence on DNA both in the presence and absence of H2O2 was tested. Fig. 10 shows that in the absence of an oxidizing agent (lanes 2–7) the result is quite analogous to the one presented in Fig. 9. Viomycin either with or without Cu(II) ion generates complete plasmid degradation, single-strand nicks or DNA unwinding, which is confirmed by an increase of the form II amount. When accompanied by H2O2, no covalently closed circular form (form I) remains in the solution and the plasmid is converted to the relaxed/nicked form II or linear form III (lanes 8–13).
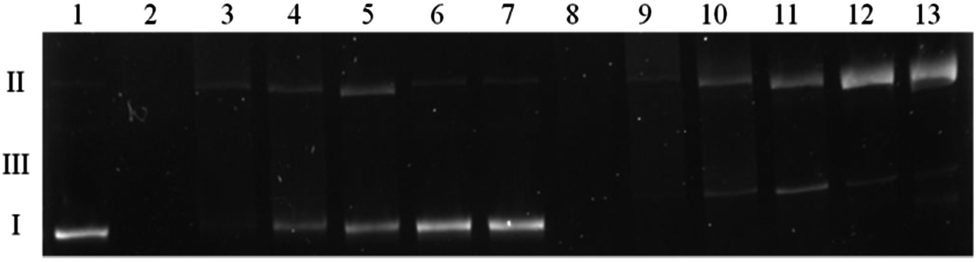 | ||
| Fig. 10 A comparison of the complex influence on plasmid DNA in the absence and presence of 25 μM H2O2. Lane 1, plasmid; lane 2, plasmid + 500 μM complex; lane 3, plasmid + 250 μM complex; lane 4, plasmid + 100 μM complex; lane 5, plasmid + 50 μM complex; lane 6, plasmid + 10 μM complex; lane 7, plasmid + 5 μM complex; lane 8, plasmid + 500 μM complex + H2O2; lane 9, plasmid + 250 μM complex + H2O2; lane 10, plasmid + 100 μM complex + H2O2; lane 11, plasmid + 50 μM complex + H2O2; lane 12, plasmid + 10 μM complex + H2O2; lane 13, plasmid + 5 μM complex + H2O2. | ||
Our observations show that the degradation of DNA by viomycin occurs with a relatively low specificity and can be carried out without the presence of transition metal ions. This suggests that the process does not take place via the free radical mechanism, but rather via the hydrolytic one (similarly to the action of enzymes).53,54 Compounds with the ability to degrade double-stranded DNA have already been used in cancer treatment.53 Therefore, there is a possibility that viomycin may also be used to this end, which, however, requires numerous further experiments.
The impact of viomycin and the Cu(II)–viomycin complex on the antigenomic delta ribozyme catalytic activity
In order to study the impact of viomycin and of the Cu(II)–viomycin complex on the delta ribozyme catalytic activity kinetic studies were carried out in the presence of 10 mM Mg(II) ions at the optimal pH of 7.5, by varying the antibiotic and complex concentration (Fig. 11). In the presence of 0.2 mM viomycin, a three-fold increase of the ribozyme activity was observed, as compared to the control reaction, without the antibiotic. However, at a higher concentration, in the range of 0.4–1 mM, a strong inhibition of the cleavage reaction occurred. The established dependence differs from that determined previously for another peptide antibiotic – capreomycin.24 In that case the cleavage reaction was stimulated at the antibiotic concentration in the range of 0.2 to 0.75 mM with the highest stimulation occurring at 0.4 mM capreomycin. At higher antibiotic concentrations, 0.8 and 1 mM, the cleavage reaction was inhibited.24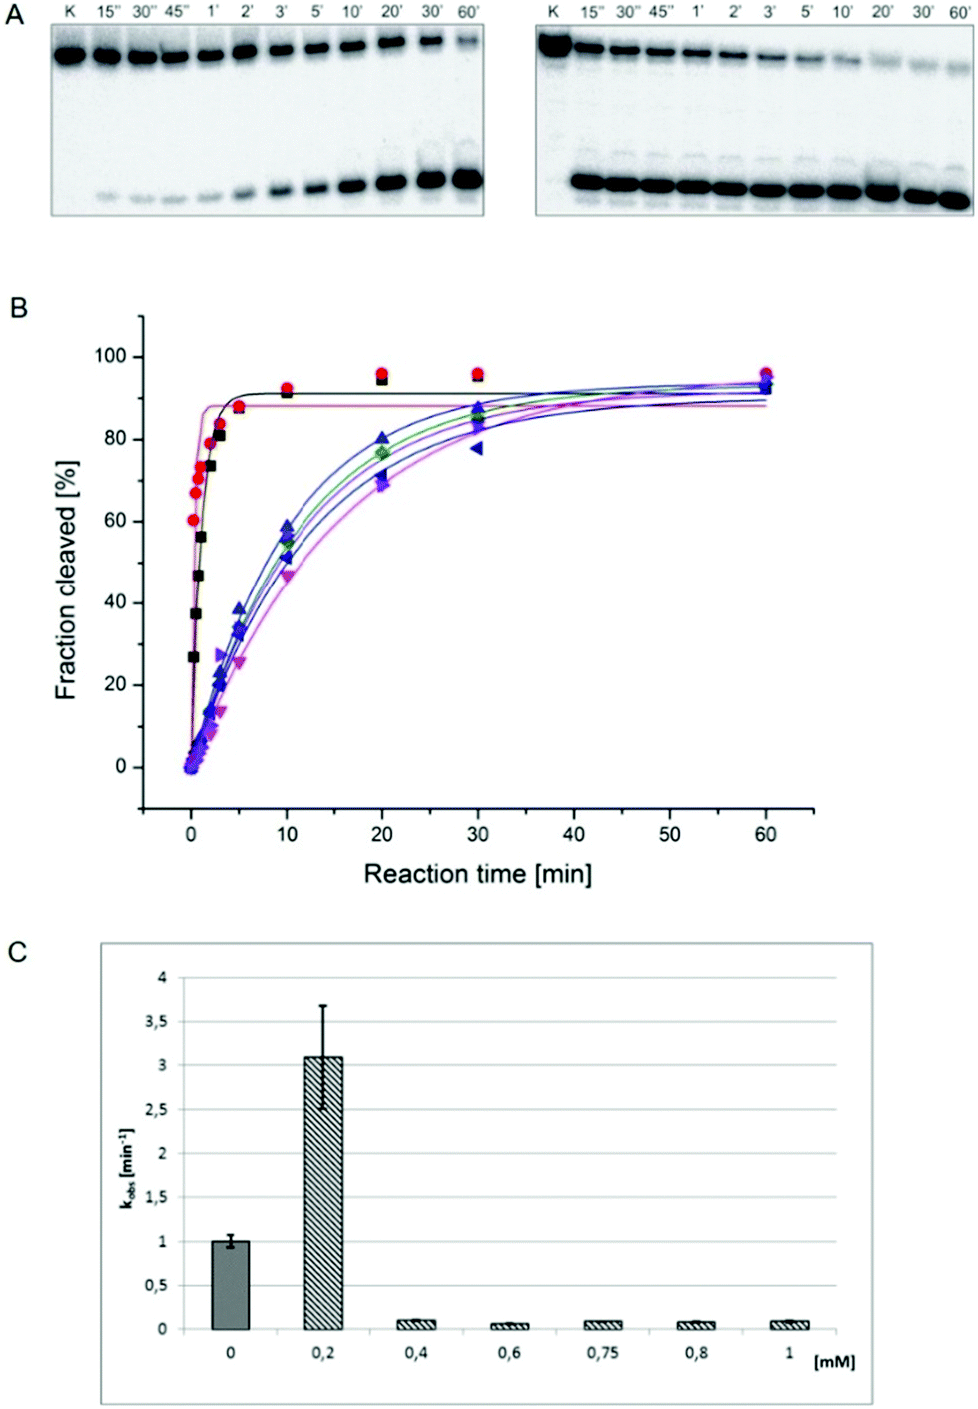 | ||
Fig. 11 (A) Autoradiograms of the antigenomic delta ribozyme cleavage reaction kinetics carried out in the presence of 0.2 mM (left) and 1 mM (right) viomycin concentration. Reactions were induced by 10 mM Mg(II) ions. Reaction conditions: buffer 50 mM Tris-HCl pH 7.5, temp. 37 °C, time 0.25–60 minutes. K-control lanes; (B) cleavage kinetics of the delta ribozyme in the absence (■) and presence of 0.2 mM ( ), 0.4 mM ( ), 0.4 mM ( ), 0.6 mM ( ), 0.6 mM ( ), 0.75 mM ( ), 0.75 mM ( ), 0.8 mM ( ), 0.8 mM ( ), and 1 mM ( ), and 1 mM ( ) viomycin concentration; (C) dependence of the cleavage rate constant kobs on the concentration of viomycin. ) viomycin concentration; (C) dependence of the cleavage rate constant kobs on the concentration of viomycin. | ||
The impact of the Cu(II)–viomycin complex on the delta ribozyme was similar to that observed with Cu(II)–capreomycin. A slight inhibition of ribozyme catalysis occurred in the presence of a 0.05 mM Cu(II)–viomycin complex (Fig. 12). At 0.1 mM and 0.2 mM concentrations of the complex, the cleavage reaction was stimulated, and the reaction rate constant kobs was doubled at the 0.2 mM Cu(II)–viomycin complex. However, at a 0.5 mM concentration of the complex the ribozyme cleavage reaction was strongly inhibited.
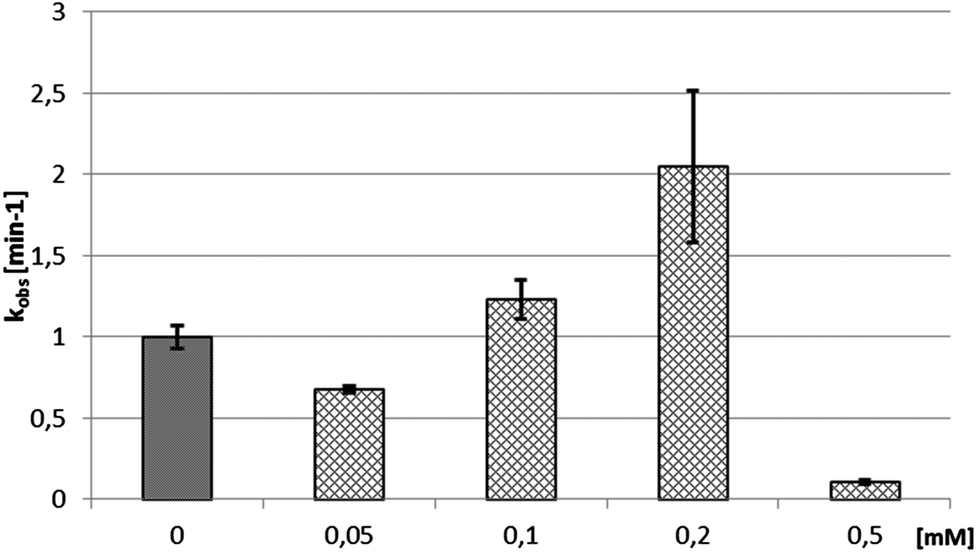 | ||
| Fig. 12 Dependence of the cleavage rate constant kobs for the delta ribozyme on the concentration of Cu(II)–viomycin complex. | ||
pH dependence of ribozyme cleavage rate upon addition of viomycin and its complex
We examined the impact of pH on the ability of viomycin and Cu(II)–viomycin to modulate the catalytic activity of delta ribozyme (Fig. 13). At pH 5.5 the cleavage rate constant kobs was 0.2 min−1 for the control reaction as well as for the reaction occurring in the presence of a 0.05 mM Cu(II)–viomycin complex (Fig. 13). Unexpectedly, an addition of 0.2 mM viomycin strongly inhibited the ribozyme activity. At pH 6.5 the kobs value was approx. 0.5 min−1 for the control reaction and this value was nearly identical to that determined for the complex. However, for the free antibiotic, the reaction was stimulated almost four-fold as compared to the reaction with no antibiotic added. At pH 7.5 the kobs value of the control ribozyme cleavage reaction amounted to 1 min−1. In the presence of viomycin a strong three-fold stimulation of the ribozyme activity was observed while the complex slightly inhibited catalysis.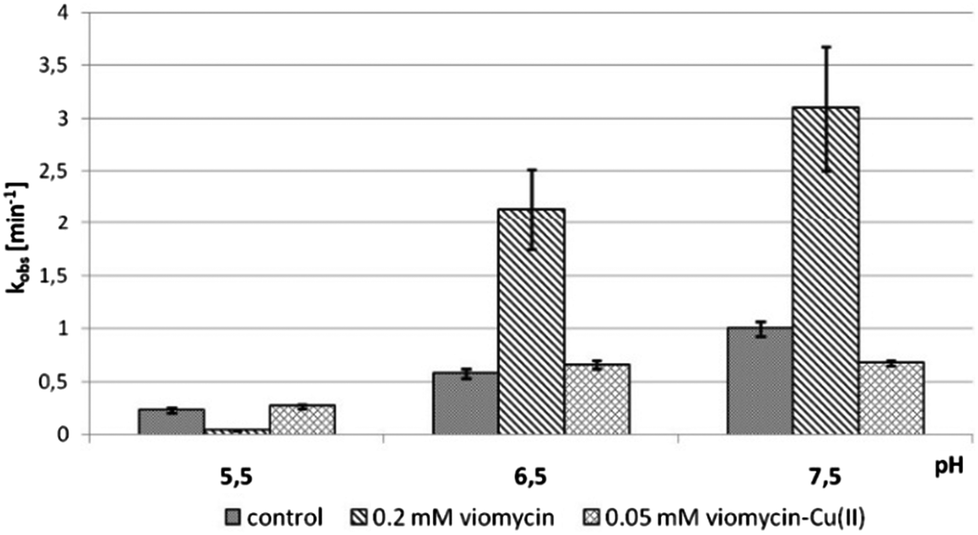 | ||
| Fig. 13 Effect of pH on the cleavage rate constant kobs for the delta ribozyme with added 0.2 mM viomycin and 0.05 mM Cu(II)–viomycin. | ||
Comparing the impact of viomycin and capreomycin on the delta ribozyme cleavage occurring at different pH, substantial differences were noted (Fig. 13). Most importantly, the Cu(II)–capreomycin complex at pH 5.5 and 6.5 inhibits the ribozyme cleavage almost completely,24 while the Cu(II)–viomycin complex has no impact on the reaction under these conditions. Besides, at pH 7.5, viomycin stimulates catalysis two-fold better than capreomycin.
The enhancement of the catalytic activity of delta ribozyme observed in the presence of viomycin or its complex may be explained in two ways. The antibiotics may improve annealing of the oligonucleotide substrate to the ribozyme component acting in trans, or participate in structural rearrangements leading to the formation of more reactive forms of the ribozyme. Both mechanisms have been earlier suggested to explain the activity of VS ribozyme in the presence of viomycin,23 and the first mechanism was proposed to be crucial. Likely, this mechanism also operates in the case of trans-acting delta ribozyme used in our study. Interestingly, for cis-acting variants their cleavage activity was inhibited by 50% in the presence of 0.035 mM and 0.1 mM viomycin for the genomic and antigenomic variant, respectively.22
Our analysis of the protonation schemes of capreomycin and viomycin revealed four and three protonation sites in these antibiotics, respectively. Unlike capreomycin, viomycin has no protonation site with pKa 6.23 which is attributed to the primary amino group of the α,β-diaminopropionic acid residue.15 This group does not seem to take part in the modulation of the delta ribozyme activity since a similar impact of viomycin and capreomycin on this ribozyme was observed.
We have proved that both antibiotics are able to form stable complexes with differently protonated species. Since the Cu(II)–capreomycin complex strongly inhibits the catalytic activity of the delta ribozyme only at pH 5.5 and 6.5 we suggest that the first forming CuH3L species is responsible for this inhibition.15,24 On the other hand, the Cu(II)–viomycin complex does not influence ribozyme catalysis neither at pH 5.5 nor at pH 6.5 suggesting that the complex of the CuL type, which occurs in the solution as the first one, is unable to modulate the delta ribozyme activity (Fig. 13).
Computer modeling of the viomycin–delta ribozyme interactions
We used the molecular modelling approach to determine interactions of viomycin with the delta ribozyme structure. Since previous data indicate a high structural similarity of both genomic and antigenomic delta ribozymes in solution55 the solved crystal structure of the genomic variant was applied in these studies. Molecular modeling indicates two different locations of viomycin binding sites to the ribozyme. The first site is positioned between the P2 stem and L3 loop (Fig. 14A). In the second one, viomycin binds inside a deep cavity formed by P1, P2, and P3 stems (Fig. 14B). Very similar binding sites are suggested for the Cu(II)–viomycin complex. For better visualization of the second site, Fig. 14C shows the molecular surface of the ribozyme as seen from the top with the Cu(II)–viomycin complex embedded inside the cavity. The cavity has the dimensions of approx. 10 × 20 Å and it is large enough to accommodate viomycin or its Cu(II) complex. We suggest that other peptide antibiotics also of a similar size, such as capreomycin, as well as their Cu(II) complexes can be docked to this site inside the ribozyme structure.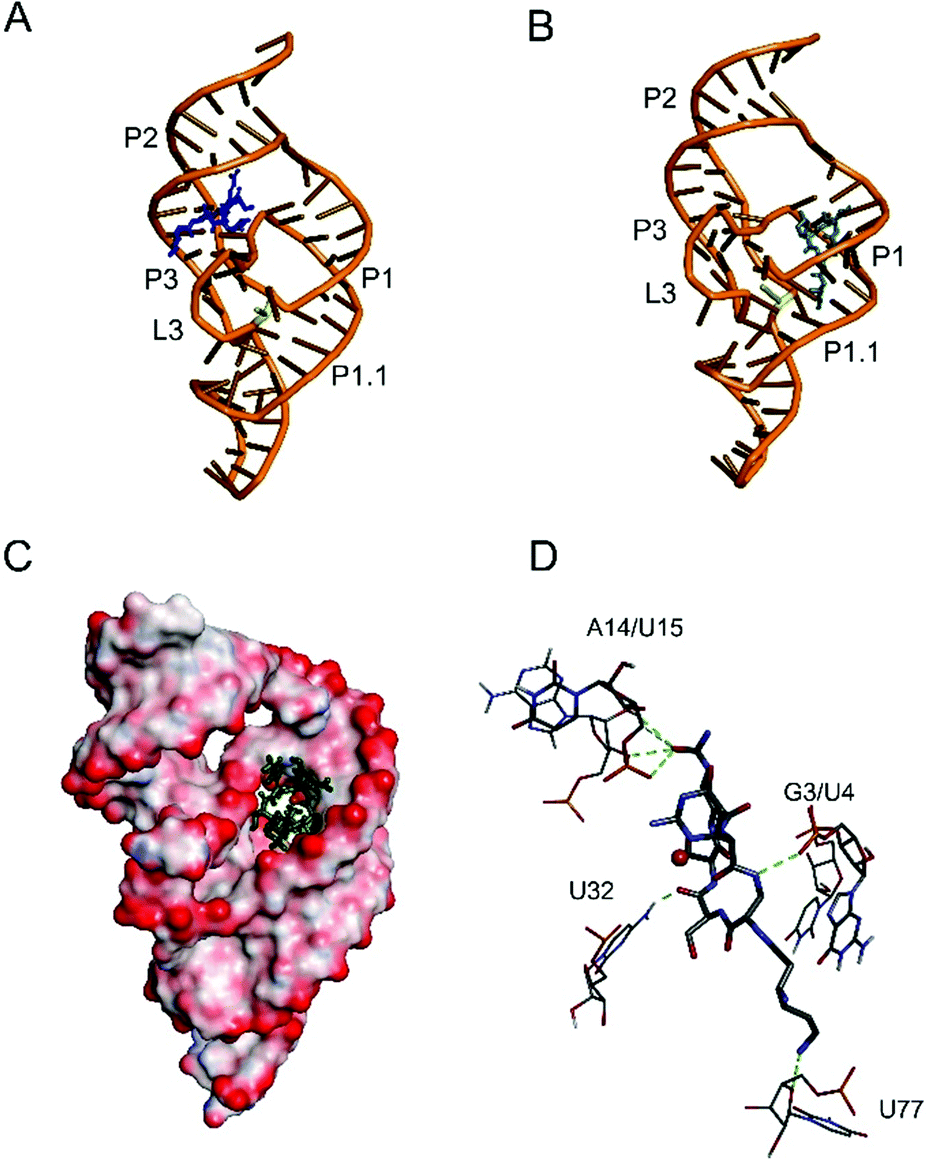 | ||
| Fig. 14 Computer modeling of the interactions of viomycin (A, B) and Cu(II)–viomycin complex (C, D) with the antigenomic delta ribozyme. Two predicted locations of viomycin (blue) inside the ribozyme structure are shown (A, B). Panel C presents the location of Cu(II)–viomycin complex inside the cavity formed inside the ribozyme tertiary structure (view from the top of ribozyme structure). Panel D shows detailed interactions of the complex with nucleotides located inside the cavity. | ||
Computer modeling suggests that the Cu(II)–viomycin complex interacts with A14/U15 in P2 and G3/U4 in P1 stems (Fig. 14D). In addition, viomycin forms hydrogen bonds with U32 in stem P3. Interestingly, viomycin also interacts with U77, immediately close to C76, which is involved in catalysis. Previous in vitro selection experiments have shown that U32 which is involved in the pseudoknot formation, is very conservative and occurs in all active antigenomic delta ribozyme variants.56,57 Presumably, the pseudoknot RNA structure is necessary for viomycin binding.
Earlier, an in vitro selection approach has been used to obtain aptamers which specifically bind viomycin.58 Mapping of aptamers’ structure revealed that the viomycin binding site forms a stem-loop motif engaged in long-range interactions and forming a pseudoknot. The antibiotic interacts with purine bases and the phosphate backbone. However, for efficient viomycin binding the pseudoknot aptamer structure is necessary. Similarly, the compact structure of the genomic and antigenomic delta ribozymes contains a double pseudoknot55 which seems to be involved in the formation of the tuberactinomycin binding site. Recently, it has been shown that delta-like ribozymes occur not only in the HDV virus but also in many other eukaryotes and prokaryotes including H. sapiens, mouse M. musculus, mosquito A. gambiae, fruit fly D melanogaster, sea urchin S. purpuratus, nematode C. japonica and bacteria F. prausnitzii.55,59,60 These ribozyme structures are potential targets for antibiotics, including the studied tuberactinomycins, viomycin and capreomycin.
Experimental section
Materials
Viomycin disulfate was purchased from TOCRIS Bioscience and used without further purification. Other chemicals were from Sigma-Aldrich.Potentiometric measurements
Potentiometric titrations of viomycin and its complexes with Cu(II) in aqueous solution in the presence of 0.1 M KCl were performed at 25 °C under an argon atmosphere using pH-metric titrations (Metrohm, 905 Titrando). The CO2-free NaOH solution at a concentration of 0.1033 M was used as a titrant. The samples were titrated in the pH region 2.5–10.5 applying a total volume of 1.5 mL. Changes in pH were monitored with a combined glass–Ag/AgCl electrode (Metrohm, Biotrode) calibrated daily in concentration using HCl titrations.61 The ligand concentration was 1 mM and metal-to-ligand molar ratios were 1:1.1, 1:2 and 2:1. These data were analyzed using the SUPERQUAD program.62 Standard deviations (σ values) quoted were computed by SUPERQUAD and refer to random errors only. They are, however, a good indication of the importance of the particular species involved in the equilibria.
EPR
Spectra were recorded on a Bruker ELEXSYS E500 CW-EPR spectrometer equipped with an NMR teslameter (ER 036TM) and a frequency counter at X-band frequency and at 77 K. The concentrations of the complexes were 1 mM. The solutions were prepared using water and ethylene glycol (30 v/v%) as a cryoprotectant. The EPR parameters were calculated for the spectra obtained at the maximum concentration of the particular species for which well-resolved components were observed.UV-vis
Absorption spectra were recorded on an Agilent Cary 60 UV-vis spectrophotometer in the 900–200 nm range, using 1 cm and 0.1 cm cuvettes. The concentrations and metal-to-ligand molar ratios were similar to those applied in potentiometric studies. The values of the ε parameter were calculated at the maximum concentration of the particular species obtained from potentiometric curves.Circular dichroism
CD spectra were recorded at 25 °C on a Jasco J-715 spectropolarimeter over a range of 800–220 nm, using 1 cm and 0.1 cm cuvettes. Solutions were of similar concentrations to those used in potentiometric analysis. Spectra are expressed in terms of Δε = εL − εR, where: εL and εR are molar absorption coefficients for left and right circularly polarized light, respectively. The values of Δε were calculated at the maximum concentration of the particular species obtained from potentiometric data.NMR spectroscopy
Viomycin solutions, at a concentration of 4.0 mM, were prepared in deuterium oxide/water mixed solvent, adjusted to a 0.1 M ionic strength (KCl) and carefully deoxygenated. The desired concentration of copper ions was achieved by using a stock solution of Cu(NO3)2 in deuterium oxide. The pH was adjusted with either DCl or NaOD. All solvents and reagents were of analytical grade and were purchased from commercial sources.The 1H NMR experiments were performed on a 14.1 T Bruker Avance 600 MHz spectrometer with a 5 mm SEI probe of NMR Center – University of Siena. All NMR experiments were recorded at a controlled temperature of 298 ± 0.1 K. Deuterated trimethylsilyl-2,2,3,3-tetradeuteropropionic acid (TSP-d4) was used as an internal reference standard and chemical shifts were reported in ppm.
1H-NMR spectra were acquired with a FID (free induction decay) composed of 32768 points over a spectral width of 6000 Hz, a 90° pulse of 7.5 μs, relaxation delay of 2.0 s and 64 transients. Suppression of the residual water signal was achieved by a pulse gradient sequence.
Proton resonance assignment was obtained with COSY (Correlation Spectroscopy), TOCSY (Total Correlation Spectroscopy) and NOESY (Nuclear Overhauser Effect Spectroscopy). An MLEV-17 pulse sequence, with a mixing time of 75 ms, was used for the TOCSY experiments. NOESY spectra were acquired at different values of mixing time to optimize the best one (100 ms). All experiments were processed on a Silicon Graphics O2 workstation by using XWINNMR 3.6 software.
Proton spin–lattice relaxation rates (R1 = 1/T1) were measured with the inversion recovery pulse sequence or with a combination of this with 2D TOCSY to gain resolution and overcome severe overlapping problems of viomycin 1H-NMR spectra. This was obtained by introducing a 1H 180° pulse followed by a variable delay in front of the TOCSY sequence. Relaxation rates were calculated with regression analysis of the initial recovery curves of longitudinal magnetization components, leading to errors in the range of ±3%.
 | (1) |
 | (2) |
 | (3) |
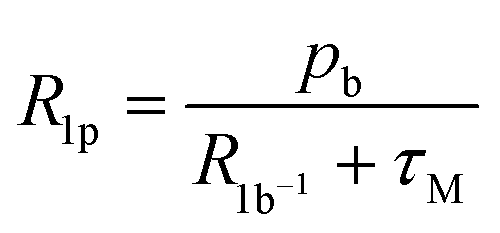
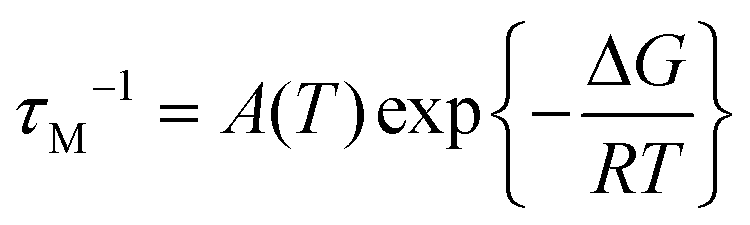
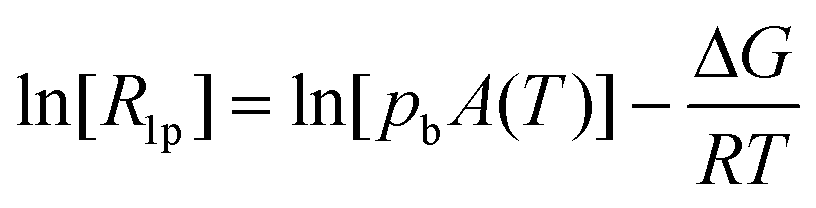
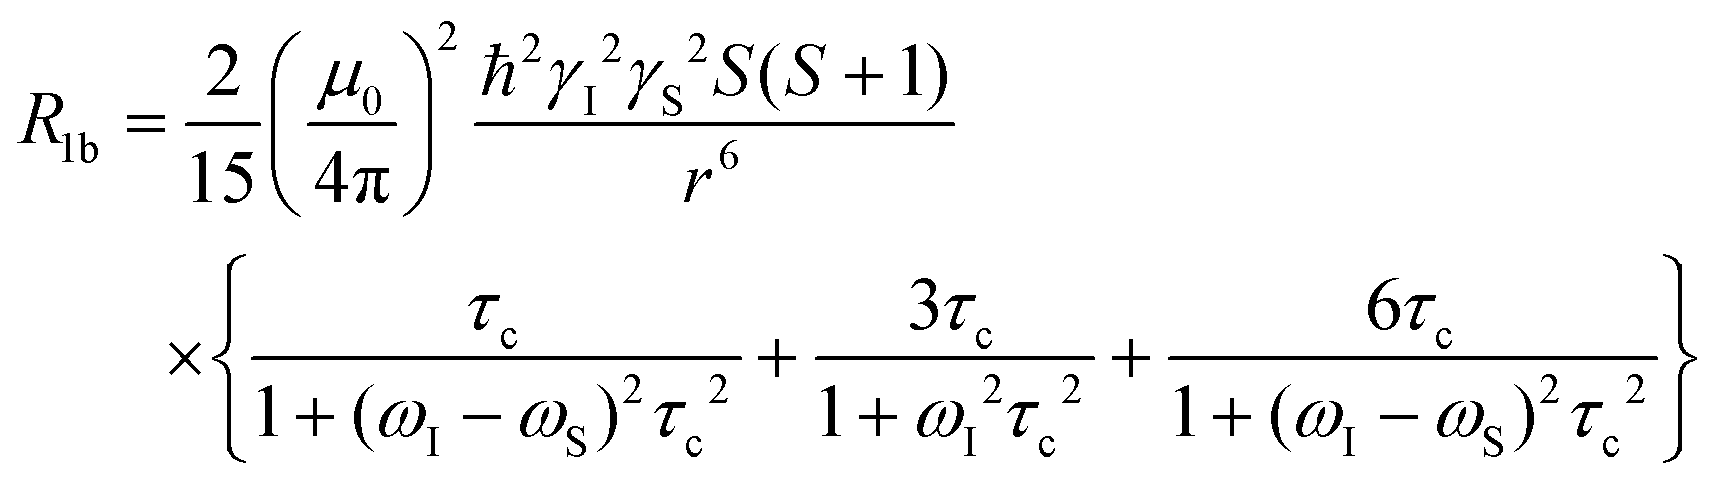
Scaling all R1p values with such value of τM, and assuming pb = Cmetal/Cligand, allows us to obtain the corresponding R1b values to be used in Solomon's equation to calculate Cu–H distances:63–65
 | (4) |
Computational details
Molecular orbital studies on a Cu(II) ion 1:1 complex with viomycin have been done on the DFT level of theory with a polarizable continuum model (PCM). All calculations were performed with Gaussian 0967 suite of programs using the M06-2X68 hybrid functional and 6-31G(d) basis set, and solvent effects have been introduced by using the self-consistent reaction field (SCRF) method based on PCM.69 No imaginary frequencies were found in any complex.
The Accelrys Discovery Studio 4.1 site of programs (Accelrys Software Inc., San Diego CA) was used to build the structure of the antigenomic delta ribozyme by homology modeling based on the previously determined crystal structure of the genomic variant (PDB ID 1CX0) as described previously.70 Molecular docking of viomycin and its complex with Cu(II) ions was performed with CDOCKER71 in the regions defined by analysis of the electrostatic potential of the surface of the ribozyme molecule.
DNA strand break analysis
The ability to induce strand breaks by viomycin, its Cu(II) complex or Cu(II) ions alone (control) in the presence and absence of H2O2 was tested with the pBluescriptSK+ plasmid by means of agarose gel electrophoresis. The buffered samples (phosphate buffer, pH 7.5) contained combinations of DNA (25 μg mL−1) and the components of the investigated systems (metal ion and/or antibiotic, and H2O2). Concentrations of each substance are given in the figure legends. After 1 h of incubation at 37 °C, the reaction mixtures (20 μL) were mixed with 4 μL of loading buffer (bromophenol blue in 30% glycerol) and loaded on 1% agarose gels, containing ethidium bromide, in TBE buffer (90 mM Tris-borate, pH 8.0; 20 mM EDTA). Gel electrophoresis was performed at a constant voltage of 4 V cm−1 for 60 min. The gels were photographed and processed with a Digital Imaging System (Syngen Biotech, Wrocław, Poland).Antigenomic delta ribozyme cleavage reaction
The delta ribozyme was prepared by in vitro transcription70 and the 20-mer oligoribonucleotide substrate 5′CUUUCCUCUCGGGUCGGCA3′ was purchased from Future Synthesis, Poznan, Poland. The oligoribonucleotide substrate was labeled at its 5′-end using [γ-32P]ATP and polynucleotide kinase using standard procedures. The ribozyme and substrate oligomers were purified on denaturing polyacrylamide gels, localized by UV shadowing or phosphorimaging, eluted with 0.3 M sodium acetate pH 5.5, precipitated with ethanol, recovered by centrifugation and dissolved in sterile water containing 0.1 mM EDTA. The trans-acting delta ribozyme was prepared by mixing the 5′-end-32P-labeled oligoribonucleotide substrate (∼50000 cpm, 0.1 pmol) with 10 pmoles of delta ribozyme in one of the following reaction buffers: 50 mM MES-NaOH pH 5.5, 50 mM MES-NaOH pH 6.5 or 50 mM Tris-HCl pH 7.5 to obtain the final RNA concentration of 1 μM and 10 nM for the ribozyme and substrate components, respectively. The mixture was subjected to a denaturation–renaturation procedure by incubating at 100 °C for 1 min, at 0 °C for 5 min, and under these conditions all the substrate oligonucleotides were bound in substrate–ribozyme complexes. Then viomycin or its complex was added to appropriate concentrations and the mixture was incubated for an additional 5 min at 37 °C. The ribozyme cleavage reaction was initiated by adding magnesium chloride to the final 10 mM concentration and the reaction proceeded at 37 °C. Aliquots were removed at specified time points and quenched with an equal volume of a 20 mM EDTA/7 M urea mixture. The cleavage products were separated by electrophoresis on 12% denaturing polyacrylamide gels. Finally, the gels were analyzed using phosphorimaging screens and a FLA-5100 image analyzer with MultiGauge software (FujiFilm). The fraction of the substrate cleaved was plotted versus time and fitted to a single exponential equation: [P]t = [EP](1 − e−kobst), where kobs is the first order constant and [P]t and [EP] are the fractions cleaved at time t and at the reaction end point, respectively.
Conclusions
Similarly to other peptide antibiotics, viomycin binds Cu(II) ions tightly and forms very stable {4N} complexes. Both experimental and calculation results show that depending on the conditions, diverse coordination modes and structures can be observed. Several functional groups within the drug molecule get involved into binding which is due to the unique structure of the antibiotic. The investigated complexes show a fringe of stabilizing interactions, however the leading role in metal binding is played by nitrogen donors that form short and strong interactions with metal ions. All investigated complexes display the presence of effective multi-binding sockets for the metal cation. The Cu(II)–viomycin complexes also have a rich network of hydrogen bonds that stabilize the complexes and are able to form short, helical fragments of peptide.Complexation of the Cu(II) ions is stronger in the case of viomycin than in the case of its very close analogue – capreomycin, which was calculated on the basis of their stability constants. The Cu(II) binding process may reflect the physiological reaction during tuberculosis, when the serum copper pool is elevated and drugs like viomycin may be administered. The studied complexes exhibit strong DNA degradation abilities. Although not specific, they may lead to the total DNA damage when accompanied by low concentrations of endogenous H2O2. Viomycin and its complex with Cu(II) ions modulate the functioning of the antigenomic delta ribozyme. Their impact, stimulatory or inhibitory, strongly depends on these compound concentrations and pH values. At pH 7.5, close to physiological conditions, they inhibit ribozyme catalysis at lower concentrations as compared to the earlier studied capreomycin system. Molecular modeling reveals two different binding sites of viomycin and its complex to the ribozyme. In one of these sites, viomycin binds in a deep cavity inside the ribozyme structure interacting with several nucleotides located in the vicinity. Likely, also other RNA molecules may bind tuberactinomycins in a similar way which may influence their biological properties. The data presented herein have a physiological significance since they may apply to the origins of the adverse effects that accompany tuberculosis treatment.
Acknowledgements
The research was supported by Wroclaw Research Center EIT+ under the project “Biotechnologies and Advanced Medical Technologies – BioMed” (POIG 01.01.02-02-003/08-00) financed from the European Regional Development Fund (Operational Programme Innovative Economy, 1.1.2) and by Wroclaw Centre of Biotechnology, programme The Leading National Research Centre (KNOW) for years 2014–2018.References
- B. Tessema, J. Beer, F. Emmrich, U. Sack and A. C. Rodloff, Int. J. Tuberc. Lung Dis., 2012, 16, 805 CrossRef CAS PubMed.
- P. Pantelidis, Respiration, 2005, 72, 347 CrossRef PubMed.
- C. C. Aldrich, H. I. Bosshoff and R. P. Remmel, Antitubercular agents, in Burger's Medicinal Chemistry, Drug Discovery and Development, vol. 7 Antiinfectives, ed. D. J. Abraham and D. P. Rotella, Wiley, New York, 7th edn, 2010, pp. 713–812 Search PubMed.
- World Health Organisation, Global tuberculosis report, 2014.
- S. Chawla, D. Garg, R. B. Jain, P. Khanna, S. Choudhary, S. Sahoo and I. Singh, Hum. Vaccines Immunother., 2014, 420 CrossRef PubMed.
- L. V. Sacks and R. E. Behrman, Tuberculosis, 2008, 88, S93 CrossRef CAS PubMed.
- M. Asif, Elixir Pharm., 2012, 53, 11774 Search PubMed.
- G. Mohan, S. Kulshreshtha and P. Sharma, Biol. Trace Elem. Res., 2006, 111, 63–69 CrossRef CAS PubMed.
- B. Benes, V. Spevackova, J. Smid, A. Batariova, M. Cejchanova and L. Zitkova, Cent. Eur. J. Public Health, 2005, 13, 202 CAS.
- P. A. Lopes, M. C. Santos, L. Vicente, M. O. Rodrigues, M. L. Pavao, J. Nève and A. M. Viegas-Crespo, Biol. Trace Elem. Res., 2004, 101, 1 CrossRef CAS PubMed.
- M. A. Nazari, F. Kobarfard, P. Tabarsi and J. Salamzadeh, Biol. Trace Elem. Res., 2009, 128, 161 CrossRef PubMed.
- A. Członkowska, T. Litwin, M. Karliński, K. Dziezyc, G. Chabik and M. Czerska, Eur. J. Neurol., 2014, 21, 599 CrossRef PubMed.
- M. Świątek, D. Valensin, C. Migliorini, E. Gaggelli, G. Valensin and M. Jeżowska-Bojczuk, Dalton Trans., 2005, 3808 RSC.
- M. Kucharczyk, M. Brzezowska, A. Maciąg, T. Lis and M. Jeżowska-Bojczuk, J. Inorg. Biochem., 2008, 102, 936 CrossRef CAS PubMed.
- K. Stokowa, W. Szczepanik, N. Gaggelli, E. Gaggelli, G. Valensin and M. Jeżowska-Bojczuk, J. Inorg. Biochem., 2012, 106, 111 CrossRef CAS PubMed.
- R. E. Stanley, G. Blaha, R. L. Grodzicki, M. D. Strickler and T. A. Steitz, Nat. Struct. Mol. Biol., 2010, 17, 289 CAS.
- L. Brandi, A. Fabbretti, M. Di Stefano, A. Lazzarini, M. Abbondi and C. O. Gualerzi, RNA, 2006, 12, 1262 CrossRef CAS PubMed.
- E. A. Felnagle, A. M. Podevels, J. J. Barkei and M. G. Thomas, ChemBioChem, 2001, 12, 1859 CrossRef PubMed.
- A. Yonath and A. Bashan, Annu. Rev. Microbiol., 2005, 58, 233 CrossRef PubMed.
- J. Modolell and D. Vazquez, Eur. J. Biochem., 1977, 81, 491 CrossRef CAS PubMed.
- H. Wank, J. Rogers, J. Davies and R. Schroeder, J. Mol. Biol., 1994, 236, 1001 CrossRef CAS PubMed.
- J. Rogers, A. H. Chang, U. Ahsen, R. Schroeder and J. Davies, J. Mol. Biol., 1996, 259, 916 CrossRef CAS PubMed.
- J. E. Olive, D. M. De Abreu, T. Rastogi, A. A. Andersen, A. K. Mittermaier, T. L. Beattie and R. A. Collins, EMBO J., 1995, 14, 3247 CAS.
- M. Szafraniec, K. Stokowa-Sołtys, J. Nagaj, A. Kasprowicz, J. Wrzesinski, M. Jeżowska-Bojczuk and J. Ciesiołka, Dalton Trans., 2012, 41, 9728 RSC.
- S. Vos, D. J. Berrisford and J. M. Avis, Biochemistry, 2002, 41, 5383 CrossRef CAS PubMed.
- B. Noszal, Acid–base properties of bioligands, in Biocoordination chemistry: coordination equilibra in biologically active system, ed. K. Burger, Ellis Horwood, Chichester, 1990, pp. 18–41 Search PubMed.
- D. Chen, J. Tanem and P. A. Frey, Biochim. Biophys. Acta, 2007, 1774, 297 CrossRef CAS PubMed.
- E. Gaggelli, N. Gaggelli, E. Molteni, G. Valensin, D. Balenci, M. Wrońska, W. Szczepanik, J. Nagaj, J. Skała and M. Jeżowska-Bojczuk, Dalton Trans., 2010, 39, 9830 RSC.
- J. Brasuń, C. Gabbiani, M. Ginanneschi, L. Messori, M. Orfei and J. Świątek-Kozłowska, J. Inorg. Biochem., 2004, 98, 2016 CrossRef PubMed.
- L. D. Pettit, J. E. Gregor and H. Kozłowski, in Perspectives in Bioinorganic Chemistry, ed. R. W. Hay, J. R. Dilworth and K. B. Nolan, JAI Press, London, 1991, vol. 1, pp. 1–41 Search PubMed.
- M. Wierzejewska and R. Wieczorek, Chem. Phys., 2003, 287, 169 CrossRef CAS.
- Z. Latajka, Z. Mielke, A. Olbert-Majkut, R. Wieczorek and K. G. Tokhadze, Phys. Chem. Chem. Phys., 1999, 1, 2441 RSC.
- E. Gumienna-Kontecka, G. Berthon, I. O. Fritsky, R. Wieczorek, Z. Latajka and H. Kozlowski, J. Chem. Soc., Dalton Trans., 2000, 4201 RSC.
- S. Yoo, A. Jun, Y.-W. Ju, D. Odkhuu, J. Hyodo, H. Y. Jeong, N. Park, J. Shin, T. Ishihara and G. Kim, Angew. Chem., Int. Ed., 2014, 53, 13131 CrossRef PubMed.
- C. Balachandra and N. K. Sharma, Tetrahedron, 2014, 70, 7464 CrossRef CAS.
- F. J. Melendez, A. Degollado, M. E. Castro, N. A. Caballero, J. A. Guevara-Garcia and T. Scior, Inorg. Chim. Acta, 2014, 420, 149 CrossRef CAS.
- Y. K. Kang, B. J. Byun and H. S. Park, Biopolymers, 2011, 95, 51 CrossRef CAS PubMed.
- D. Siodłak, A. Macedowska-Capiga, M. A. Broda, A. E. Kozioł and T. Lis, Biopolymers, 2012, 98, 466 CrossRef PubMed.
- M. A. Basharov, Eur. Biophys. J., 2012, 41, 53 CrossRef CAS PubMed.
- M. Remelli, F. Pontecchiani, E. Simonovsky, R. Wieczorek, N. Barbosa, M. Rowińska-Żyrek, S. Potocki, Y. Miller and H. Kozłowski, Dalton Trans., 2014, 43, 16680 RSC.
- J. Wątły, E. Simonovsky, R. Wieczorek, N. Barbosa, Y. Miller and H. Kozłowski, Inorg. Chem., 2014, 53, 6675 CrossRef PubMed.
- K. Stokowa-Sołtys, A. Kasprowicz, J. Wrzesiński, J. Ciesiołka, N. Gaggelli, E. Gaggelli, G. Valensin and M. Jeżowska-Bojczuk, J. Inorg. Biochem., 2015, 151, 67 CrossRef PubMed.
- C. Perez, D. P. Zaleski, N. A. Seifert, B. Temelso, G. C. Shields, Z. Kisiel and B. H. Pate, Angew. Chem., Int. Ed., 2014, 53, 14368 CrossRef CAS PubMed.
- H. Y. Zhuo, Q. Z. Li, W. Z. Li and J. B. Cheng, J. Chem. Phys., 2014, 141, 244305 CrossRef PubMed.
- C. Zhang, J. Hu, X. Li, Y. Wu and J. Han, J. Phys. Chem. A, 2014, 118, 12241 CrossRef CAS PubMed.
- H. Sigel, Pure Appl. Chem., 2006, 76, 1869 Search PubMed.
- G. Mohan, S. Kulshershtha and P. Sharma, Biol. Trace Elem. Res., 2006, 111, 63 CrossRef CAS PubMed.
- M. A. Nazari, F. Kobarfard, P. Tabarsi and J. Salamzadeh, Biol. Trace Elem. Res., 2009, 128, 161 CrossRef PubMed.
- J. Nagaj, R. Starosta, W. Szczepanik, M. Barys, P. Młynarz and M. Jeżowska-Bojczuk, J. Inorg. Biochem., 2012, 106, 23 CrossRef CAS PubMed.
- W. Szczepanik, E. Dworniczek, J. Ciesiołka, J. Wrzesiński, J. Skała and M. Jeżowska-Bojczuk, J. Inorg. Biochem., 2003, 94, 355 CrossRef CAS PubMed.
- K. Stokowa-Sołtys and M. Jeżowska-Bojczuk, J. Inorg. Biochem., 2013, 127, 73 CrossRef PubMed.
- A. Wilmes, D. Crean, S. Aydin, W. Pfaller, P. Jennings and M. O. Leonard, Toxicol. in Vitro, 2011, 25, 613 CrossRef CAS PubMed.
- M. Valko, M. Izakovic, M. Mazur, C. J. Rhodes and J. Telser, Mol. Cell. Biochem., 2004, 266, 37 CrossRef CAS PubMed.
- K. S. Gates, Chem. Res. Toxicol., 2009, 22, 1747 CrossRef CAS PubMed.
- N. Riccitelli and A. Luptak, HDV Family of Self-Cleaving Ribozymes, in Progress in Molecular Biology and Translational Science, ed. G. A. Soukup, Elsevier, USA, 2013, vol. 120, pp. 123–171 Search PubMed.
- M. Łęgiewicz, A. Wichłacz, B. Brzezicha and J. Ciesiołka, Nucleic Acids Res., 2006, 34, 1270 CrossRef PubMed.
- A. Nehdi and J. P. Perrelaut, Nucleic Acids Res., 2006, 34, 584 CrossRef CAS PubMed.
- M. G. Wallis, B. Streicher, H. Wankl, U. von Ahsen, E. Clod, S. T. Wallace, M. Famulok and R. Schroeder, Chem. Biol., 1997, 4, 357 CrossRef CAS PubMed.
- K. Salehi-Asthiani, A. Luptak, A. Litovchick and J. W. Szostak, Science, 2006, 313, 1788 CrossRef PubMed.
- C.-H. T. Webb, N. J. Ricitelli, D. J. Ramininsk and A. Luptak, Science, 2009, 326, 953 CrossRef CAS PubMed.
- H. M. Irving, M. G. Miles and L. D. Pettit, Anal. Chim. Acta, 1967, 38, 475 CrossRef CAS.
- P. Gans, A. Sabatini and A. Vacca, Inorg. Chim. Acta, 1983, 79, 219 CrossRef.
- I. Bertini and C. Luchinat, Coord. Chem. Rev., 1988, 150, 1 Search PubMed.
- L. Banci, I. Bertini and C. Luchinat, Nuclear and Electron Relaxation, VCH, Weinheim, Germany, 1991 Search PubMed.
- I. Solomon, Phys. Rev., 1955, 99, 559 CrossRef CAS.
- C. R. Cantor and P. R. Schimmel, Biophysical Chemistry, W.H. Freeman & Co., San Francisco, 1980 Search PubMed.
- M. J. Frisch, G. W. Trucks, H. B. Schlegel, G. E. Scuseria, M. A. Robb, J. R. Cheeseman, G. Scalmani, V. Barone, B. Mennucci, G. A. Petersson, H. Nakatsuji, M. Caricato, X. Li, H. P. Hratchian, A. F. Izmaylov, J. Bloino, G. Zheng, J. L. Sonnenberg, M. Hada, M. Ehara, K. Toyota, R. Fukuda, J. Hasegawa, M. Ishida, T. Nakajima, Y. Honda, O. Kitao, H. Nakai, T. Vreven, J. A. Montgomery Jr., J. E. Peralta, F. Ogliaro, M. Bearpark, J. J. Heyd, E. Brothers, K. N. Kudin, V. N. Staroverov, R. Kobayashi, J. Normand, K. Raghavachari, A. Rendell, J. C. Burant, S. S. Iyengar, J. Tomasi, M. Cossi, N. Rega, J. M. Millam, M. Klene, J. E. Knox, J. B. Cross, V. Bakken, C. Adamo, J. Jaramillo, R. Gomperts, R. E. Stratmann, O. Yazyev, A. J. Austin, R. Cammi, C. Pomelli, J. W. Ochterski, R. L. Martin, K. Morokuma, V. G. Zakrzewski, G. A. Voth, P. Salvador, J. J. Dannenberg, S. Dapprich, A. D. Daniels, Ö. Farkas, J. B. Foresman, J. V. Ortiz, J. Cioslowski and D. J. Fox, Gaussian 09, Revision C.01, Gaussian, Inc., Wallingford CT, 2010 Search PubMed.
- Y. Zhao and D. G. Truhlar, Theor. Chem. Acc., 2008, 120, 215 CrossRef CAS.
- J. Tomasi, B. Mennucci and R. Cammi, Chem. Rev., 2005, 105, 2999 CrossRef CAS PubMed.
- J. Wrzesiński, L. Błaszczyk, M. Wrońska, A. Kasprowicz, K. Stokowa-Sołtys, J. Nagaj, M. Szafraniec, T. Kuliński, M. Jeżowska-Bojczuk and J. Ciesiołka, FEBS J., 2013, 280, 2652 CrossRef PubMed.
- M. Vieth, J. D. Hirst, A. Kolinski and C. L. Brooks, J. Comput. Chem., 1998, 19, 1612 CrossRef CAS.
| This journal is © The Royal Society of Chemistry 2016 |