DOI:
10.1039/C6DT00166A
(Paper)
Dalton Trans., 2016,
45, 4659-4672
Positional isomerism makes a difference: phosphonic acid anchoring ligands with thienyl spacers in copper(I)-based dye-sensitized solar cells†
Received
13th January 2016
, Accepted 2nd February 2016
First published on 9th February 2016
Abstract
With the aim of improving the photoconversion efficiencies of heteroleptic [Cu(Lanchor)(Lancillary)]+ dyes in n-type dye-sensitized solar cells (DSCs), the previously favoured anchor ((6,6′-dimethyl-[2,2′-bipyridine]-4,4′-diyl)bis(4,1-phenylene))bis(phosphonic acid) (1) has been replaced by analogues 2 and 3 containing 2-thienyl spacers between the 2,2′-bipyridine metal-binding domain and the phosphonic acid anchoring groups. The synthesis and characterization of 2 and 3 (2-thienyl spacer with phosphonic acid in the 5- and 4-positions, respectively) are reported. A stepwise, on-surface method was used to assemble [Cu(Lanchor)(Lancillary)]+ dyes onto FTO/TiO2 electrodes with Lanchor = 1, 2 or 3, and Lancillary = 6,6′-bis(trifluoromethyl)-2,2′-bipyridine (4), 6-trifluoromethyl-2,2′-bipyridine (5), 6,6′-dimethyl-2,2′-bipyridine (6), and 6-methyl-2,2′-bipyridine (7). Changing the solvent in the dye-bath from CH2Cl2 to acetone had only a small effect on the photoconversion efficiencies of [Cu(1)(4)]+, [Cu(1)(5)]+ and [Cu(1)(6)]+; the optimal dye in this series was [Cu(1)(5)]+. Comparable DSC performances were achieved by using either anchor 1 or 2, but there is improved electron injection if the phosphonic acid group is in the 4- rather than 5-position of the thienyl ring (i.e. anchor 3 is superior to 2). Similar open-circuit voltages (VOC) are achieved on going from 1 to 3 with a given Lancillary; although there is typically a gain in short-circuit current denisty (JSC) on going from 1 or 3 to 2, there is an ≈50–60 mV drop in VOC on introducing 2 as the anchor. The best photoconversion efficiencies are obtained for the dye [Cu(3)(5)]+ (η = 2.40% relative to an N719 reference of 5.76%). The conclusions reached from plots of current-density (J) against potential (V), and external quantum efficiency spectra are supported by electrochemical impedance spectroscopic measurements.
Introduction
Recent improvements in the performance of copper-based dye-sensitized solar cells (DSCs) have highlighted the realistic prospect of future DSCs utilizing Earth-abundant metals such as copper1 and iron2 rather than rare and expensive metals such as ruthenium. Breaking the 3%3 then 4%4 barriers of photoconversion efficiencies of DSCs containing copper(I) sensitizers has provided significant impetus to this research field. In order to tune the properties of copper(I) sensitizers and build into their design electronic ‘push–pull’ features, heteroleptic complexes of the type shown in Scheme 1 are desirable. However, isolating heteroleptic [Cu(Lanchor)(Lancillary)]+ dyes is hampered by their tendency in solution to form equilibrium mixtures with the homoleptic [Cu(Lanchor)2]+ and [Cu(Lancillary)2]+ complexes. To overcome this problem, Odobel and coworkers have focused attention on the advantages of the HETPHEN approach (HETPHEN = heteroleptic bisphenanthroline),4–6 and we have developed a ‘surfaces-as-ligands, surfaces-as-complexes’ strategy in which the heteroleptic complex (Scheme 1 and eqn (1)) is assembled directly on the semiconductor surface.1,7 The latter provides a flexible means of combining a wide range of ancillary ligands with a given anchoring domain, allowing the benefits of different ligand combinations in a [Cu(Lanchor)(Lancillary)]+ dye (Scheme 1) to be rapidly recognized.| |  | (1) |
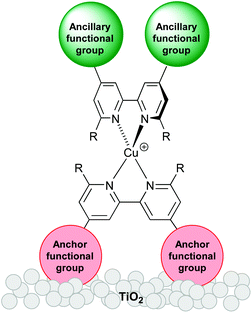 |
| | Scheme 1 Schematic illustration of a TiO2-electrode surface functionalized with a heteroleptic [Cu(Lanchor)(Lancillary)]+ dye. | |
The use of phosphonic acid anchors for copper(I) sensitizers leads to enhanced DSC performance with respect to analogues with carboxylic acid anchors.8 Grätzel has also described the advantages of phosphonic acid anchors in ruthenium sensitizers,9 and Meyer and coworkers have shown that in [Ru(bpy)3]2+-based sensitizers, use of 4,4′-{(HO)2OP}2-bpy (bpy = 2,2′-bipyridine) anchors provides an optimal balance between electron injection efficiency and dye stability.10 In most recent investigations, we have favoured the use of anchoring ligand 1 (Scheme 2); incorporation of an arene spacer between the bpy copper-binding unit and the phosphonic acid functionality improves the photoconversion efficiency of the dye.11 A 6,6′-substitution pattern is beneficial in stabilizing the copper(I) oxidation state by preventing flattening distortions, and the effects on going from 2,9-dimethyl- to 2,9-bis(trifluoromethyl)- to 2,9-diphenyl-substituted 1,10-phenanthroline in [Cu(phen)2]+ complexes has been discussed by Armaroli et al.12 Long excited-state lifetimes have been observed as a result of the combined effects of placing bulky substituents in the 2,9- and 3,8-positions of the phen domains in a [Cu(phen)2]+ photosensitizer.13 Although Odobel has shown that 6,6′-dimesityl-2,2′-bipyridine-4,4′-dicarboxylic acid is an effective anchor,4 we have demonstrated that a change from 6,6′-dimethyl substitution pattern in 1 to 6,6′-diphenyl substituents is detrimental to DSC performance.14,15 We report here the synthesis and application of two new phosphonic acid anchoring ligands (2 and 3, Scheme 2) which incorporate 2-thienyl spacers, the advantages of which in dyes are well recognized.16 Since a combination of 1 with simple halo-functionalized bpy ancillary ligands leads to surprisingly efficient [Cu(1)(Lancillary)]+ dyes,3,17 we chose to use ancillary ligands 4 and 5 (Scheme 3) in a comparative investigation of heteroleptic dyes [Cu(Lanchor)(Lancillary)]+ in which Lanchor = 1, 2 or 3, and Lancillary = 4–7 (Scheme 3).
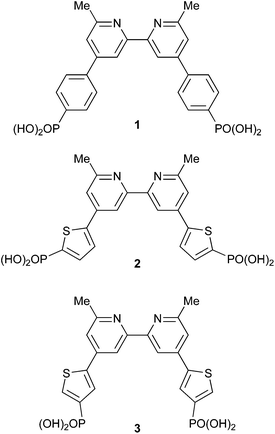 |
| | Scheme 2 Structures of anchoring ligands 1–3. | |
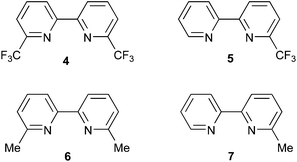 |
| | Scheme 3 Structures of ancillary ligands 4–7. | |
Experimental
General
1H and 13C NMR spectra were recorded on Bruker DRX-500 or 600 NMR spectrometers with chemical shifts referenced to residual solvent peaks (TMS = δ0 ppm). Electrospray mass spectra and high resolution ESI-MS were measured on Bruker Esquire 3000plus and Bruker maXis 4G instruments, respectively. Solution electronic absorption spectra were recorded on a Agilent 8453 spectrophotometer, and solid-state spectra on a Cary 5000 spectrophotometer. A Biotage Initiator 8 microwave reactor was used for reactions carried out under microwave conditions.
DSC preparation and details of instrumentation for external quantum efficiency and electrochemical impedance spectroscopic measurements are given in the ESI.†
The compounds 1,11 [Cu(4)2][PF6],17 [Cu(5)2][PF6],17 [Cu(6)2][PF6]18 and [Cu(7)2][PF6]8 were prepared as previously reported. The syntheses of precursors are presented in the ESI.†
Compound 2a
4,4′-Bis(5-bromothiophen-2-yl)-6,6′-dimethyl-2,2′-bipyridine (64.8 mg, 0.13 mmol), Cs2CO3 (116 mg, 0.36 mmol) and [Pd(PPh3)4] (7.4 mg, 0.006 mmol) were added to a microwave vial. The vial was evacuated and flushed with N2 three times. Then dry THF (5 mL) was added and N2 was bubbled through the solution for 30 min. Diethyl phosphite (79.0 mg, 0.57 mmol) was added and the N2 flow continued for 5 min. The reaction mixture was heated in a microwave reactor at 90 °C for 2 h. The resulting mixture was filtered over Celite and the solvent from the filtrate was removed. Compound 2a was purified by flash column chromatography (SiO2, cyclohexane/acetone (3/2), Rf: 0.1) and isolated as a pale yellow powder (38 mg, 0.06 mmol, 48%). M.p. 198 °C. 1H NMR (500 MHz, CDCl3) δ/ppm 8.49 (d, J = 1.6 Hz, 2H, HA3), 7.68 (dd, JPH = 8.2 Hz, JHH = 3.7 Hz, 2H, HB4), 7.64 (dd, JPH = 3.6 Hz, JHH = 3.6 Hz, 2H, HB3), 7.39 (d, J = 1.7 Hz, 2H, HA5), 4.28–4.08 (m, 8H, HEt-CH2), 2.70 (s, 6H, HMe), 1.37 (m, 12H, HEt-CH3). 13C{1H} NMR (126 MHz, CDCl3) δ/ppm 158.1 (CA6), 156.4 (CA2), 149.7 (CA4/B2), 141.3 (CA4/B2), 137.5 (CB4), 129.0 (d, JPC = 201 Hz, CB5), 126.0 (CB3), 119.8 (CA5), 115.1 (CA3), 62.8 (CEt-CH2), 24.7 (CMe), 16.2 (CEt-CH3). 31P{1H} NMR (162 MHz, CDCl3) +10.8. ESI-MS m/z 621.1 [M + H]+ (calc. 621.1). High resolution ESI-MS m/z: 621.1407 [M + H]+ (calc. 621.1412). UV-VIS (MeCN, 2.5 × 10⁻⁵ M) λ/nm (ε/dm3 mol−1 cm−1): 275 (51![[thin space (1/6-em)]](https://www.rsc.org/images/entities/char_2009.gif) 600), 299 (59
600), 299 (59![[thin space (1/6-em)]](https://www.rsc.org/images/entities/char_2009.gif) 500). Satisfactory elemental analysis could not be obtained.
500). Satisfactory elemental analysis could not be obtained.
Compound 3a
The method was as for 2a starting with 4,4′-bis(4-bromothiophen-2-yl)-6,6′-dimethyl-2,2′-bipyridine (74.9 mg, 0.15 mmol), Cs2CO3 (169 mg, 0.52 mmol), [Pd(PPh3)4] (8.6 mg, 0.007 mmol) and diethyl phosphite (81.8 mg, 0.59 mmol). Compound 3a was obtained as a pale yellow powder (50 mg, 0.08 mmol, 54%). M.p. 188 °C. 1H NMR (500 MHz, CDCl3) δ/ppm 8.50 (br, 2H, HA3), 8.02 (dd, JPH = 8.2 Hz, JHH = 1.2 Hz, 2H, HB5), 7.83 (br. d, 2H, HB3), 7.38 (broadened, 2H, HA5), 4.30–4.01 (m, 8H, HEt-CH2), 2.72 (s, 6H, HMe), 1.36 (m, 12H, HP-Me). 13C{1H} NMR (126 MHz, CDCl3) δ/ppm 158.9 (CA6), 156.1 (CA2), 144.0 (CB2/A4), 141.6 (CB2/A4) 136.0 (CB5), 131.2 (d, JPC = 197 Hz, CB4), 127.2 (CB3), 119.9 (CA5), 115.2 (CA3), 62.4 (d, JPC = 5.4 Hz, CEt-CH2), 24.6 (CMe), 16.4 (d, JPC = 6.5 Hz, CEt-CH3). 31P{1H} NMR (202 MHz, CDCl3) +12.0. UV-VIS (MeCN, 2.5 × 10⁻⁵ M) λ/nm (ε/dm3 mol−1 cm−1): 269 (35![[thin space (1/6-em)]](https://www.rsc.org/images/entities/char_2009.gif) 000), 293 (34
000), 293 (34![[thin space (1/6-em)]](https://www.rsc.org/images/entities/char_2009.gif) 500). ESI-MS m/z 621.1 [M + H] (calc. 621.1). Found C 54.44, H 5.89, N 4.40; C28H34N2O6P2S2 requires C 54.19, H 5.52, N 4.51%.
500). ESI-MS m/z 621.1 [M + H] (calc. 621.1). Found C 54.44, H 5.89, N 4.40; C28H34N2O6P2S2 requires C 54.19, H 5.52, N 4.51%.
Compound 2
Compound 2a (20.0 mg, 0.03 mmol) was dissolved in CH2Cl2 (5 mL), then Me3SiBr (98.6 mg, 0.64 mmol) was added and the solution stirred at room temperature overnight. Water (15 mL) was added and the solution stirred for 30 min. A white precipitate formed, was separated by filtration and dried in vacuo. Compound 2 (10 mg, 0.02 mmol, 61%) was obtained as an off-white powder. Decomp >275 °C. 1H NMR (600 MHz, DMSO-d6) δ/ppm 8.41 (s, 2H, HA3), 7.85 (m, 2H, HB3), 7.70 (s, 2H, HA5), 7.50 (dd, JPH = 8.0 Hz, JHH = 3.7 Hz, 2H, HB4), 2.65 (s, 6H, HMe). 13C{1H} NMR (151 MHz, DMSO-d6) δ/ppm 159.4 (CA6), 155.4 (CA2), 146.0 (CA4), 141.7 (CB5), 137.5 (CB2), 135.0 (CB4), 127.2 (CB3), 119.9 (CA5), 114.2 (CA3), 24.7 (CMe). 31P{1H} NMR (162 MHz, DMSO-d6) +4.0. ESI-MS m/z 509.1 [M + H]+ (calc. 509.0). Found C 45.06, H 3.84, N 5.44; C20H18N2O6P2S2·H2O requires C 45.63, H 3.83, N 5.32%.
Compound 3
The method was as for 2a, starting with 3a (60 mg, 0.10 mmol) in CH2Cl2 (10 mL) and Me3SiBr (296 mg, 1.93 mmol). Compound 3 (40 mg, 0.08 mmol, 81%) was isolated as an off-white powder. Decomp >290 °C. 1H NMR (600 MHz, DMSO-d6) δ/ppm 8.46 (s, 2H, HA3), 8.08 (br. d, J = 8.1 Hz, 2H, HB5), 7.93 (br. m, 2H, HB3), 7.75 (s, 2H, HA5), 2.67 (s, 6H, HMe). 13C{1H} NMR (151 MHz, DMSO-d6) δ/ppm 159.3 (CA6), 142.1 (CA4), 137.9 (CB4), 135.0 (CB5), 128.4 (CB3), 120.3 (CA5), 114.5 (CA3), 24.5 (CMe); CA2 and CB2 not resolved. 31P{1H} NMR (202 MHz, DMSO-d6) +6.1. ESI-MS m/z 509.1 [M + H]+ (calc. 509.0). Found C 42.08, H 4.37, N 5.17; C20H18N2O6P2S2·3.5H2O requires C 42.03, H 4.41, N 4.90%.
Crystallography
Data were collected on a Bruker Kappa Apex2 diffractometer with data reduction, solution and refinement using the programs APEX19 and CRYSTALS.20 Structural analysis was carried out using Mercury v. 3.5.1.21,22
4,4′-Bis(thiophen-2-yl)-6,6′-dimethyl-2,2′-bipyridine
C20H16N2S2, M = 348.49, light yellow block, monoclinic, space group P21/n, a = 9.9744(10), b = 4.7410(5), c = 17.6632(17) Å, β = 91.664(4)°, U = 834.92(15) Å3, Z = 2, Dc = 1.386 Mg m−3, μ(Cu-Kα) = 2.897 mm−1, T = 123 K. Total 9340 reflections, 1509 unique, Rint = 0.023. Refinement of 1482 reflections (116 parameters) with I > 2σ(I) converged at final R1 = 0.0487 (R1 all data = 0.0493), wR2 = 0.0541 (wR2 all data = 0.0563), gof = 1.0670. CCDC 1436307.
Compound 2a
C28H34N2O6P2S2, M = 620.67, colourless plate, monoclinic, space group P21/c, a = 18.3697(12), b = 9.6176(6), c = 8.7340(6) Å, β = 102.202(3)°, U = 1508.20(17) Å3, Z = 2, Dc = 1.367 Mg m−3, μ(Cu-Kα) = 2.972 mm−1, T = 123 K. Total 11![[thin space (1/6-em)]](https://www.rsc.org/images/entities/char_2009.gif) 840 reflections, 2723 unique, Rint = 0.036. Refinement of 2268 reflections (181 parameters) with I > 2σ(I) converged at final R1 = 0.0382 (R1 all data = 0.0473), wR2 = 0.0931 (wR2 all data = 0.0988), gof = 0.9296. CCDC 1435291.
840 reflections, 2723 unique, Rint = 0.036. Refinement of 2268 reflections (181 parameters) with I > 2σ(I) converged at final R1 = 0.0382 (R1 all data = 0.0473), wR2 = 0.0931 (wR2 all data = 0.0988), gof = 0.9296. CCDC 1435291.
Results and discussion
Synthesis of anchoring ligands 2 and 3
The synthesis of anchoring ligands 2 and 3 is based upon our previously published route to ligand 1.11 The precursors 4,4′-bis(5-bromothiophen-2-yl)-6,6′-dimethyl-2,2′-bipyridine and 4,4′-bis(4-bromothiophen-2-yl)-6,6′-dimethyl-2,2′-bipyridine were prepared using Kröhnke23 methodology by treatment of (1E,5E)-1,6-bis(5-bromothiophen-2-yl)hexa-1,5-diene-3,4-dione or (1E,5E)-1,6-bis(4-bromothiophen-2-yl)hexa-1,5-diene-3,4-dione with 1-(2-oxopropyl)pyridin-1-ium chloride and NH4OAc in EtOH (Scheme 4). The compounds were characterized by NMR spectroscopy (Fig. S1 and S2†) and by electrospray mass spectrometry (highest mass peaks at m/z 506.7 and 506.9, respectively, assigned to [M + H]+). The compounds were then treated with HPO(OEt)2 in the presence of Cs2CO3 and [Pd(PPh3)4] in THF under microwave conditions to give the phosphonate esters 2a and 3a (Scheme 4). The latter were isolated in 48 and 54% yields, respectively. Dehalogenation to give the monoester and 4,4′-bis(thiophen-2-yl)-6,6′-dimethyl-2,2′-bipyridine (Scheme S1†) competed with the formation of the phosphonate esters, as confirmed by spectroscopic data (Fig. S3 and S4†) and the serendipidous growth of single crystals of 4,4′-bis(thiophen-2-yl)-6,6′-dimethyl-2,2′-bipyridine (Fig. S5†). The three products could be readily separated by column chromatography (see Experimental section). Attempts to prepare an analogous compound to 2 and 3 with a phosphonic acid group in the 3-position of the 2-thienyl unit were unsuccessful.
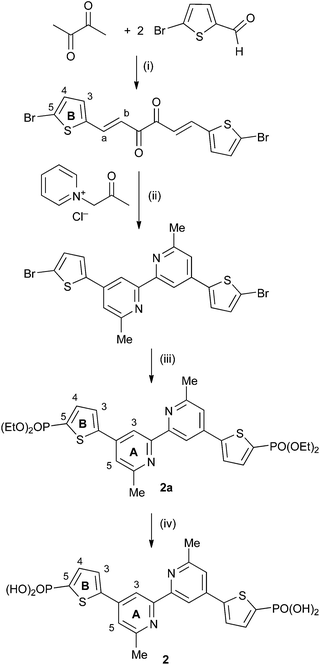 |
| | Scheme 4 Synthetic route to compound 2. Conditions: (i) reflux in MeOH with piperidine, 2 h; (ii) NH4OAc, EtOH, reflux, 4 h; (iii) Cs2CO3, [Pd(PPh3)4], HPO(OEt)2 in THF, microwave reactor, 90 °C, 2 h; (iv) Me3SiBr, CH2Cl2. The route to 3 is analogous, with the corresponding diester labelled 3a. | |
Esters 2a and 3a were converted to phosphonic acids 2 and 3 by treatment with Me3SiBr,24 and the products were isolated as white solids in 61 and 81% yields, respectively. The transformation was confirmed in the 1H and 13C NMR spectra by the disappearance of the signals for the ethyl groups in 2a and 3a. Compounds 2a, 3a, 2 and 3 were characterized spectroscopically and by mass spectrometry. Elemental analysis for 3a and 2 were acceptable; acid 3 analysed as the hydrate 3·3.5H2O. This is not unreasonable given the presence of two phosphonic acid functionalities, and a singlet at δ 3.43 ppm in the 1H NMR spectrum of a DMSO-d6 solution of 2 was observed, consistent with H2O/HOD. Satisfactory elemental analytical data for 2a could not be obtained, but composition was confirmed by high resolution electrospray mass spectrometry (m/z: 620.1407 corresponding to [M + H]+). For each compound, the highest mass peak in the ESI mass spectrum was assigned to [M + H]+ (m/z 621.1 for 2a and 3a, and 509.1 for 2 and 3). Differing solubilities of 2 and 3 compared to 2a and 3a in common solvents meant that the NMR spectra of the acids and esters were recorded in DMSO-d6 and CDCl3, respectively. On going from 2a to 2, and 3a to 3, the singlet in the 31P{1H} NMR spectrum shifted from δ +10.8 to +4.0 ppm, and from δ +12.0 to +6.1 ppm, respectively. The 1H and 13C NMR spectra of the compounds were assigned using DEPT, COSY, NOESY, HMQC and HMBC methods (see Experimental section and Scheme 4 for atom labelling). For 3a, the 13C NMR resonance for CA3 (δ 115.2 ppm) could only be located using the HMBC spectrum from the CA3/HA5 cross-peak. On going from the bromo-precursor to 2a (Scheme 4), the singlet in the 13C NMR spectrum for CB5 at δ 114.1 ppm is replaced by a doublet (JPC = 201 Hz) at δ 129.0 ppm. Similarly, 3a exhibited a doublet (JPC = 197 Hz) at δ 131.2 ppm for CB4, in contrast to a singlet at δ 111.2 ppm for CB4 in the bromo-precursor. The aromatic regions of the 1H NMR spectra of phosphonic acids 2 and 3 are shown in Fig. 1. Broadening of the signals is most likely a solvent effect.
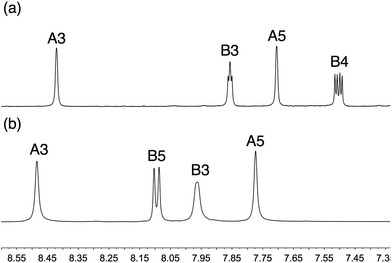 |
| | Fig. 1 Aromatic regions of the 1H NMR spectra of (a) 2 and (b) 3 (DMSO-d6 solutions). Chemical shifts in δ/ppm. | |
Single crystals of 2a were grown by slowly evaporating an acetone/cyclohexane solution of 2a. The compound crystallizes in the monoclinic space group P21/c, and the structure of the centrosymmetric molecule is shown in Fig. 2; selected bond metrics are given in the figure caption and are as expected. The bpy domain is necessarily planar, and the plane of the thienyl unit is twisted 22.2° with respect to the pyridine ring to which it is bonded. The PO(OEt)2 unit is positioned so that the ethoxy groups are above and below the thiophene ring plane, as expected on steric grounds; the O10–P6–C5–C4 torsion angle is 17.3(3)°. The pyridine atom N17 acts as a bifurcated acceptor25 in C–H⋯N interactions to a thiophene CH and a methyl CH in adjacent molecules (Fig. 3; C3iiH31ii⋯N17 = 2.54 Å; C20iiiH203iii⋯N17 = 2.72 Å; symmetry codes: ii = 1 − x, −½ + y, ½ − z; iii = x, ½ − y, ½ + z). These, along with C–Hethyl⋯OPO close contacts, are dominant packing forces are the crystal.
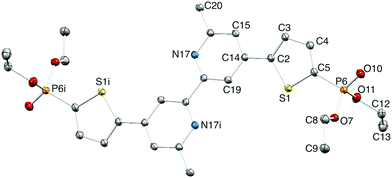 |
| | Fig. 2 Structure of 2a; ellipsoids plotted at 40% probability level and H atoms omitted for clarity. Symmetry code i = 1 − x, −y, 1 − z. Selected bond parameters: S1–C2 = 1.731(2), S1–C5 = 1.718(2), C5–P6 = 1.780(2), P6–O7 = 1.5782(17), P6–O10 = 1.4644(18), P6–O11 = 1.5726(18) Å; C2–S1–C5 = 91.86(11), C5–P6–O7 = 107.07(10), C5–P6–O10 = 112.57(11), O7–P6–O10 = 115.04(10), C5–P6–O11 = 101.27(10), O7–P6–O11 = 101.80(9), O10–P6–O11 = 117.54(10)°. | |
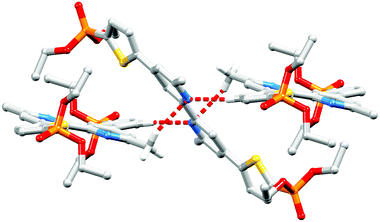 |
| | Fig. 3 Bifurcated N⋯H–C interactions between molecules of 2a. Hydrogen atoms except for those in the functional groups involved in hydrogen bonding, are omitted for clarity. | |
DSC reproducibility and N719 reference DSCs
For the DSC measurements detailed below, duplicate cells for each sensitizer were made and all data are presented to illustrate the reproducibility of the results. All DSCs were fully masked.26,27 Photoconversion efficiencies are compared with the performance of reference DSCs containing the ruthenium dye N719. Using such relative η values allows valid comparisons between measurements made in different investigations, in different research laboratories, and using different commercial sun simulators (which, in our experience, vary28). To validate the reference values, six DSCs containing N719![[thin space (1/6-em)]](https://www.rsc.org/images/entities/char_2009.gif) 1 were assembled (see Experimental section). The reproducibility of plots of current density (J) against potential (V) are confirmed in Fig. S6;† Table S1† gives the performance parameters of the N719 DSCs which show only small variation between devices. In the discussion that follows, average values (Table S1†) of short-circuit current density (JSC), open-circuit voltage (VOC), fill-factor (ff) and photoconversion efficiency (η) for N719 are used.
1 were assembled (see Experimental section). The reproducibility of plots of current density (J) against potential (V) are confirmed in Fig. S6;† Table S1† gives the performance parameters of the N719 DSCs which show only small variation between devices. In the discussion that follows, average values (Table S1†) of short-circuit current density (JSC), open-circuit voltage (VOC), fill-factor (ff) and photoconversion efficiency (η) for N719 are used.
Performances of DSCs with dyes with anchor 1: solvent effects
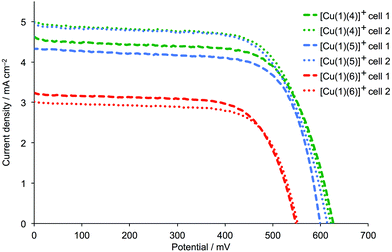
We recently showed that DSCs containing the copper(I) dyes [Cu(1)(4)]+ and [Cu(1)(5)]+ with fluorinated ancillary ligands (Scheme 3) exhibit photoconversion efficiencies of ≈30–34% relative to N719 set at 100%, and outperform DSCs containing [Cu(1)(6)]+ in which 6 contains methyl substituents in the 6- and 6′-positions (Scheme 3).17 In this study,17 the exchange reaction (eqn (1)) used to assemble the copper(I) dyes on the TiO2 electrode was carried out in CH2Cl2. Dye-bath solvents are known to influence the performance of DSCs,29,30 and we attempted to enhance the photoconversion efficiency of dyes [Cu(1)(4)]+ and [Cu(1)(5)]+ by replacing CH2Cl2 in the dye-bath by acetone.29 DSCs were made using commercial TiO2 electrodes that were sequentially dipped in a dye-bath of a DMSO solution of anchor 1, and then in a bath containing an acetone solutions of either 4, 5 or 6 (see Experimental section). The performances and external quantum efficiencies (EQEs) of duplicate DSCs were measured one, three and seven days after fabrication; an I−/I3− electrolyte was used in these solar cells. Values of JSC, VOC, ff and η are given in Table 1. The last column in Table 1 gives values of η relative to N719, for which the relative efficiency is set at 100%. J–V curves and EQE spectra for the DSCs were recorded one day after sealing the cells, and are shown in Fig. 4 and 5.
 |
| | Fig. 4
J–V curves for duplicate DSCs with [Cu(1)(4)]+, [Cu(1)(5)]+ and [Cu(1)(6)]+, recorded one day after DSC fabrication. | |
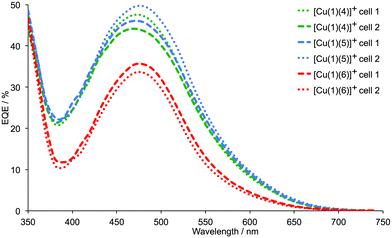 |
| | Fig. 5 EQE spectra for duplicate DSCs with [Cu(1)(4)]+, [Cu(1)(5)]+ and [Cu(1)(6)]+, recorded one day after DSC fabrication. | |
Table 1 Parameters of duplicate, masked DSCs with [Cu(1)(4)]+ and [Cu(1)(5)]+ (fluoro-substituents in Lancillary) and [Cu(1)(6)]+ (methyl-substituents) compared to N719; a LOT Quantum Design LS0811 was used as the light source
| Dye |
J
SC/mA cm−2 |
V
OC/mV |
ff/% |
η/% |
Relative ηa/% |
|
Relative to N719 set at 100%. See Table S1 for N719 DSCs.
|
|
1 day after sealing the cells
|
| [Cu(1)(4)]+ |
4.58 |
626 |
68 |
1.95 |
33.6 |
| [Cu(1)(4)]+ |
4.97 |
621 |
67 |
2.08 |
35.9 |
| [Cu(1)(5)]+ |
4.91 |
613 |
67 |
2.03 |
35.0 |
| [Cu(1)(5)]+ |
4.34 |
599 |
71 |
1.84 |
31.7 |
| [Cu(1)(6)]+ |
3.21 |
548 |
69 |
1.22 |
21.0 |
| [Cu(1)(6)]+ |
3.00 |
551 |
71 |
1.17 |
20.2 |
| N719 |
13.55 |
650 |
66 |
5.80 |
100 |
|
3 days after sealing the cells
|
| [Cu(1)(4)]+ |
4.59 |
620 |
70 |
1.99 |
33.6 |
| [Cu(1)(4)]+ |
4.76 |
614 |
67 |
1.97 |
33.2 |
| [Cu(1)(5)]+ |
4.81 |
613 |
68 |
2.00 |
33.7 |
| [Cu(1)(5)]+ |
4.42 |
609 |
73 |
1.96 |
33.1 |
| [Cu(1)(6)]+ |
3.08 |
540 |
70 |
1.17 |
19.7 |
| [Cu(1)(6)]+ |
2.90 |
556 |
71 |
1.15 |
19.4 |
| N719 |
13.14 |
684 |
66 |
5.93 |
100 |
|
7 days after sealing the cells
|
| [Cu(1)(4)]+ |
4.49 |
610 |
71 |
1.96 |
33.2 |
| [Cu(1)(4)]+ |
4.81 |
603 |
69 |
2.00 |
33.9 |
| [Cu(1)(5)]+ |
4.74 |
614 |
68 |
1.98 |
33.6 |
| [Cu(1)(5)]+ |
4.48 |
611 |
73 |
2.00 |
33.9 |
| [Cu(1)(6)]+ |
3.04 |
537 |
70 |
1.15 |
19.5 |
| [Cu(1)(6)]+ |
2.82 |
564 |
70 |
1.12 |
19.0 |
| N719 |
13.05 |
691 |
66 |
5.90 |
100 |
The data in Table 1 reveal that the DSCs containing [Cu(1)(4)]+ or [Cu(1)(5)]+ significantly outperform those with [Cu(1)(6)]+, as was the case when the dye-bath solvent was CH2Cl2. The J–V curves in Fig. 4 show enhancement of both JSC and VOC when CF3 groups are introduced into the ancillary ligand. Good fill-factors of ∼70% are achieved for all DSCs, and the global efficiencies are maintained over a week after sealing the cells. The longer-term stability of a DSC containing [Cu(1)(5)]+ was confirmed with values of JSC = 4.48 mA cm−2, VOC = 603 mV, ff = 70% and η = 1.90% recorded after 50 days. The EQE spectra of the DSCs are shown in Fig. 5 and are consistent with the improved JSC values of [Cu(1)(4)]+ or [Cu(1)(5)]+versus [Cu(1)(6)]+ (Table 1). For the DSCs in which the sensitizer is [Cu(1)(4)]+ or [Cu(1)(5)]+, EQEmax lies between 44.1% and 49.6% (λmax = 470–480 nm). This considerably exceeds values of EQEmax = 33.5–35.5% (λmax = 480 nm) for the DSCs containing [Cu(1)(6)]+. Inclusion of fluoro-substituted ancillary ligands 4 or 5 leads to relative photoconversion efficiencies of ∼33% after 3 to 7 days (with respect to 100% for N719). This is similar to the relative values of η obtained for DSCs assembled using CH2Cl2 in the dye-bath17 and we conclude that in this case, the choice of CH2Cl2 or acetone has no significant impact on the DSC performance.
Although the sealed DSCs are stable, both acetone and CH2Cl2 solutions of [Cu(4)2][PF6] lose their orange colour within a week. For this reason, we initially focused attention on the use of 5 for DSC investigations with the anchors 2 and 3.
DSCs with [Cu(Lanchor)(5)]+ dyes with Lanchor = 1, 2 or 3
The heteroleptic dyes [Cu(1)(5)]+, [Cu(2)(5)]+ and [Cu(3)(5)]+ were assembled on commercial FTO/TiO2 electrodes with and without scattering layers. The latter were used to record solid-state absorption spectra and the former to fabricate DSCs (see Experimental section). Solid-state absorption spectra of the adsorbed dyes [Cu(1)(5)]+, [Cu(2)(5)]+ and [Cu(3)(5)]+ are shown in Fig. 6. A small red-shift in λmax is observed on going from [Cu(1)(5)]+ (460 nm) to [Cu(2)(5)]+ and [Cu(3)(5)]+ (470 nm), and the absorption band is broadened towards the red-end of the spectrum.
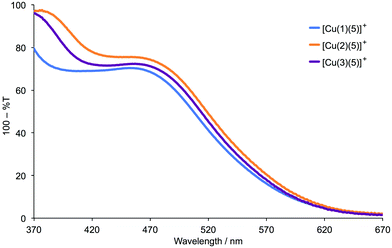 |
| | Fig. 6 Solid-state absorption spectra of FTO/TiO2 electrodes with adsorbed dyes [Cu(1)(5)]+, [Cu(2)(5)]+ and [Cu(3)(5)]+. The spectra were recorded in transmission mode, and data are presented as 100% T for ease of interpretation of λmax. | |
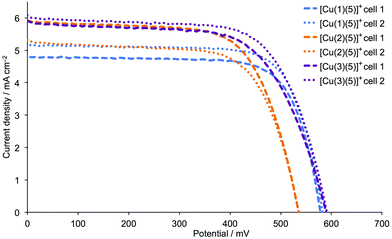
Performance data for the DSCs over a period of a week are given in Table 2, and there is satisfactory reproducibility between the performances of pairs of cells containing the same dye. Fig. 7 shows the J–V curves for the DSCs on the day of cell assembly. Replacement of the phenyl spacer in anchor 1 by a 2-thienyl spacer in 2 and 3 results in an increase in the short-circuit current density, and this is most noticeable for the sensitizer [Cu(3)(5)]+. Fig. 7 and Table 2 illustrate that values of VOC for DSCs with [Cu(1)(5)]+ and [Cu(3)(5)]+ are essentially the same, whereas devices with [Cu(2)(5)]+ consistently exhibit lower values of VOC. Within experimental error, the global efficiencies of the DSCs are stable over time, and Table 2 shows that the best performing dye is that containing anchor 3, i.e. the 2-thienyl spacer with phosphonic acid in the 4-position (Scheme 2). The EQE spectra in Fig. 8 (see also Table 3) are consistent with the enhanced JSC values for [Cu(2)(5)]+ and [Cu(3)(5)]+. The values of EQEmax of 52.9 and 51.8% (Table 3) for the duplicate DSCs with [Cu(3)(5)]+ coupled with the enhanced quantum efficiences towards the red-end of the spectrum compared to the EQE spectra for the DSCs containing [Cu(1)(5)]+ (Fig. 8) are noteworthy. The EQE spectra of DSCs with [Cu(2)(5)]+ (Fig. 8) also show a broad spectral response.
 |
| | Fig. 7
J–V curves for duplicate DSCs with [Cu(1)(5)]+, [Cu(2)(5)]+ and [Cu(3)(5)]+ and commercial FTO/TiO2 electrodes, recorded on the day of DSC fabrication. | |
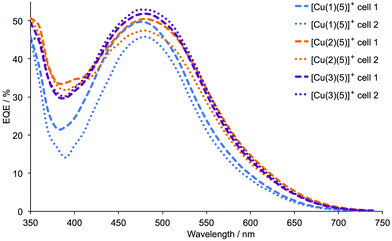 |
| | Fig. 8 EQE spectra for duplicate DSCs with [Cu(1)(5)]+, [Cu(2)(5)]+ and [Cu(3)(5)]+ and commercial FTO/TiO2 electrodes, recorded on the day of DSC assembly. | |
Table 2 Parameters of duplicate, masked DSCs with [Cu(1)(5)]+, [Cu(2)(5)]+ and [Cu(3)(5)]+ compared to N719; commercial electrodes were used for the photoanodes; a LOT Quantum Design LS0811 was used as the light source
| Dye |
J
SC/mA cm−2 |
V
OC/mV |
ff/% |
η/% |
Relative ηa/% |
|
Relative to N719 set at 100%. See Table S1 for N719 DSCs.
|
|
On the day of sealing the cells
|
| [Cu(1)(5)]+ |
5.45 |
606 |
69 |
2.26 |
39.2 |
| [Cu(1)(5)]+ |
5.16 |
582 |
74 |
2.22 |
38.5 |
| [Cu(2)(5)]+ |
5.90 |
535 |
67 |
2.13 |
37.0 |
| [Cu(2)(5)]+ |
5.28 |
535 |
68 |
1.91 |
33.2 |
| [Cu(3)(5)]+ |
5.87 |
589 |
64 |
2.23 |
38.7 |
| [Cu(3)(5)]+ |
6.02 |
591 |
67 |
2.40 |
41.7 |
| N719 |
13.64 |
636 |
66 |
5.76 |
100 |
|
3 days after sealing the cells
|
| [Cu(1)(5)]+ |
4.81 |
613 |
68 |
2.00 |
33.7 |
| [Cu(1)(5)]+ |
4.42 |
609 |
73 |
1.96 |
33.1 |
| [Cu(2)(5)]+ |
5.46 |
552 |
64 |
1.93 |
32.5 |
| [Cu(2)(5)]+ |
4.98 |
557 |
67 |
1.86 |
31.4 |
| [Cu(3)(5)]+ |
5.25 |
611 |
65 |
2.08 |
35.1 |
| [Cu(3)(5)]+ |
5.66 |
600 |
67 |
2.29 |
38.6 |
| N719 |
13.14 |
684 |
66 |
5.93 |
100 |
|
7 days after sealing the cells
|
| [Cu(1)(5)]+ |
4.74 |
614 |
68 |
1.98 |
33.6 |
| [Cu(1)(5)]+ |
4.48 |
611 |
73 |
2.00 |
33.9 |
| [Cu(2)(5)]+ |
5.43 |
566 |
68 |
2.09 |
35.4 |
| [Cu(2)(5)]+ |
4.93 |
564 |
68 |
1.90 |
32.2 |
| [Cu(3)(5)]+ |
5.10 |
619 |
67 |
2.10 |
35.6 |
| [Cu(3)(5)]+ |
5.42 |
601 |
69 |
2.25 |
38.1 |
| N719 |
13.05 |
691 |
66 |
5.90 |
100 |
Table 3 EQE maxima for DSCs containing [Cu(1)(5)]+, [Cu(2)(5)]+ and [Cu(3)(5)]+ (commercial electrodes) measured on the day of cell assembly
| |
Cell 1 |
Cell 2 |
| Anchored dye |
λ
max/nm |
EQEmax/% |
λ
max/nm |
EQEmax/% |
| [Cu(1)(5)]+ |
480 |
45.8 |
480 |
49.6 |
| [Cu(2)(5)]+ |
480 |
46.4 |
480 |
46.0 |
| [Cu(3)(5)]+ |
480 |
44.1 |
480 |
46.9 |
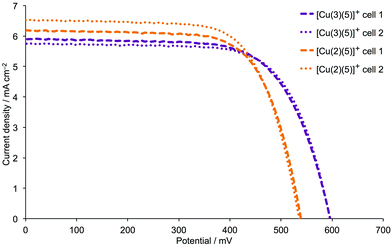
To further validate the improvement in VOC on going from 2 to 3, we repeated the DSC performance measurements using in-house, screen-printed FTO/TiO2 electrodes. The dyes [Cu(2)(5)]+ and [Cu(3)(5)]+ were assembled on the electrodes by the step-wise approach shown in eqn (1); the photoanodes were incorporated into DSCs along with I−/I3− electrolyte. DSC performance parameters are given in Table S2,† and Fig. 9 shows the respective J–V curves. The ∼55–60 mV gain in VOC mirrors that seen when commercial electrodes were used (Fig. 7vs.Fig. 9), and values of JSC are similar. EQE spectra (Fig. S7†) all show EQEmax > 50% (Table 4) and the same extension of the spectral response to higher wavelengths. Thus, data for DSCs made using self-printed FTO/TiO2 electrodes confirm that higher VOC values are achieved if the phosphonic acid anchor-groups are located in the 4- rather than 5-positions of the thienyl functionality.
 |
| | Fig. 9
J–V curves for duplicate DSCs with [Cu(2)(5)]+ and [Cu(3)(5)]+ dyes on in-house screen-printed FTO/TiO2 electrodes, recorded on the day of DSC assembly. | |
Table 4 EQE maxima for duplicate DSCs containing dyes [Cu(1)(5)]+, [Cu(2)(5)]+ and [Cu(3)(5)]+ and in-house screen-printed electrodes, measured on the day of cell assembly
| |
Cell 1 |
Cell 2 |
| Anchored dye |
λ
max/nm |
EQEmax/% |
λ
max/nm |
EQEmax/% |
| [Cu(2)(5)]+ |
480 |
55.2 |
480 |
53.0 |
| [Cu(3)(5)]+ |
480 |
55.8 |
480 |
53.9 |
The longer-term stability of DSCs containing [Cu(2)(5)]+ and [Cu(3)(5)]+ (both with commercial and in-house screen-printed electrodes) was assessed by measurements made after 41 or 46 days. A comparison of the data in Table 5 with the characteristics of 7-day old DSCs containing [Cu(2)(5)]+ and [Cu(3)(5)]+ (Tables 2 and S2†) confirm little change in JSC, VOC and η values for a given DSC over a 6-week period.
Table 5 Long-term stability tests of duplicate, masked DSCs containing [Cu(2)(5)]+ and [Cu(3)(5)]+; a LOT Quantum Design LS0811 was used as the light source. Compare data with those in Tables 2 and S2
| Dye |
Age of DSC/days |
J
SC/mA cm−2 |
V
OC/mV |
ff/% |
η/% |
|
Commercial FTO/TiO
2
electrodes
|
| [Cu(2)(5)]+ |
46 |
5.23 |
572 |
70 |
2.10 |
| [Cu(2)(5)]+ |
46 |
4.70 |
568 |
71 |
1.90 |
| [Cu(3)(5)]+ |
46 |
5.08 |
615 |
69 |
2.15 |
| [Cu(3)(5)]+ |
46 |
5.07 |
613 |
72 |
2.22 |
|
In-house, screen-printed FTO/TiO
2
electrodes
|
| [Cu(2)(5)]+ |
41 |
5.65 |
549 |
70 |
2.17 |
| [Cu(2)(5)]+ |
41 |
5.82 |
545 |
69 |
2.19 |
| [Cu(3)(5)]+ |
41 |
5.39 |
625 |
69 |
2.32 |
| [Cu(3)(5)]+ |
41 |
5.41 |
616 |
70 |
2.34 |
Combining thienyl-spaced anchors with different ancillary ligands
We have now shown that although comparable DSC performances are achieved using either a 2-thienyl or phenyl spacer in the phosphonic acid anchoring ligand, higher VOC values result if the phosphonic acid group is in the 4- rather than 5-position of the thienyl ring. This conclusion was reached using a single ancillary ligand, 5. To validate the conclusions, we extended the study to dyes containing combinations of 1, 2 and 3 with ancillary ligands 6 and 7 (Scheme 3).
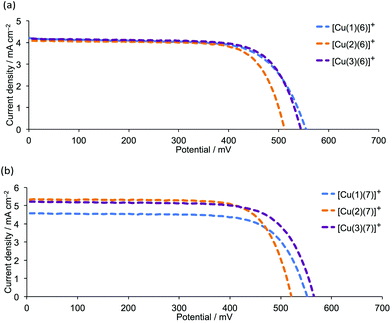
Tables 6 and S3† present performance parameters for pairs of DSCs containing [Cu(Lanchor)(Lancillary)]+ with Lanchor = 1–3 and Lancillary = 6, 7. J–V curves for one set of DSCs with each ancillary ligand are shown in Fig. 10; Fig. S8† gives a comparison of J–V curves for duplicate DSCs containing ancillary ligand 6. Pleasingly, the same trend observed in the series [Cu(1)(5)]+, [Cu(2)(5)]+ and [Cu(3)(5)]+ (Fig. 7 and 9) is followed by [Cu(1)(6)]+, [Cu(2)(6)]+ and [Cu(3)(6)]+ (Fig. 10a) and by [Cu(1)(7)]+, [Cu(2)(7)]+ and [Cu(3)(7)]+ (Fig. 10b). Both the anchors with the thienyl spacer perform well, but a significant gain in VOC (∼40 to 50 mV) is achieved on going from anchor 2 to 3. On the day of DSC assembly (Table 6), values of JSC are similar for [Cu(1)(6)]+, [Cu(2)(6)]+ and [Cu(3)(6)]+ (Fig. 10a) and are somewhat higher for [Cu(2)(7)]+ and [Cu(3)(7)]+ with respect to [Cu(1)(7)]+ (Fig. 10b). The origin of this improvement in JSC is nicely illustrated by the EQE spectra shown in Fig. 11, with enhanced quantum efficiencies above ∼530 nm being consistent with the discussion of the EQE spectra of [Cu(2)(5)]+ and [Cu(3)(5)]+ (Fig. 8). On going from [Cu(1)(7)]+ to [Cu(2)(7)]+ and [Cu(3)(7)]+, the value of λmax corresponding to EQEmax undergoes a red-shift of 10 nm (Fig. 11 and Table 7). For Lancillary = 6 or 7, the global efficiencies of 7-day old DSCs (Table S3†) containing anchors 2 or 3 are slightly improved with respect to those with anchor 1. Fig. 12 summarizes the photoconversion efficiencies of DSCs with different Lanchor/Lancillary combinations, and illustrates clearly that 3 is the best of the anchoring ligands, and 5 is the leading ancillary ligand.
 |
| | Fig. 10
J–V curves for DSCs with (a) [Cu(Lanchor)(6)]+ and (b) [Cu(Lanchor)(7)]+ dyes (Lanchor = 1, 2 and 3) on commercial FTO/TiO2 electrodes, recorded on the day of DSC assembly. See also Fig. S8.† | |
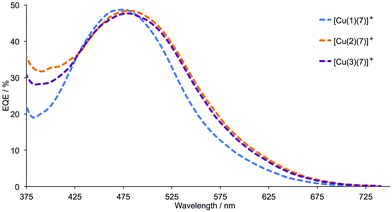 |
| | Fig. 11 EQE spectra for DSCs with [Cu(Lanchor)(7)]+ (Lanchor = 1, 2 and 3) on commercial FTO/TiO2 electrodes, recorded on the day of assembling the DSCs. | |
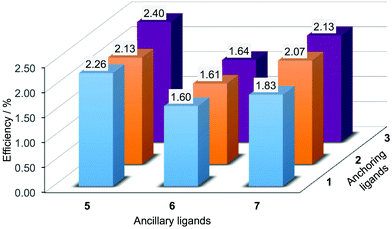 |
| | Fig. 12 Best photoconversion efficiencies, η, of DSCs containing [Cu(Lanchor)(Lancillary)]+ sesnitizers with Lanchor = 1–3 and Lancillary = 5–7. Measurements were made on the day of DSC fabrication and N719 achieves a value of η = 5.76% under the same conditions. | |
Table 6 Parameters of duplicate, masked DSCs with [Cu(Lanchor)(Lancillary)]+ (Lanchor = 1–3, Lancillary = 6, 7) compared to a reference DSC with N719; commercial FTO/TiO2 electrodes were used. The light source was a LOT Quantum Design LS0811. See also Table S3
| Dye |
J
SC/mA cm−2 |
V
OC/mV |
ff/% |
η/% |
Relative ηa/% |
|
Relative to N719 set at 100%.
|
|
On the day of sealing the cells
|
| [Cu(1)(6)]+ |
4.19 |
554 |
69 |
1.60 |
27.8 |
| [Cu(1)(6)]+ |
3.78 |
550 |
69 |
1.44 |
25.0 |
| [Cu(1)(7)]+ |
3.78 |
552 |
75 |
1.56 |
27.1 |
| [Cu(1)(7)]+ |
4.58 |
551 |
72 |
1.83 |
31.8 |
| [Cu(2)(6)]+ |
4.08 |
511 |
74 |
1.54 |
26.7 |
| [Cu(2)(6)]+ |
4.33 |
509 |
73 |
1.61 |
28.0 |
| [Cu(2)(7)]+ |
4.96 |
527 |
73 |
1.91 |
33.2 |
| [Cu(2)(7)]+ |
5.35 |
521 |
74 |
2.07 |
35.9 |
| [Cu(3)(6)]+ |
4.17 |
544 |
72 |
1.64 |
28.5 |
| [Cu(3)(6)]+ |
3.85 |
532 |
72 |
1.48 |
25.7 |
| [Cu(3)(7)]+ |
4.69 |
562 |
70 |
1.85 |
32.1 |
| [Cu(3)(7)]+ |
5.22 |
565 |
72 |
2.13 |
37.0 |
| N719 |
13.64 |
636 |
66 |
5.76 |
100 |
Table 7 EQE maxima for duplicate DSCs containing [Cu(Lanchor)(7)]+ with Lanchor = 1–3 and using commercial electrodes; the spectra were recorded on the day of cell assembly
| |
Cell 1 |
Cell 2 |
| Anchored dye |
λ
max/nm |
EQEmax/% |
λ
max/nm |
EQEmax/% |
| [Cu(1)(7)]+ |
470 |
48.6 |
470 |
41.5 |
| [Cu(2)(7)]+ |
480 |
48.4 |
480 |
46.1 |
| [Cu(3)(7)]+ |
480 |
47.7 |
480 |
45.4 |
One versus two methyl groups, and a methyl versus trifluoromethyl group in Lancillary
In this section, we comment briefly on the comparison of one or two methyl substituents in the ancillary ligand, and compare the performances of DSCs with [Cu(Lanchor)(7)]+ and [Cu(Lanchor)(5)]+ (5 and 7 differ in bearing either a CF3 or CH3 group in the 6-position of the bpy unit).
In previous investigations, we have shown that the incorporation of methyl substituents in the 6- and 6′-positions of a bpy-based ancillary ligand improves DSC performance.7,14 The data in Table 6 for pairs of sensitizers [Cu(Lanchor)(6)]+ and [Cu(Lanchor)(7)]+ illustrate enhanced DSC performance on going from an ancillary ligand with a 6,6′-dimethyl substitution to one with a single 6-methyl group (an observation that is supported by the EIS measurments discussed later). In all dyes, the anchoring ligand contains a 6,6′-dimethyl-2,2′-bipyridine core. The improvement is most noticable for dyes with anchors 2 and 3, and has its origins in increased values of both JSC and VOC.
The data in Table 2, Fig. 7 and 8 illustrate how the performances of DSCs with the dyes [Cu(Lanchor)(5)]+ vary as a function of Lanchor. Analogous information for the series of [Cu(Lanchor)(7)]+ dyes is presented in Table 6, Fig. 10 and 11. A comparison of the two sets of results confirms that the replacement of a 6-methyl substituent in 7 by a trifluoromethyl group in 5 leads to an enhancement in photoconversion efficiency. On going from [Cu(1)(7)]+ to [Cu(1)(5)]+, JSC increases from 4.58 to 5.45 mA cm−2 (best values are selected from duplicate DSCs) on the day the DSCs were sealed, and the difference is maintained after a week (3.79 versus 4.74 mA cm−2). Enhanced VOC is also observed on the initial day (551 to 582 mV), with this differentiation retained as the DSCs age. For DSCs containing [Cu(3)(7)]+ or [Cu(3)(5)]+, there is a notable improvement in JSC on introducing the fluoro-substituents. For 7-day old DSCs, values of JSC = 4.13 and 4.44 mA cm−2 for [Cu(3)(7)]+ (Table 6) increase to 5.10 and 5.42 mA cm−2 for [Cu(3)(5)]+ (Table 2), and the global efficiencies increase from 1.77 and 1.96% for duplicate DSCs to 2.10 and 2.25% (compared to 5.90% for N719). The trends substantiate those previously reported,17 and in order to gain a better understanding of the contributing factors, we have applied the method of electrochemical impedance spectroscopy.
Electrochemical impedance spectroscopy: introductory comments
EIS is a powerful tool for the analysis and evaluation of the performance and properties of electrochemical systems and is highly suited to investigations of charge transfer processes in DSCs.31,32 A small alternating current (AC) of varying frequency is applied close to the open-circuit potential of the DSC which may be placed under a bias-light of different intensities.33 The internal impedances at the various frequencies correspond to different processes in the cell. The results are commonly plotted in a Nyquist plot (Fig. 13) where each semi-circle in the plot provides information about the charge-transfer resistances and capacitances of the corresponding interface in a DSC.34 Recombination reactions or ‘back reactions’ are the main limiting factors affecting the photoconversion efficiency of a DSC.35
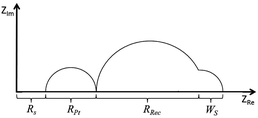 |
| | Fig. 13 Schematic representation of a Nyquist plot. Rs is the electrical resistance in cables, contacts and the resistance of the semi-conductor/FTO glass. RPt is the charge transfer resistance of the interface cathode/electrolyte. Rrec is the electron recombination resistance of the active layer/electrolyte and Ws is the Warburg short resistance of the ion diffusion in the electrolyte close to the active layer surface. | |
From the parameters extracted from EIS data, the length of the electron diffusion, Ld, and the electron lifetime (τ) in the semiconductor (SC), can be obtained.36 These are given by eqn (2) and (3), respectively, where Rt is the transport resistance in the SC, Cμ is the chemical capacitance of the TiO2/electrolyte interface (with the capacitance of the transparent conductive oxide layer/electrolyte neglected at higher bias voltages when the SC is conducting) and L is the thickness of the porous active layer.
| |  | (2) |
Studies of Rt are best carried out at lower bias-light intensities, since at higher open-circuit voltages, the SC exhibits electron-transport properties closer to that of a conductor; thus, Rt becomes lower and more difficult to observe. At a given illumination intensity (given that the geometry of the electrode is constant), it can be assumed that the Fermi level (EF) and the resistance of TiO2 (R0) are constant. From eqn (4) it then follows that a change of the lower level of the conduction band (Ecb) is the one main parameter that will affect Rt on the surface, close to the dye/electrolyte.37
| |  | (4) |
The electrolyte composition and the dye are factors that influence the values of Ecb and therefore VOC.37 In a well-performing DSC, the recombination resistance should be significantly higher than the transport resistance. In this case, electrons injected into the TiO2 are readily collected, and the tendency to recombine with the oxidized dye or the oxidized form of the electrolyte is suppressed. It follows from eqn (2) that the normalized diffusion length Ld/L will be greater than unity.36 The physical meaning is that Ld for the injected electron to reach the p–n junction and combine with the generated hole should be at least longer than L.
EIS measurements: DSCs with dyes with anchor 1
We initially focus on EIS data for 3-day old DSCs containing the dyes [Cu(1)(4)]+, [Cu(1)(5)]+, [Cu(1)(6)]+ and [Cu(1)(7)]+ with the phenyl-spacer in the anchoring ligand. As discussed earlier, DSC performance parameters showed that dyes containing CF3 groups in the ancillary ligand exhibit higher VOC values than the CH3 analogues. This trend is confirmed by the VOC values determined at different light intensities from EIS measurements. Table S4† presents all data, and Tables 8 and 9 give data at the lowest and highest light intensities measured; Nyquist and Bode plots are shown in Table S5.† A higher VOC implies that more electrons are present in the conduction band of the SC, which indicates a more negative conduction band level (Ecb). This is supported by the values of Rt given in Table 9 (where EIS data are from measurements at lower bias-light intensities). The values of Rt are significantly lower for dyes containing 4 and 5 than 6 and 7. On the other hand, the DSCs containing [Cu(1)(6)]+ or [Cu(1)(7)]+ exhibit higher Rrec values (Fig. 14a and 15). However, the electron lifetimes (plotted in Fig. 14bversus the bias-light intensity) for DSCs with [Cu(1)(4)]+, [Cu(1)(5)]+, [Cu(1)(6)]+, [Cu(1)(7)]+ are in the same range. The electron lifetime is the product of Rrec and Cμ, and it therefore follows that the capacitance must be significantly larger for the trifluoromethylated dyes [Cu(1)(4)]+ and [Cu(1)(5)]+, as confirmed in Fig. 16. Inspection of Tables 8 and 9 reveals that the DSC with [Cu(1)(5)]+ exhibits both a high capacitance and a relatively high recombination resistance, but also has the lowest Rt and the highest Ld/L of all the [Cu(1)(Lancillary)]+ dyes. This is reflected in the overall performance of this DSC.
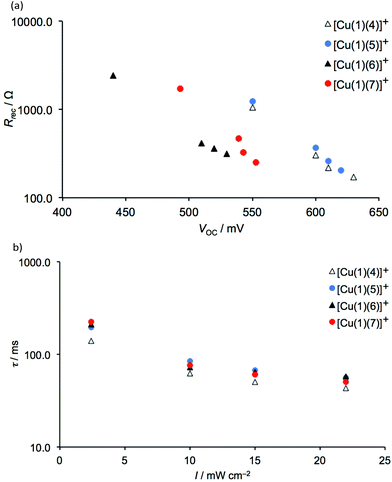 |
| | Fig. 14 (a) The recombination resistance as a function of VOC and (b) the electron lifetime as a function of bias-light intensity in 3-day old DSCs containing dyes [Cu(1)(4)]+, [Cu(1)(5)]+, [Cu(1)(6)]+, [Cu(1)(7)]+. | |
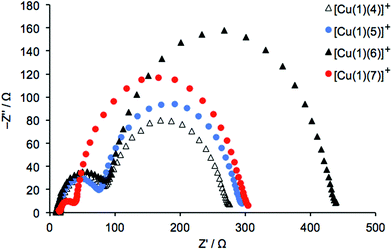 |
| | Fig. 15 Nyquist plots for 3-day old DSCs containing dyes [Cu(1)(4)]+, [Cu(1)(5)]+, [Cu(1)(6)]+, [Cu(1)(7)]+ measured with a bias-light intensity of 22 mW cm−2. | |
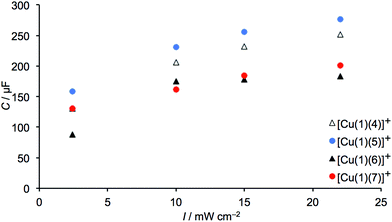 |
| | Fig. 16 Capacitance values of 3-day old DSCs containing dyes [Cu(1)(4)]+, [Cu(1)(5)]+, [Cu(1)(6)]+, [Cu(1)(7)]+. | |
Table 8 Impedance data obtained during measurements at 22 mW cm−2. EIS measurements are carried out 3 days after DSC assembly
| |
R
s/Ω |
R
rec/Ω |
C
μ/μF |
R
Pt/Ω |
C
Pt/μF |
τ/ms |
V
OC/mV |
η
/% |
|
The cell efficiency is that of the particular cell measured with EIS.
|
| [Cu(1)(4)]+ |
14.9 |
172.0 |
251.8 |
49.4 |
5.4 |
43.3 |
630 |
1.97 |
| [Cu(1)(5)]+ |
12.2 |
204.3 |
276.1 |
47.4 |
5.2 |
56.4 |
620 |
2.00 |
| [Cu(1)(6)]+ |
9.3 |
316.0 |
183.3 |
53.3 |
4.7 |
57.9 |
530 |
1.15 |
| [Cu(1)(7)]+ |
15.4 |
250.5 |
201.4 |
14.2 |
4.6 |
50.4 |
553 |
1.53 |
| [Cu(2)(5)]+ |
13.7 |
94.1 |
197.0 |
54.5 |
4.8 |
18.5 |
582 |
1.93 |
| [Cu(3)(5)]+ |
18.6 |
150.8 |
309.1 |
31.7 |
4.7 |
46.6 |
594 |
2.29 |
| [Cu(2)(7)]+ |
12.3 |
107.2 |
222.6 |
9.8 |
5.2 |
23.9 |
578 |
1.89 |
| [Cu(3)(7)]+ |
10.6 |
136.2 |
320.3 |
13.0 |
4.3 |
43.6 |
622 |
1.97 |
Table 9 Impedance data obtained during measurements at 2.4 mW cm−2. EIS measurements are carried out 3 days after DSC assembly
| |
R
s/Ω |
R
t/Ω |
R
rec/Ω |
C
μ/μF |
R
Pt/Ω |
C
Pt/μF |
τ/ms |
L
d/L (dimensionless) |
V
OC/mV |
| [Cu(1)(4)]+ |
14.9 |
192.8 |
1068.0 |
131.0 |
59.0 |
4.8 |
139.9 |
2.4 |
550 |
| [Cu(1)(5)]+ |
11.7 |
104.3 |
1242.0 |
158.5 |
52.8 |
4.7 |
196.9 |
3.5 |
550 |
| [Cu(1)(6)]+ |
7.0 |
288.6 |
2420.0 |
88.3 |
91.2 |
6.9 |
213.6 |
2.9 |
440 |
| [Cu(1)(7)]+ |
13.0 |
228.0 |
1723.0 |
130.1 |
16.0 |
8.6 |
224.1 |
2.7 |
493 |
| [Cu(2)(5)]+ |
12.3 |
251.2 |
738.0 |
93.2 |
59.0 |
5.8 |
68.8 |
1.7 |
510 |
| [Cu(3)(5)]+ |
16.4 |
67.8 |
917.4 |
182.0 |
35.3 |
4.4 |
166.9 |
3.7 |
520 |
| [Cu(2)(7)]+ |
11.6 |
203.3 |
787.1 |
109.0 |
13.2 |
8.8 |
85.8 |
2.0 |
516 |
| [Cu(3)(7)]+ |
10.6 |
44.1 |
999.3 |
178.0 |
14.8 |
3.9 |
177.9 |
4.8 |
539 |
The DSC with [Cu(1)(6)]+ has the highest Rrec, but also the lowest capacitance which in combination with the highest Rt value (Table 9) will counteract the transport of the injected electrons, resulting in a relatively poor performance. In Table 8, it is interesting that the monosubstituted ligands 5 and 7 give rise to a higher capacitance, indicating that the asymmetric structure enhances electron injection into the TiO2 leading to an increase in DSC efficiency. This is consistent with the photoconversion efficiences presented in Tables 2 and 6 and discussed earlier.
EIS measurements: DSCs with different anchoring ligands
Fig. 17 shows values of Rrec and τ for DSCs with dyes containing anchors 2 and 3 (with thienyl-spacers) and ancillary ligands 5 and 7. The value of VOC (Tables 8 and 9) is highest in measurements for dyes with anchor 3, consistent with conclusions based on J–V curves (see earlier discussion). Both the recombination resistance and the capacitance (Fig. 18) are higher for these dyes, and the transport resistance is lower. These factors all contribute to the higher photoconversion efficiencies of DSCs with dyes [Cu(3)(5)]+ and [Cu(3)(7)]+. As noted above, a higher Rt combined with a low Rrec limits the extent to which electrons are injected and at the same time, the resistance for the electron to recombine with the oxidized dye is low. This is the case for the measurements of DSCs with dyes containing anchor 2, where Ld/L is lower than in its counterpart with 3.
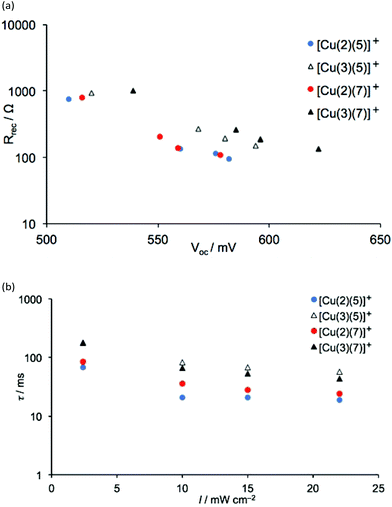 |
| | Fig. 17 (a) Plot of the recombination resistance against VOC, and (b) the electron lifetime as a function of bias-light intensity of 3-day old DSCs containing dyes [Cu(2)(5)]+, [Cu(3)(5)]+, [Cu(2)(7)]+ and [Cu(3)(7)]+. | |
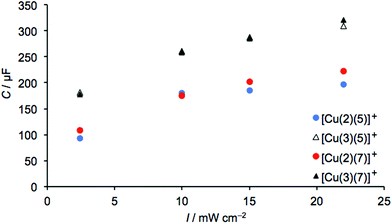 |
| | Fig. 18 Capacitance values of 3-day old DSCs containing dyes [Cu(2)(5)]+, [Cu(3)(5)]+, [Cu(2)(7)]+ and [Cu(3)(7)]+. | |
As discussed earlier and shown in eqn (4), a higher Rt may be accompanied by a higher Ecb which can reduce the charge injection efficiency. This will consequently decrease the VOC due to a lower density of electrons in the conduction band. This is demonstrated in Table 9 by comparing data for [Cu(2)(7)]+ and [Cu(3)(7)]+; anchor 3 lowers Rt by ∼60% and improves the VOC by more than 20 mV. When the conduction band level is very high in a SC, resulting in a large Rt, the phenomenon is observed in an EIS measurement as Gerischer resistance in the mid-range frequency region. This is effectively displayed as a distorted semi-circle in the plot of [Cu(2)(5)]+ in Fig. 19, where the EIS spectra from [Cu(2)(5)]+ and [Cu(3)(5)]+ are compared.
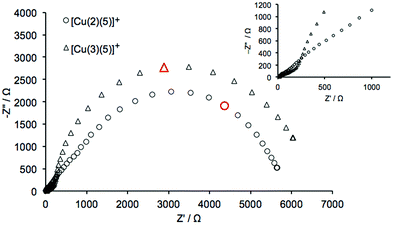 |
| | Fig. 19 Nyquist plots for [Cu(2)(5)]+ and [Cu(3)(5)]+ measured under a light intensity of 0.44 mW cm−2. The data points shown in red were measured at 0.3 Hz. The inset shows an expansion of the data measured in the high-to-mid frequency region. | |
Conclusions
The current work extends our previous investigation of the favourable effects of introducing CF3 groups into the ancillary ligands in [Cu(Lanchor)(Lancillary)]+ dyes in DSCs.17 A change from CH2Cl2 to acetone in the dye-bath during on-surface assembly of the heteroleptic dyes [Cu(1)(4)]+, [Cu(1)(5)]+ and [Cu(1)(6)]+ has only a small effect on DSC performance. The optimal dye in this series in terms of photoconversion efficiency and dye stability is [Cu(1)(5)]+. Achieving enhancement of DSC performance by replacing the phenyl spacer in anchor 1 by a 2-thienyl unit is dependent upon the position of substitution of the phosphonic acid group in the thienyl ring. Improved VOC is observed when the PO(OH)2 anchor is in the 4- rather than 5-position (i.e.3 is better than 2). Similar values of VOC are obtained on going from 1 to 3 with a given Lancillary, but on going from 1 or 3 to 2, there is an ≈50–60 mV drop in VOC; countering this, there is typically a gain in JSC when 2 is used as Lanchor. The best photoconversion efficienies are obtained for the dye [Cu(3)(5)]+ (η = 2.40% relative to a N719 reference of 5.76%).
The conclusions reached from plots of current-density (J) against potential (V), and external quantum efficiency spectra are supported by electrochemical impedance spectroscopic measurements. The EIS data showed that introducing CF3 in place of Me substituents into Lancillary dramatically lowers the transport resistance, Rt, and increases Cμ; Rt decreases and Cμ increases when Lancillary is 6-substituted rather than 6,6′-disubstituted. In agreement with J–V curves, EIS data for DSCs with dyes containing 5 or 7 combined 2 or 3 reveal that use of 3 results in a significant enhancement in VOC (particularly noteworthy when Lancillary = 7). Furthermore, on going from [Cu(3)(Lancillary]+ to [Cu(2)(Lancillary]+, Rt is dramatically increased (Lancillary = 5 or 7). Of the four dyes with thienyl spacers in the anchor that were tested, [Cu(3)(5)]+ (which has the highest photoconversion efficiency) has the second highest capacitance as well as a rather high Rrec together and the next lowest Rt, indicating that electrons are readily injected into the conduction band; the recombination rate is such that a high VOC results and, therefore, DSC performance improves.
Acknowledgements
We acknowledge the Swiss National Science Foundation (Grant number 200020_144500), the European Research Council (Advanced Grant 267816 LiLo), the Swiss Nano Institute (for the purchase of the EIS instrument), and the University of Basel for financial support. We thank Fabian Brunner and Sarah Keller for providing ligands, and Thomas Müntener for recording 600 MHz NMR spectra. Annika Büttner is thanked for providing the screen-printed electrodes, and we also acknowledge Dr Colin D. Martin for preliminary work on 4,4′-bis(thien-2-yl)-6,6′-dimethyl-2,2′-bipyridine. Res Jöhr and Drs Thilo Glatzel, Sebastian Fürer and Biljana Bozic-Weber are thanked for helpful discussions.
Notes and references
- C. E. Housecroft and E. C. Constable, Chem. Soc. Rev., 2015, 44, 8386 RSC.
- T. C. B. Harlang, Y. Liu, O. Gordivska, L. A. Fredin, C. S. Ponseca Jr., P. Huang, P. Chábera, K. S. Kjaer, H. Mateos, J. Uhlig, R. Lomoth, R. Wallenberg, S. Styring, P. Persson, V. Sundström and K. Wärnmark, Nat. Chem., 2015, 7, 883 CrossRef CAS PubMed.
- F. J. Malzner, S. Y. Brauchli, E. C. Constable, C. E. Housecroft and M. Neuburger, RSC Adv., 2014, 4, 48712 RSC.
- M. Sandroni, L. Favereau, A. Planchat, H. Akdas-Kilig, N. Szuwarski, Y. Pellegrin, E. Blart, H. Le Bozec, M. Boujtita and F. Odobel, J. Mater. Chem. A, 2014, 2, 9944 CAS.
- M. Sandroni, M. Kayanuma, A. Planchat, N. Szuwarski, E. Blart, Y. Pellegrin, C. Daniel, M. Boujtita and F. Odobel, Dalton Trans., 2013, 42, 10818 RSC.
- M. Sandroni, M. Kayanuma, M. Rebarz, H. Akdas-Kilig, Y. Pellegrin, E. Blart, H. Le Bozec, C. Daniel and F. Odobel, Dalton Trans., 2013, 42, 14628 RSC.
- E. Schönhofer, B. Bozic-Weber, C. J. Martin, E. C. Constable, C. E. Housecroft and J. A. Zampese, Dyes Pigm., 2015, 115, 154 CrossRef.
- B. Bozic-Weber, E. C. Constable, C. E. Housecroft, P. Kopecky, M. Neuburger and J. A. Zampese, Dalton Trans., 2011, 40, 12584 RSC.
- P. Péchy, F. P. Rotzinger, Md. K. Nazeeruddin, O. Kohle, S. M. Zakeeruddin, R. Humphry-Baker and M. Grätzel, J. Chem. Soc., Chem. Commun., 1995, 65 RSC.
- K. Hanson, M. K. Brennaman, A. Ito, H. Luo, W. Song, K. A. Parker, R. Ghosh, M. R. Norris, C. R. K. Glasson, J. J. Concepcion, R. Lopez and T. J. Meyer, J. Phys. Chem. C, 2012, 116, 14837 CAS.
- B. Bozic-Weber, S. Y. Brauchli, E. C. Constable, S. O. Fürer, C. E. Housecroft, F. J. Malzner, I. A. Wright and J. A. Zampese, Dalton Trans., 2013, 42, 12293 RSC.
- N. Armaroli, G. Accorsi, F. Cardinali and A. Listorti, Top. Curr. Chem., 2007, 280, 69 CrossRef CAS.
- C. E. McCusker and F. N. Castellano, Inorg. Chem., 2013, 52, 8114 CrossRef CAS PubMed.
- S. Y. Brauchli, F. J. Malzner, E. C. Constable and C. E. Housecroft, RSC Adv., 2015, 5, 48516 RSC.
- A. Büttner, S. Y. Brauchli, R. Vogt, E. C. Constable and C. E. Housecroft, RSC Adv., 2016, 6, 5205–5213 RSC.
- See for example: A. Abbotto and N. Manfredi, Dalton Trans., 2011, 40, 12421 RSC; L. Zhang and J. M. Cole, ACS Appl. Mater. Interfaces, 2015, 7, 3427 Search PubMed; P. Kumaresan, S. Vegiraju, Y. Ezhumalai, S. L. Yau, C. Kim, W.-H. Lee and M.-C. Chen, Polymers, 2014, 6, 2645 CrossRef CAS; A. Mishra, N. Pootrakulchote, M. K. R. Fischer, C. Klein, Md. K. Nazeeruddin, S. M. Zakeeruddin, P. Bäuerle and M. Grätzel, Chem. Commun., 2009, 7146 RSC.
- F. Brunner, M. Klein, S. Keller, C. D. Morris, A. Prescimone, E. C. Constable and C. E. Housecroft, RSC Adv., 2015, 5, 58694 RSC.
- B. Bozic-Weber, V. Chaurin, E. C. Constable, C. E. Housecroft, M. Meuwly, M. Neuburger, J. A. Rudd, E. Schönhofer and L. Siegfried, Dalton Trans., 2012, 41, 14157 RSC.
-
APEX2, version 2 User Manual, M86-E01078, Bruker Analytical X-ray Systems, Inc., Madison, WI, 2006 Search PubMed.
- P. W. Betteridge, J. R. Carruthers, R. I. Cooper, K. Prout and D. J. Watkin, J. Appl. Crystallogr., 2003, 36, 1487 CrossRef CAS.
- I. J. Bruno, J. C. Cole, P. R. Edgington, M. K. Kessler, C. F. Macrae, P. McCabe, J. Pearson and R. Taylor, Acta Crystallogr., Sect. B: Struct. Sci., 2002, 58, 389 CrossRef.
- C. F. Macrae, I. J. Bruno, J. A. Chisholm, P. R. Edgington, P. McCabe, E. Pidcock, L. Rodriguez-Monge, R. Taylor, J. van de Streek and P. A. Wood, J. Appl. Crystallogr., 2008, 41, 466 CrossRef CAS.
- F. Kröhnke, Synthesis, 1976, 1 CrossRef.
- V. Spampinato, N. Tuccitto, S. Quici, V. Calabrese, G. Marletta, A. Torrisi and A. Licciardello, Langmuir, 2010, 26, 8400 CrossRef CAS PubMed and references therein.
-
G. R. Desiraju and T. Steiner, The Weak Hydrogen Bond in Structural Chemistry and Biology, Oxford University Press, 1999, p. 5 Search PubMed.
- H. J. Snaith, Energy Environ. Sci., 2012, 5, 6513 Search PubMed.
- H. J. Snaith, Nat. Photonics, 2012, 6, 337 CrossRef CAS.
- F. J. Malzner, S. Y. Brauchli, E. Schönhofer, E. C. Constable and C. E. Housecroft, Polyhedron, 2014, 82, 116 CrossRef CAS.
- S. Y. Brauchli, F. J. Malzner, E. C. Constable and C. E. Housecroft, RSC Adv., 2014, 4, 62728 RSC.
- X. Chen, C. Jia, Z. Wan, J. Feng and X. Yao, Org. Electron., 2014, 15, 2240 CrossRef CAS.
- Q. Wang, J. E. Moser and M. Grätzel, J. Phys. Chem. B, 2005, 109, 14945 CrossRef CAS PubMed.
- I. S. Yahia, H. S. Hafez, F. Yakuphanoglu, B. F. Senkal and M. S. A. Abdel Mottaleb, Synth. Met., 2011, 161, 1299 CrossRef CAS.
- R. Kern, R. Sastrawan, J. Ferber, R. Stangl and J. Luther, Electrochim. Acta, 2002, 47, 4213 CrossRef CAS.
- J.-L. Lan, T.-C. Wei, S.-P. Feng, C.-C. Wan and G. Cao, J. Phys. Chem. C, 2012, 116, 25727 CAS.
-
J. Bisquert and F. Fabregat-Santiago, in Dye-Sensitized Solar Cells, ed. K. Kalyanasundaram, EPFL Press, 2010, p. 492 Search PubMed.
- J. Bisquert, F. Fabregat-Santiago, I. Mora-Seró, G. Garcia-Belmonte and S. Gimènez, J. Phys. Chem. C, 2009, 113, 17278 CAS.
- F. Fabregat-Santiago, J. Bisquert, G. Garcia-Belmonte, G. Boschloo and A. Hagfeldt, Sol. Energy Mater. Sol. Cells, 2005, 87, 117 CrossRef CAS.
Footnote |
| † Electronic supplementary information (ESI) available: Synthesis of precursors. Fig. S1–S4: additional NMR spectra; Scheme S3: competing reactions in the conversion of 4,4′-bis(5-bromothiophen-2-yl)-6,6′-dimethyl-2,2′-bipyridine to 2a, and characterization data of side-products; Fig. S5 ORTEP figure of 4,4′-bis(thiophen-2-yl)-6,6′-dimethyl-2,2′-bipyridine; Fig. S6–S8: additional J–V curves and EQE spectra; Table S1: parameters for DSCs with N719; Tables S2 and S3: DSC parameters; Tables S4 and S5: EIS data. CCDC 1435291 and 1436307. For ESI and crystallographic data in CIF or other electronic format see DOI: 10.1039/c6dt00166a |
|
| This journal is © The Royal Society of Chemistry 2016 |
Click here to see how this site uses Cookies. View our privacy policy here.  Open Access Article

![[thin space (1/6-em)]](https://www.rsc.org/images/entities/char_2009.gif) 600), 299 (59
600), 299 (59![[thin space (1/6-em)]](https://www.rsc.org/images/entities/char_2009.gif) 500). Satisfactory elemental analysis could not be obtained.
500). Satisfactory elemental analysis could not be obtained.
![[thin space (1/6-em)]](https://www.rsc.org/images/entities/char_2009.gif) 000), 293 (34
000), 293 (34![[thin space (1/6-em)]](https://www.rsc.org/images/entities/char_2009.gif) 500). ESI-MS m/z 621.1 [M + H] (calc. 621.1). Found C 54.44, H 5.89, N 4.40; C28H34N2O6P2S2 requires C 54.19, H 5.52, N 4.51%.
500). ESI-MS m/z 621.1 [M + H] (calc. 621.1). Found C 54.44, H 5.89, N 4.40; C28H34N2O6P2S2 requires C 54.19, H 5.52, N 4.51%.
![[thin space (1/6-em)]](https://www.rsc.org/images/entities/char_2009.gif) 840 reflections, 2723 unique, Rint = 0.036. Refinement of 2268 reflections (181 parameters) with I > 2σ(I) converged at final R1 = 0.0382 (R1 all data = 0.0473), wR2 = 0.0931 (wR2 all data = 0.0988), gof = 0.9296. CCDC 1435291.
840 reflections, 2723 unique, Rint = 0.036. Refinement of 2268 reflections (181 parameters) with I > 2σ(I) converged at final R1 = 0.0382 (R1 all data = 0.0473), wR2 = 0.0931 (wR2 all data = 0.0988), gof = 0.9296. CCDC 1435291.


![[thin space (1/6-em)]](https://www.rsc.org/images/entities/char_2009.gif) 1 were assembled (see Experimental section). The reproducibility of plots of current density (J) against potential (V) are confirmed in Fig. S6;† Table S1† gives the performance parameters of the N719 DSCs which show only small variation between devices. In the discussion that follows, average values (Table S1†) of short-circuit current density (JSC), open-circuit voltage (VOC), fill-factor (ff) and photoconversion efficiency (η) for N719 are used.
1 were assembled (see Experimental section). The reproducibility of plots of current density (J) against potential (V) are confirmed in Fig. S6;† Table S1† gives the performance parameters of the N719 DSCs which show only small variation between devices. In the discussion that follows, average values (Table S1†) of short-circuit current density (JSC), open-circuit voltage (VOC), fill-factor (ff) and photoconversion efficiency (η) for N719 are used.


