DOI:
10.1039/C5DT02761F
(Paper)
Dalton Trans., 2016,
45, 4647-4658
Tuning the Mn valence state in new Ca0.66Mn2−xAlxO4 (x ≤ 0.4) oxides: impact on magnetic and redox properties†
Received
20th July 2015
, Accepted 27th January 2016
First published on 9th February 2016
Abstract
New Ca0.66Mn2−xAlxO4 (x ≤ 0.4) solid solutions crystallizing with the CaFe2O4-type structure (SG: Pnma) were synthesized for the first time by the glycine-nitrate process. The structures were determined on the basis of XRD Rietveld analysis and electron diffraction investigation. While the CaMn3O6 (‘Ca0.66Mn2O4’) oxide adopts a monoclinic unit cell, the Al substitution for Mn (x = 0.2, 0.4) leads to an orthorhombic cell with only two Mn atomic positions, with different valence states, and 33% of Ca sites empty. The Ca molar concentration decreases down to 0.6 in order to increase the Mn valence leading to a phase mixture, whereas a slight Ca content increase up to 0.7 leads to a decrease of Mn valence in the pure phase. The Al3+ ions are located at a specific Mn site because their ionic radii are close to that of Mn4+ and a more isotropic environment. The unit cell parameters and volume strongly decrease for a low Al content and tend to an asymptotic value of x = 0.33–0.4, around the limit of solubility. As the Al content increases, the Mn valence state in the same slightly distorted octahedral site increases up to 4+ whereas the other octahedral site is highly elongated and corresponds mainly to Jahn–Teller Mn3+. At x = 0.33, these two Mn sites correspond to Mn4+ and Mn3+ respectively. Moreover, the aluminium content increase induces a weakening of the global antiferromagnetic long range interactions between the ferromagnetic chains. The Al substitution leads to the change of the Mn valence distribution as well as the unit cell symmetry of the CaMn3O6 phase. These 1D tunnel networks stabilizing the Mn3+/Mn4+ valence states can be reduced under Ar/5%H2 between T = 300 °C and T = 600 °C (heating rate = 2 °C min−1) into pure Mn2+ rocksalt solid solution despite the large difference in ionic radii. The re-oxidation leads to the same CaFe2O4-type structure and several redox cycles can be operated. The relationship between the two double chains of the edge-sharing octahedral sites and the rocksalt-type framework is clear and should appear as the driving force for the structural transformation during the reduction/oxidation processes. Finally, Al substitution allows an increasing of the Mn–O bond covalence and consequently the reduction in temperature.
Introduction
Ceria (CeO2) being well established as an oxygen buffer is widely used as a base oxide in catalysis in which oxidation–reduction processes are involved.1,2 The capability to store oxygen ions and the creation of anionic vacancies in the fluorite-type networks are associated with the valence change of Ce between Ce4+ (4f0) and Ce3+(4f1) ions.3 In order to improve the reducing properties, the oxygen storage capacity (OSC) and the thermal stability of cerium oxide, Ce1−xZrxO2 solid solutions have been widely investigated.4,5 It was shown that cation site distortions, as well as cationic ordering, play a key role in redox properties. More recently, because of Pr4+'s (4f1) higher fourth ionization potential, which is likely less stable and easier to reduce, the Pr1−xZrxO2−y solid solution was studied in order to show the impact of Pr cations on redox properties.6 As expected, the Pr4+ reduction in these oxides occurs at 300 °C ≤ T ≤ 550 °C whereas the Ce4+ reduction takes place mainly at T ≥ 450 °C.6
In place of the fluorite network oxides with rare-earth ions as reducible species, perovskite oxides with Mn3+ and Mn4+ ions were investigated by redox processes mainly because Mn4+ (3d3) can be stabilized at high temperatures under air and exhibits a larger fourth ionization potential than Ce4+ and Pr4+ respectively. Furthermore in the intermediate reduced state, Mn3+ (3d4) corresponds to a Jahn–Teller ion stabilized in distorted octahedral and/or pentahedral sites due to the stabilization of oxygen vacancies.7–9 This distortion is expected to favor oxygen mobility into the oxide networks.8 Particularly, topotactic CaMnO3–CaMnO2 reduction–oxidation cycles occur between the perovskite-type and rock-salt type networks showing the occurrence of short range ordered domains with peculiar Ca/Mn organization into a NaCl-type matrix.10 The description of the rocksalt-type structure by stacking Ca/Mn planes along the (111) direction shows a clear relationship with the perovskite-type network.10 Moreover, the Mn4+ reduction under an Ar/H2 atmosphere in CaMnO3 begins at moderate temperature around T = 400 °C and reaches the Mn2+ state in CaMnO2 at T = 650 °C.
In the alkaline earth series, the choice of Ca2+ associated with Mn4+/Mn3+ valence states is among the most promising to obtain the lowest reduction temperatures because of its smaller ionic radius creating less Ca–O ionic bonding (compared to Sr–O or Ba–O). This induces more ionic Mn4+/3+–O bonds and leads to the reduction of Mn at lower temperatures.11 In order to increase the concentration of the reducible species, special attention has been paid to the phases with an atomic ratio Mn/Ca ≫ 1. That is why the Ca–Mn–O phase diagram proposed by Horowitz and Longo12 was investigated, identifying several line compounds in the Mn-rich region with a 1D tunnel structure-type. CaMn2O4 (SG: Pbnm, one Mn3+ crystallographic site)13–16 and/or CaMn3O6 (SG: P21/a, two Mn(4−δ)+ and four Mn(3+δ)+ crystallographic sites) compounds are built from double rutile chains forming the 3D framework enclosing Ca2+ ions. These ions are located in the 1D channels and have an eight-fold coordination with oxygen ions.17 Consequently, the connectivity with the edge-sharing and corner-sharing MnO6 octahedra characterizing these 1D tunnel structures differs from that identified in the CaMnO3 perovskite. The relationship with the rocksalt-type network is evident from the double rutile chains. Each octahedron shares four edges with other octahedra with the M–M distances (M = transition metal) varying from 2.8 to 3.2 Å.13,17,18
To improve the redox properties, starting from CaMn3O6 compounds, there are two ways that can be considered to increase the Mn4+ content. One consists in decreasing the Ca concentration12,19,20 to reach a Ca/Mn atomic ratio equal to 1/4 (CaMn4O8). Here another tunnel structure is stabilized with two kinds of architectures for the channels: single chains of edge-sharing (Mn4+O6) octahedra and single chains of edge-sharing (Mn3+O5) pyramids with a high tendency of charge ordering of the manganese ions.20 The other way is by substituting lower valence cations for Mn sites such as Fe3+ or Al3+. Interestingly, a solid state chemistry investigation of Ca1−yMn2−xFexO4 (0 ≤ x ≤ 1.55) solid solutions was recently done. It was shown that the oxides adopt the CaFe2O4-type structure where the number of Ca-vacancies (y) increases with the Mn content and tends to y = 1/4 for a low Fe concentration.21 Further, the CaMn3O6 framework with six different Mn4+/3+ atomic positions derives from the CaFe2O4-type structure (SG: Pnma) with only two different Fe3+ crystallographic sites.13,17,18 The CaMn3O6 tunnel structure contains cationic vacancy ordering located in the 1D-channels with a 1-2-type ordering of one vacancy and two calcium ions giving the chemical formula Ca2/3Mn2O4 which describes the relationship with the CaFe2O4-type structure.
The approach reported here is dedicated to Al3+ substitution in order to understand the dependence of the redox properties of Mn2+/3+/4+ on the Al content. Therefore, the Ca2/3Mn2−xAlxO4 solid solution has been investigated by fixing a lower Ca content in order to increase the Mn valence. In this study, we discuss the synthesis and structural characterization by transmission electron microscopy and Rietveld refinement of powder XRD diagrams. The analysis of Mn/Al local environments and the associated magnetic properties allows the variation of Mn valence states to be followed. Finally, the TGA (thermogravimetric analysis) measurements, under reducing and oxidizing atmospheres, allow the redox properties, which have to be correlated to the chemical composition and the structural features, to be evaluated.
Experimental section
The complex Ca0.66Mn2−xAlxO4 oxides have been prepared by the self-combustion synthesis method (glycine nitrate process) using glycine,22–24 Ca2+ and Mn2+ nitrate solutions and Al(NO3)3·9H2O powder. The Ca solution has been accurately titrated by potentiometry using Ca-ion selective electrodes. The Mn content in the solution has been determined by complexometric titration of Mn2+ with EDTA (Ethylene Diamine Tetraacetic Acid). Stoichiometric amounts of Ca, Mn and Al nitrates were mixed while stirring. Glycine, in granular form, was added to a glycine/metal molar ratio of 2 in order to ensure optimum cation chelation. The solution was then heated to approximately 100 °C to evaporate excess water until a viscous solution was obtained. The gel was introduced into a 4 L stainless steel beaker on a hot plate at 220 °C and self-combustion occurred naturally. The beaker was covered with a stainless-steel openwork lid to contain the as-produced ashes while allowing the gases to escape. The ashes were annealed in air at 850 °C for 12 hours.
Powder X-ray diffraction patterns were obtained on a Phillips X'Pert MPD X-ray diffractometer with the Bragg–Brentano geometry using Cu Kα1/Kα2 radiation (10° < 2θ < 80° range, step of 0.017° and counting time of 500 s). Three diffractograms (Cu Kα1 = 1.5406 Å, 10° < 2θ < 130° range, step of 0.008° and counting time of 2000 s) and related structures corresponding to x = 0, 0.2 and 0.4 (Al content) compositions have been refined using the Rietveld method and Fullprof package of programs with conventional reliability factors. Unit cell parameters, atomic positions, occupancies and Debye–Waller factors have been refined for each composition. Three different Debye–Waller factors have been determined for Ca, Mn/Al and O atomic positions respectively. The distribution of Al atoms in two different Mn sites were first considered and the partial occupancies then refined. Then, on the basis of Mn/Al–O bond distance analysis, only one atomic position has been taken into account for the Al atoms.
Electron diffraction experiments and the reconstruction of reciprocal space were carried out on a JEOL 2100 microscope, equipped with a double tilt specimen stage, operating at 200 kV. The powder was suspended in ethanol and a few drops of this was placed on a carbon-coated copper grid and air-dried before observation.
The magnetization measurements were performed on powder samples with a Quantum Design MPMS-5 (S.Q.U.I.D) magnetometer. Zero-field cooled data were collected with an applied field of 10 kOe and with increasing temperature from 4 K to 400 K. Field dependence on magnetization curves have been recorded with a magnetic field from 0 to 50 kOe at temperatures of 4 K, 150 K and 300 K.
The thermogravimetric analysis (TGA) has been carried out on SETARAM Setsys with evolution under Ar/5% H2 flux (50 ml min−1) and a heating rate of 5 °C min−1 up to 700 °C, then in air (50 ml min−1) with a heating rate of 5 °C min−1 up to 850 °C. Other TGA experiments have been performed only under Ar/5% H2 with a lower heating rate of 2 °C min−1 in order to compare the reduction steps observed for various compositions.
Results and discussion
Structure analysis by electron diffraction and powder XRD
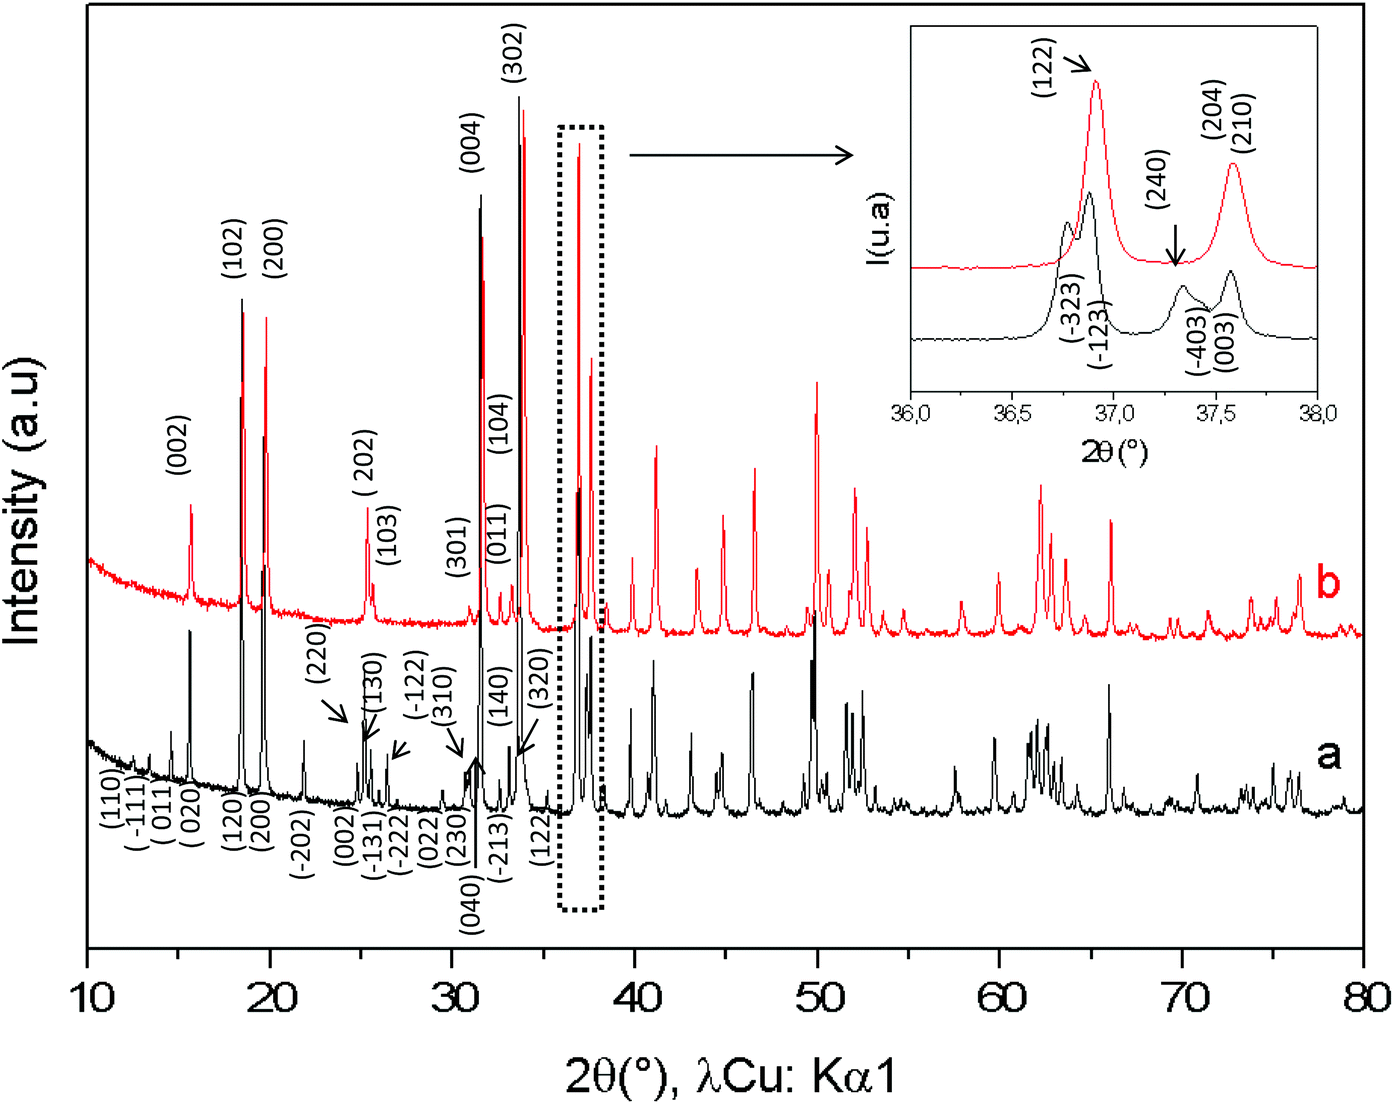
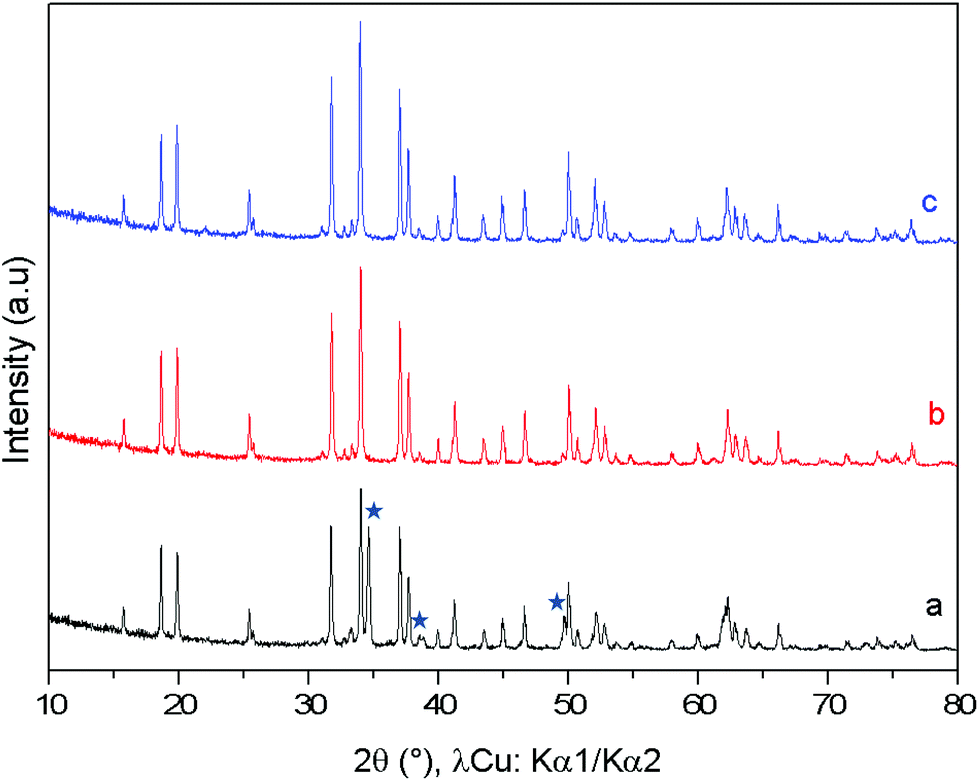
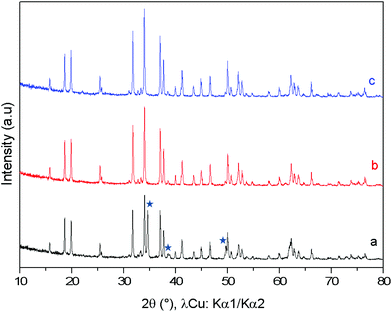
The comparison between the XRD diagrams of CaMn3O6 and Ca0.66Mn1.6Al0.4O4 (denoted as Al04) oxides shows the absence of superstructure diffraction lines at low 2θ angles in the case of the Al-substituted compound (Fig. 1 and S1†). These superstructure peaks are associated with the monoclinic unit cell (SG: P21/a) for CaMn3O6 (Fig. S2, Table S1†). Furthermore, it is noteworthy that several high intensity XRD peaks of an Al04 sample exhibit no splitting (see the enlargement around 2θ = 37° in Fig. 1 inset). All the XRD peaks of the Al04 oxide can be indexed on the basis of an orthorhombic unit cell of a CaFe2O4-type structure (SG: Pnma) with relationships of the lattice vectors of the orthorhombic subcell and the monoclinic supercell given by the following matrix relation:
 |
| | Fig. 1 X-ray powder diffraction patterns of (a) CaMn3O6![[double bond, length as m-dash]](https://www.rsc.org/images/entities/char_e001.gif) Ca0.66Mn2O4 (monoclinic unit cell, SG: P21/a) and (b) Ca0.66Mn1.6Al0.4O4 (orthorhombic unit cell, SG: Pnma) compounds. (hkl) Indexations at low 2Θ angles are mentioned. Ca0.66Mn2O4 (monoclinic unit cell, SG: P21/a) and (b) Ca0.66Mn1.6Al0.4O4 (orthorhombic unit cell, SG: Pnma) compounds. (hkl) Indexations at low 2Θ angles are mentioned. | |
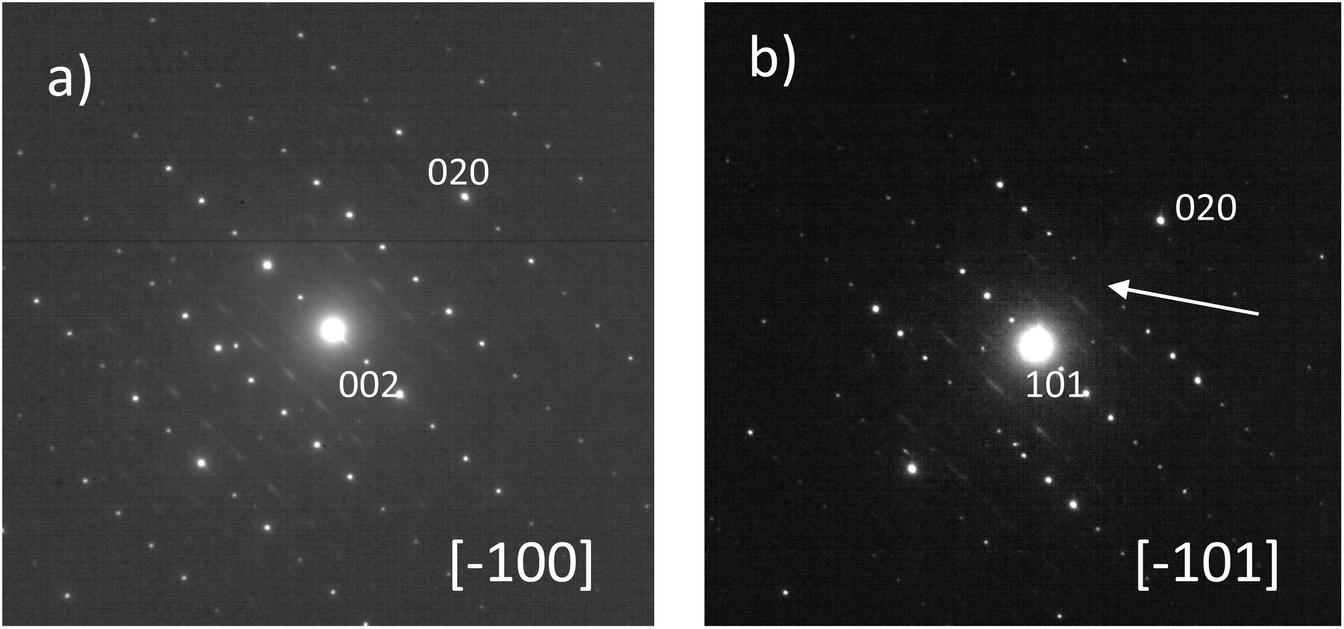
In order to conclude definitively about this change of symmetry, electron diffraction investigation of the Al04 sample has been performed and the reciprocal space has been reconstructed. An orthorhombic unit cell can be easily identified and the unit cell parameters a ≈ 8.9 Å, b ≈ 2.8 Å and c ≈ 11.3 Å are close to those found for the CaFe2O4-type structure.14,21 The electron diffraction pattern corresponding to the [−1 0 0] and [−1 0 1] zone axe are shown in Fig. 2. No general reflection condition was observed which implies a P Bravais lattice. On the [−1 0 0] zone axis pattern, the reflection condition k + l = 2n is consistent with an n glide plane. The arrow on the [−1 0 1] zone axis pattern, obtained with a precession angle of 2.5°, shows the absence of the 010 reflection in accordance with the Pnma space group. In addition to these clear reflections, weak diffuse lines are also visible. Their presence indicates a tendency for additional local ordering.
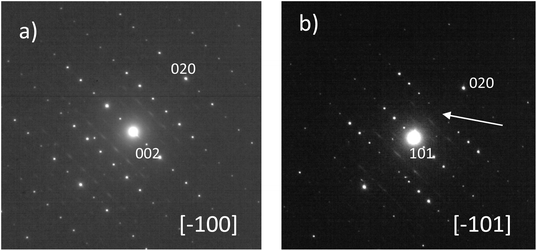 |
| | Fig. 2 Electron diffraction patterns corresponding to (a) [−100] and (b) [−101] zone axis for Ca0.66Mn1.6Al0.4O4 oxide. The condition 0kl k + l = 2n is observed on the [−100] zone axis pattern. The arrow indicates the absence of the 010 reflection consistent with the Pnma space group. | |
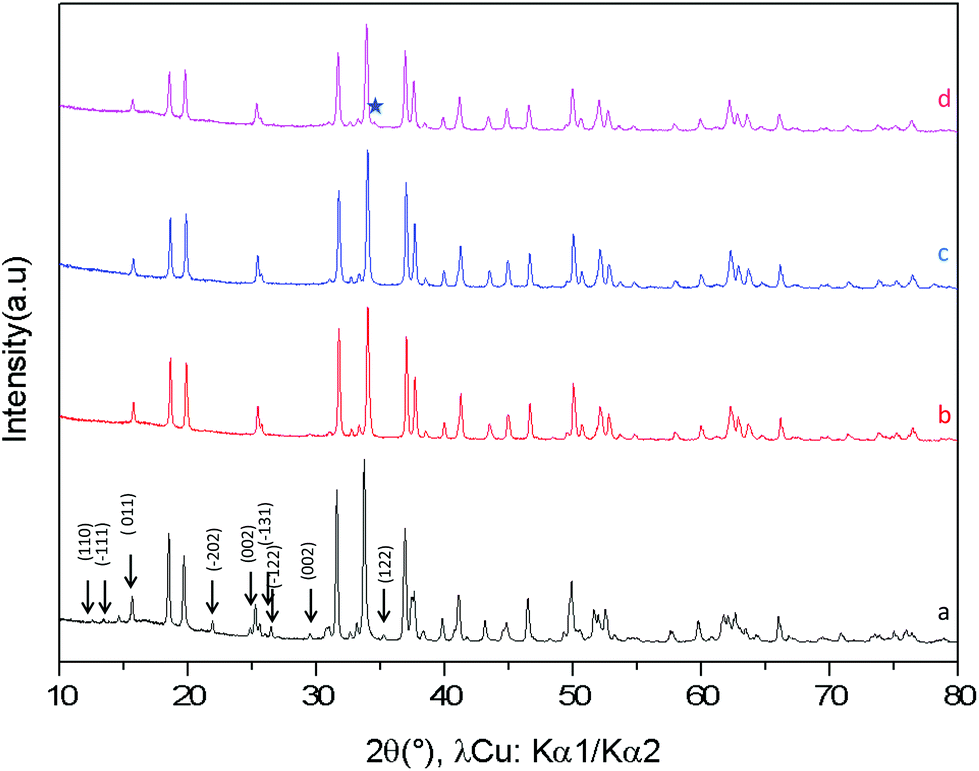
The XRD diagrams of Ca0.66Mn2−xAlxO4 compositions (x = 0, 0.2, 0.4, 0.47) are shown in Fig. 3 and S3.† By decreasing the Al content from x = 0.4 to x = 0.2 (denoted as Al02), the XRD superstructure lines of the monoclinic unit cell are still absent (Fig. 3) and all the peaks can also be indexed on the basis of an orthorhombic unit cell with the Pnma space group. In contrast, by increasing the Al content from x = 0.4 to x = 0.47 a small shoulder on the right of the main peak (marked with a star in Fig. 3 and S3†) is seen corresponding to the main XRD line of the Ca2(Mn,Al)2O5 Brownmillerite-type phase.8 Only the x = 0.47 composition is not single phase. All these results allow a definitive conclusion that the Ca0.66Mn1.6Al0.4O4 oxide adopts the CaFe2O4-type framework with a large content of Ca vacancies and that Al3+ substitution suppresses the 1-2-type long range ordering of one vacancy and two calcium cations in CaMn3O6.
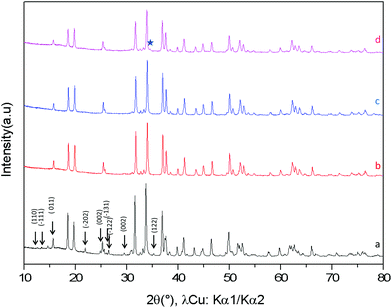 |
| | Fig. 3 X-ray powder diffraction patterns of Ca0.66Mn2−xAlxO4 (0 < x ≤ 0.47) (a) x = 0, (b) x = 0.2, (c) x = 0.4 and (d) x = 0.47. For x = 0.47, the major diffraction peak of the impurity phase (Brownmillerite-type phase) is marked by a star. | |
Rietveld refinements of powder XRD data of Ca0.66Mn2−xAlxO4 compositions (x = 0, 0.2, 0.4) have been carried out and are shown in Fig. S2 and 4 and 5 respectively. The atomic positions, the unit cell parameters and volume are reported in Table 1. In the CaFe2O4-type network, two different crystallographic sites for transition metals at (x, 1/4, z) can be identified. In the first structural hypothesis, one considers that Al3+ ions are distributed over the two transition metal crystallographic sites. Al occupancies for these two atomic positions have been refined (Tables S1 and S2†) considering that the atomic number (Z) of Mn (Z = 25) and Al (Z = 13) are very different (see Tables S2a and b†). For Al02 and Al04 compounds, the occupancies are higher in the Mn2 sites and are equal to 0.144(1) and 0.246(1) respectively. Moreover, the analysis of Mn/Al–O bond distances shows for both these compositions two very different local environments for Mn/Al atoms which do not vary versus the Al concentration. The Mn2O6 octahedra, where Al atoms are mainly located, are the most regular with Mn2–O bond distances between 1.90 Å and 1.98 Å. The <Δ> average of differences between the Mn2–O distance and the average distance is small and equal to 0.03 Å (Tables S2a and b†). The average Mn/Al–O bond distance equal to 1.94 Å is in good agreement with Mn4+ (r[6] = 0.53 Å) or Al3+ (r[6] = 0.54 Å) ionic radii. However, the second octahedra corresponding to the Mn1 atomic position is highly elongated with 4 equatorial Mn–O bond distances around 1.92 Å and two apical ones around 2.22 Å and 2.30 Å regardless of the chemical composition. The <Δ> average of differences between the Mn/Al–O distances and the average Mn/Al–O distance is larger and equal to 0.15 Å (Tables S2a and b†). If these distorted octahedra are the signature of a Mn3+ Jahn–Teller ion, the location of Al atoms in these sites is highly improbable because of Al3+'s smaller ionic radius and its isotropic character. Therefore, a second structural hypothesis was taken into account where all Al atoms occupy partially only the Mn2 sites (Table 2). The refinements are correct with rather low reliability factors (Bragg factors equal to 7.0% and 8.8% for Al04 and Al02 samples respectively). They are close to those obtained for the first structural hypothesis (in this case, Bragg factors equal to 6.4% and 8.7% for Al04 and Al02 samples respectively). The Mn/Al–O bond distances are not strongly affected by this new Al distribution. The comparison between the Mn1 site and the Mn3+ local environments in Ca0.75Mn2O4![[thin space (1/6-em)]](https://www.rsc.org/images/entities/char_2009.gif) 21 (SG: Pnma, 1 Mn3+ and 1 Mn3.5+) oxides shows that the distortion induced by the Jahn–Teller effect is almost always identical in these 1D tunnel frameworks with four short distances around 1.92 Å and two longer ones around 2.20 Å and 2.30 Å. The other Mn3.5+ site in Ca0.75Mn2O421 is also larger and more distorted (distances varying from 1.92 Å to 2.08 Å) than the Mn2 site with a random distribution of Mn4+ and Al3+ (distances from 1.90 Å to 1.98 Å), showing a strong increase of the Mn valence state in the Mn2 site. On the basis of these latter refinements, the following chemical formulae can be written: Ca0.66(Mn3+)(Mn0.674+Mn0.333+)O4, Ca0.66(Mn3+)(Mn0.674+Mn0.133+Al0.2)O4 and Ca0.66(Mn0.933+Mn0.074+)(Mn0.64+Al0.4)O4 for undoped, Al02 and Al04 samples respectively. In site 1, the Mn1 valence state remains equal to +3 for x = 0 and x = 0.2, then increases to +3.07 for x = 0.4. However, in site 2, the Mn valence state increases continuously from +3.66 (x = 0) to +3.84 (x = 0.2), then +4 (x = 0.4). In the x = 0.33 target composition, site 1 would be fully occupied by Mn3+ and site 2 would contain 2/3 of Mn4+ and 1/3 of Al3+. The two different structures corresponding to CaMn3O6Ca0.66Mn2O4 (monoclinic symmetry, 2 Mn(4−δ)+ sites and 4 Mn(3+δ)+) and Ca0.66(Mn2−xAlx)O4 (x = 0.2 and 0.4, orthorhombic symmetry, 1 Mn(3+δ)+ site and 1 Mn(4−δ)+ site) are shown in Fig. 6. When Al is substituted in Ca0.66Mn2−xAlxO4, the 1-2-type long range ordering of one vacancy and two calcium cations in CaMn3O6 is suppressed. In the Al-substituted phases, the building blocks of the framework correspond to two rutile double chains with trivalent Mn cations in one site and in the other ones tetravalent and trivalent cations are arranged in a chessboard pattern in relation with the CaFe2O4 network.
21 (SG: Pnma, 1 Mn3+ and 1 Mn3.5+) oxides shows that the distortion induced by the Jahn–Teller effect is almost always identical in these 1D tunnel frameworks with four short distances around 1.92 Å and two longer ones around 2.20 Å and 2.30 Å. The other Mn3.5+ site in Ca0.75Mn2O421 is also larger and more distorted (distances varying from 1.92 Å to 2.08 Å) than the Mn2 site with a random distribution of Mn4+ and Al3+ (distances from 1.90 Å to 1.98 Å), showing a strong increase of the Mn valence state in the Mn2 site. On the basis of these latter refinements, the following chemical formulae can be written: Ca0.66(Mn3+)(Mn0.674+Mn0.333+)O4, Ca0.66(Mn3+)(Mn0.674+Mn0.133+Al0.2)O4 and Ca0.66(Mn0.933+Mn0.074+)(Mn0.64+Al0.4)O4 for undoped, Al02 and Al04 samples respectively. In site 1, the Mn1 valence state remains equal to +3 for x = 0 and x = 0.2, then increases to +3.07 for x = 0.4. However, in site 2, the Mn valence state increases continuously from +3.66 (x = 0) to +3.84 (x = 0.2), then +4 (x = 0.4). In the x = 0.33 target composition, site 1 would be fully occupied by Mn3+ and site 2 would contain 2/3 of Mn4+ and 1/3 of Al3+. The two different structures corresponding to CaMn3O6Ca0.66Mn2O4 (monoclinic symmetry, 2 Mn(4−δ)+ sites and 4 Mn(3+δ)+) and Ca0.66(Mn2−xAlx)O4 (x = 0.2 and 0.4, orthorhombic symmetry, 1 Mn(3+δ)+ site and 1 Mn(4−δ)+ site) are shown in Fig. 6. When Al is substituted in Ca0.66Mn2−xAlxO4, the 1-2-type long range ordering of one vacancy and two calcium cations in CaMn3O6 is suppressed. In the Al-substituted phases, the building blocks of the framework correspond to two rutile double chains with trivalent Mn cations in one site and in the other ones tetravalent and trivalent cations are arranged in a chessboard pattern in relation with the CaFe2O4 network.
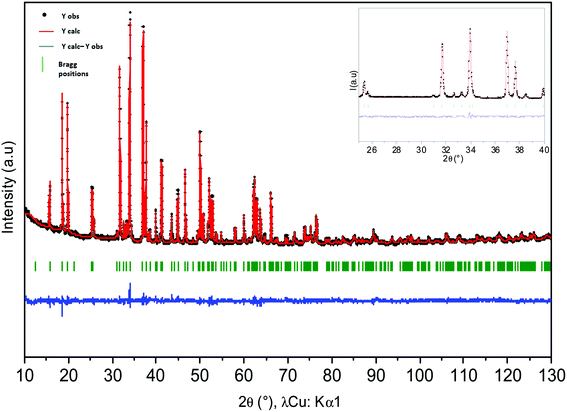 |
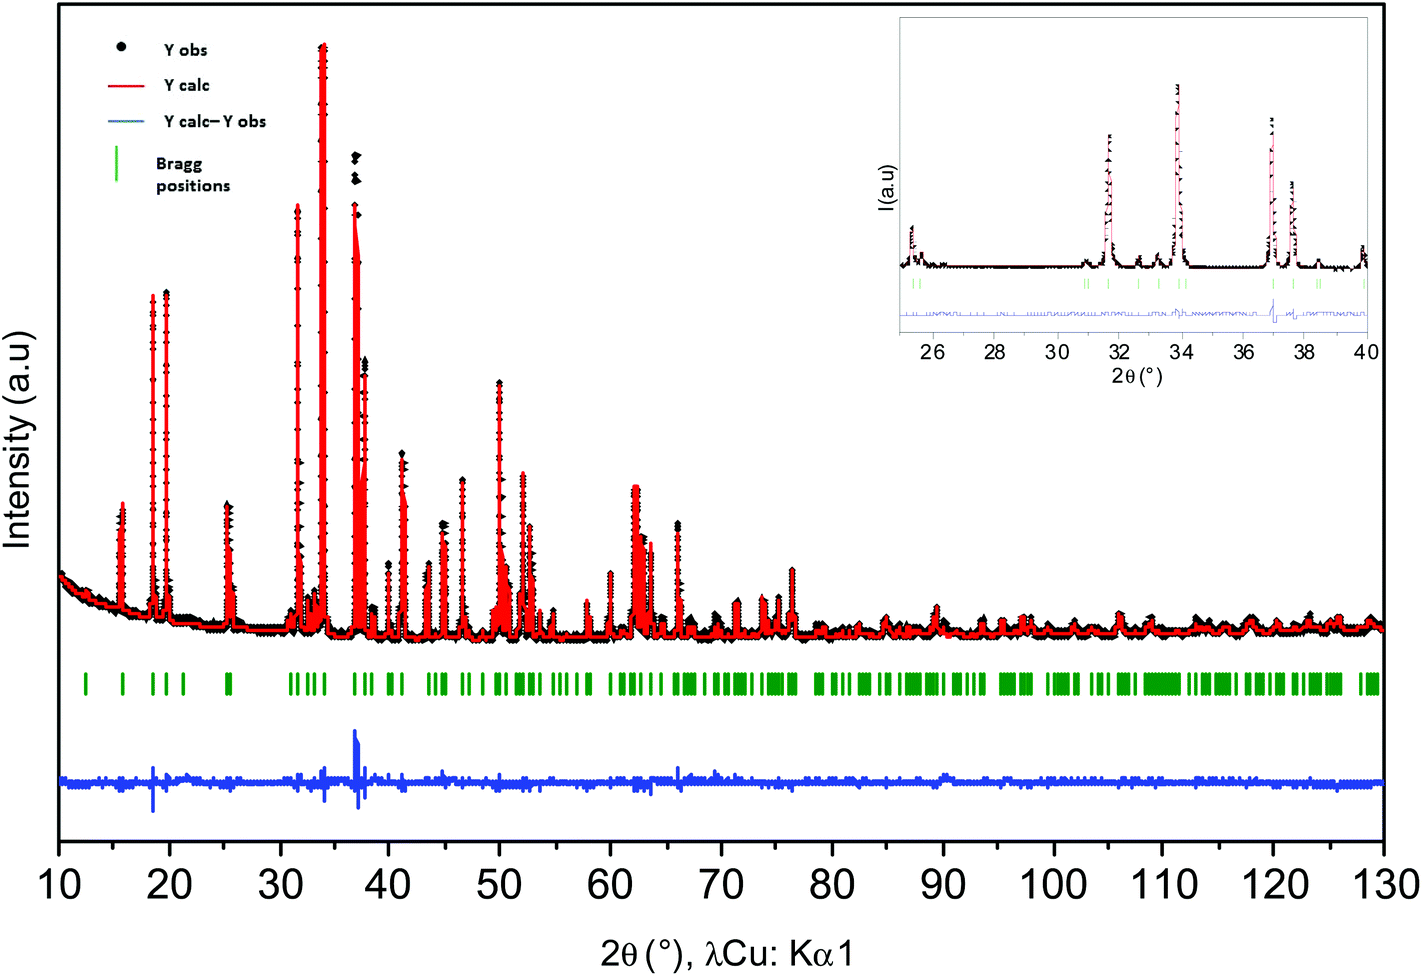
| | Fig. 4 Rietveld refinement of X-ray powder diffraction patterns of Ca0.66Mn1.6Al0.4O4 compound. Calculated (in red), observed (in black), difference (in blue) patterns are represented. Bragg peaks (in green) are mentioned. Structural hypothesis: all Al3+ ions are located in site 2 (Mn4+). | |
 |
| | Fig. 5 Rietveld refinement of X-ray powder diffraction patterns of Ca0.66Mn1.8Al0.2O4 compound. Calculated (in red), observed (in black), difference (in blue) patterns are represented. Bragg peaks (in green) are mentioned. Structural hypothesis: all Al3+ ions are located in site 2 (Mn4+). | |
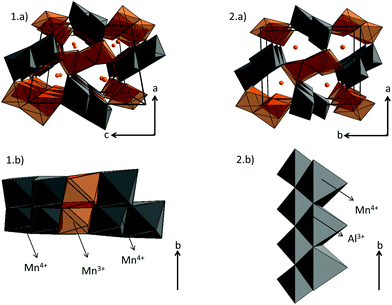 |
| | Fig. 6 Structural representation of (1.a) CaMn3O6Ca0.66Mn2O4 (monoclinic unit cell, SG: P21/a, 6 Mn sites: 4 Mn3+ in orange and 2 Mn4+ in grey) and (2.a) Ca0.66Mn2−xAlxO4 (x = 0.2 and 0.4) (orthorhombic unit cell, SG: Pnma, 2 Mn sites: 1 Mn3+ in orange and 1 Mn4+/Al3+ in grey) compounds. The linkage of double chains viewed perpendicular to the b axis is presented in (1.b) for Ca0.66Mn2O4 and in (2.b) for Ca0.66Mn2−xAlxO4 (x = 0.33: all Mn3+ are substituted by Al3+ ions). | |
Table 1 Atomic positions and unit cell parameters determined by Rietveld (Fig. 4 and 5) from powder X-ray diffraction data of Ca0.66Mn2−xAlxO4 (x = 0.2 and x = 0.4) oxides. The reliability factors CRp, CRwp and RBragg are mentioned. Structural hypothesis: all Al atoms are located in the Mn2 site (Mn4+)
| Atoms |
Wyckoff positions |
x (Al) |
x
|
y
|
z
|
Biso [Å2] |
Occupancy |
| Ca1 |
4c |
0.2 |
0.2439(2) |
¼ |
0.3324(1) |
2.87(5) |
0.66 |
|
|
|
0.4 |
0.2439(4) |
¼ |
0.3315(2) |
4.49(9) |
0.66 |
| Mn1 |
4c |
0.2 |
0.0692(1) |
¼ |
0.11123(6 |
0.32(1) |
1 |
|
|
|
0.4 |
0.0701(2) |
¼ |
0.1105(1)) |
0.28(1) |
1 |
| Mn2 |
4c |
0.2 |
0.0837(1) |
¼ |
0.59452(7) |
0.32(1) |
0.8 |
|
|
|
0.4 |
0.0841(2) |
¼ |
0.0841(2) |
0.28(1) |
0.6 |
| Al2 |
4c |
0.2 |
0.0837(1) |
¼ |
0.59452(7) |
0.32(1) |
0.2 |
|
|
|
0.4 |
0.0841(2) |
¼ |
0.5942(1) |
0.28(1) |
0.4 |
| O1 |
4c |
0.2 |
0.2935(3) |
¼ |
0.6506(2) |
0.39(2) |
1 |
|
|
|
0.4 |
0.2933(5) |
¼ |
0.6497(4) |
1.14(5) |
1 |
| O2 |
4c |
0.2 |
0.3827(3) |
¼ |
0.9781(2) |
0.39(2) |
1 |
|
|
|
0.4 |
0.3814(4 |
¼ |
0.9761(4) |
1.14(5) |
1 |
| O3 |
4c |
0.2 |
0.4740(3) |
¼ |
0.1977(2) |
0.39(2) |
1 |
|
|
|
0.4 |
0.4747(5) |
¼ |
0.1970(4) |
1.14(5) |
1 |
| O4 |
4c |
0.2 |
0.0712(4) |
¼ |
0.9152(2) |
0.39(2) |
1 |
|
|
|
0.4 |
0.0705(6) |
¼ |
0.9153(3) |
1.14(5) |
1 |
| |
| Cell parameters (S.G: Pnma): |
| |
a (Å) |
b (Å) |
c (Å) |
V (Å3) |
|
xAl: 0.2 |
8.9660(2) |
2.82493(4) |
11.2881(2) |
285.908(8) |
|
xAl: 0.4 |
8.9532(3) |
2.8238(1) |
11.2802(4) |
285.20(1) |
| Reliability factors: |
| |
CRp |
CRwp |
RBragg |
|
xAl: 0.2 |
15.8% |
13.1% |
8.79% |
|
xAl: 0.4 |
16.9% |
14.0% |
7.00% |
Table 2 Bond distances and valencies determined from Table 1 (Rietveld refinement) of Ca0.66Mn2−xAlxO4 (x = 0.2 and x = 0.4) oxides. The average <Mn–O> and <Ca–O> bond distances as well as the average of the difference between the main distance and average distance are mentioned. Structural hypothesis: all Al atoms are located in the Mn2 site (Mn4+)
| Distances (Å) |
|
x(Al) |
0.2 |
0.4 |
| Mn(1)–O1 |
1.925(1) × 2 |
1.919(3) × 2 |
| Mn(1)–O3 |
2.318(3) |
2.333(4) |
| Mn(1)–O4 |
1.915(2) × 2 |
1.914(4) × 2 |
| 2.212(2) |
2.200(3) |
| <Mn(1)–O> |
2.035 |
2.033 |
| |Mn(1)–O–<Mn(1)–O>|/6 |
0.153 |
0.155 |
| Brown bond valence |
3.10 |
3.13 |
| M(2)–O1 |
1.980(2) |
1.975(5) |
| M(2)–O2 |
1.951(1) × 2 |
1.965(3) × 2 |
| 1.979(2) |
1.980(5) |
| M(2)–O3 |
1.903(2) × 2 |
1.901(3) × 2 |
| <M(2)–O> |
1.945 |
1.948 |
| |M(2)–O–<M(2)–O>|/6 |
0.028 |
0.031 |
| Ca(1)–O1 |
2.512(2) × 2 |
2.511(4) × 2 |
| Ca(1)–O2 |
2.457(3) × 2 |
2.433(4) × 2 |
| Ca(1)–O3 |
2.440(3) |
2.432(6) |
|
|
2.570(3) |
2.562(2) |
| Ca(1)–O4 |
2.362(3) × 2 |
2.376(5) × 2 |
| <Ca(1)–O> |
2.459 |
2.545 |
| |Ca(1)–O–<Ca(1)–O>|/8 |
0.054 |
0.055 |
| Brown bond valence sum |
2.15 |
2.17 |
A full pattern profile matching of the powder XRD diagram of x = 0.47 composition shows that the unit cell parameters and volume (a = 8.963(1) Å, b = 2.825(3) Å, c = 11.281(2) Å, V = 285.70(7) Å3) are close to what we found for the x = 0.4 (Al04) compound (a = 8.9535(2) Å, b = 2.8239(1) Å, c = 11.2802(3) Å, V = 285.21(1) Å3). Further, the variation in unit cell parameters and volume presented in Fig. 7 shows a strong decrease of all these parameters for a low Al content which tends to an asymptotic value for x = 0.4 around this Al solubility limit. The decrease of the unit cell parameters is in good agreement with the lower ionic radius of Al3+, substituted for Mn3+ in site 2 where the Mn4+ ions are mainly localized. As all the Al atoms replace the Mn3+ ions located in the Mn2 site, the x(Al) content reaches the 0.33 value and the cell parameters tend to plateau. For x > 0.33, a few Mn4+ ions can be stabilized in the Mn1 site but the framework does not support any excess of Mn4+ in this highly distorted site and the Al solubility limit is reached for 0.4 < x < 0.47 for which the limit Mn4+ rate in the Mn1 site is between 0.07 and 0.14.
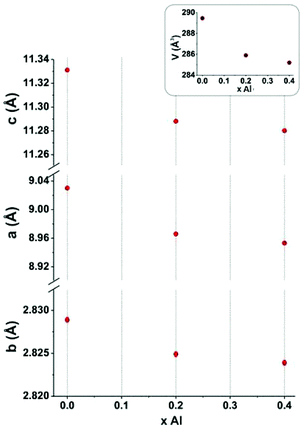 |
| | Fig. 7 Unit cell parameters and volume variation of Ca0.66Mn2−xAlxO4 (0 < x ≤ 0.40) compounds (orthorhombic unit cell, SG: Pnma). | |
Magnetic properties
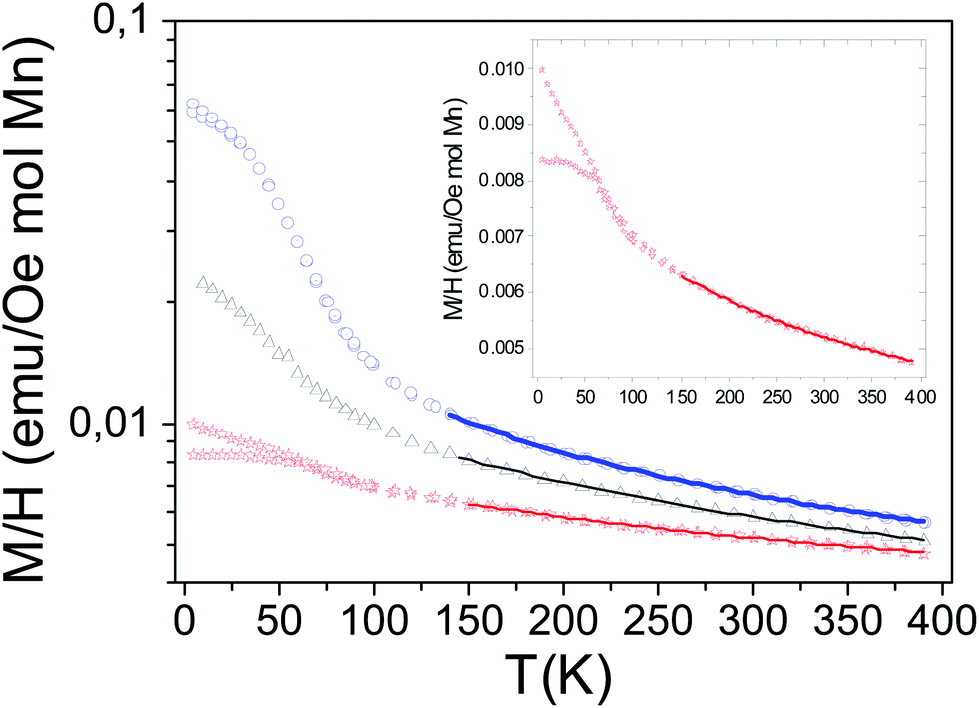
Fig. 8 shows the temperature dependences of the magnetic susceptibilities on a log scale from T = 4 K to T = 400 K for a magnetic field H of 10 kOe corresponding to x = 0, 0.2 and 0.4 compositions. The temperature dependence of the magnetic susceptibility in a linear scale for the CaMn3O6 (i.e. Ca2/3Mn2−xAlxO4 (x = 0)) compound is enlarged in the inset of Fig. 8 for clarity. An anti-ferromagnetic character with a local maximum at TN around 50 K defined for the temperature at which a deviation between the zero field cooled (ZFC) and the field cooled (FC) data occurs is seen for CaMn3O6. The shape of its magnetic behavior and its ordering temperature range are both similar to those observed in hollandite related compounds made of double chains (zigzag chains) formed by edge-sharing MnO6 octahedra for Ba1.2Mn8O1625 and for K1.6Mn8O16.26 In a first assumption, a Curie–Weiss law analysis on a temperature range from 250 K to 400 K further supports the antiferromagnetic ground state with a Weiss temperature θ around −600 K (Fig. S4†). The estimated paramagnetic moment (μeff) is found to be 5.00μB per Mn. Interestingly, it is in the same range as the one reported by Glaunsinger et al.27 but larger than that expected for an ionic model corresponding to 4.58μB per Mn. These deviations from ideality show that the magnetic behavior in this temperature range cannot be understood in terms of paramagnetism of isolated ions that might explain the reported discrepancies.17,25 Two main reasons could be considered to understand these differences. The first one is that magnetic clusters likely occur in relation to the structural analysis showing Mn(4−δ)+O6 octahedra aggregated into groups and separated by two Mn(3+δ)+O6 octahedra in connection with the calcium 1-2-type ordering. This was previously observed in the literature for La0.7Ca0.3MnO3 towards the paramagnetic to ferromagnetic transition28 and for Bi-manganites 3:1 Mn3+/Mn4+ charge ordering compounds.29 As expected from the chains in this structure30 the considerable |θ/TN| ≈ 30 ratio indicates a frustration effect associated with the small thermal hysteresis occurring before 50 K between the ZFC and the FC data and can further support this hypothesis. Magnetic susceptibility measurements performed at much higher temperatures to reach the ionic paramagnetic state are required.31 The second one is the lack of the consideration of the electron correlations and especially of the possible direct overlapping of the t2g orbitals in the double chains formed by the edge-sharing MnO6 octahedra. Thus the data were also fitted to the Curie–Weiss law with a temperature independent term, χ(T) = χ0 + C/(T − θ) as proposed in the hollandite Ba1.2Mn8O16.25 The temperature range from 150 to 390 K used for the fit was deduced from different tests extracting a better agreement factor. The fit results with their quality factors are shown in Table 3 with those also found for the composition with aluminum. The estimated paramagnetic moment μeff is now smaller than that expected for an ionic model which is indicative of the splitting between localized and delocalized electrons. As the Al content increases, the anti-ferromagnetic character decreases: the low temperature part of the magnetic susceptibility curves does not show any maximum for both samples and the fitted θ Weiss temperatures are found to be around −300 K for Al02 and around −200 K for Al04 within an only Curie–Weiss law model. The estimated effective paramagnetic moments decrease with the aluminium content from μeff = 4.30μB per Mn to μeff = 4.22μB per Mn and become smaller than the ones expected for an ionic model with 4.54μB per Mn for Al02 and 4.50μB per Mn for Al04 respectively. If one considers the Curie–Weiss law with a temperature independent term, a significant part of electrons would still be delocalized within the double chains despite the presence of 3s0 aluminium ions and the Weiss temperatures are still found to be negative, supporting antiferromagnetic super exchange interactions. However, their absolute values are a better match with the temperature range for which we are fitting the data. To gain a better understanding of the magnetization change with Al3+ substitution at temperatures lower than 50 K, isothermal field-dependent magnetization studies were carried out. Fig. 9 shows the net increase in the hysteresis field with Al3+ substitution at T = 4 K at the bottom of a linear behavior related to antiferromagnetic interactions.
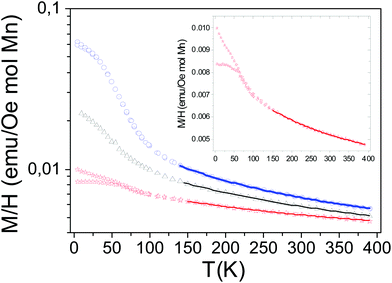 |
| | Fig. 8 Comparison of the temperature dependence of magnetization curve per mole of Mn for Ca0.66Mn2O4 (in red), Ca0.66Mn1.8Al0.2O4 (in black) and Ca0.66Mn1.6Al0.4O4 (in blue) compounds (recorded with a magnetic field of 10 kOe). The solid line represent Curie–Weiss paramagnetism law obtained by fitting the data with a temperature independent term, χ(T) = χ0 + C/(T − θ). | |
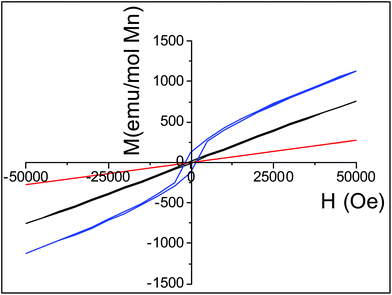 |
| | Fig. 9 Comparison of field dependence of magnetization curve per mole of Mn for Ca0.66Mn2O4 (in red), Ca0.66Mn1.8Al0.2O4 (in black) and Ca0.66Mn1.6Al0.4O4 (in blue) compounds (recorded with a magnetic field from 0 to 50 kOe at 4 K). | |
Table 3 Theoretical result of magnetic parameters and summary of the fitting results using (b) an ideal Curie–Weiss law and (c) a Curie–Weiss with temperature independent paramagnetic term (C.W: Curie–Weiss. TIP: temperature independent paramagnetism)
| |
(a) Expected values for isolated ions |
(b) Fitting with C.W law |
(c) Fitting with C.W law with TIP |
| Ca0.66Mn2−xAlxO |
C
|
μ
SO (μB per Mn) |
C
|
μ
eff (μB per Mn) |
Θ
P (K) |
C
|
r
2
|
μ
eff (μB per Mn) |
Θ
P (K) |
TIP (10−3) emu per mol Mn |
χ
2 (10−10) |
r
2
|
|
x = 0 |
2.6 |
4.58 |
2.89 |
4.81 |
−600 |
1.51 ± 0.14 |
0.9982 |
3.51 |
−231 ± 22 |
2.3 ± 1.5 × 10⁻⁴ |
3.73 |
0.9983 |
|
x = 0.2 |
2.58 |
4.54 |
2.31 |
4.30 |
−300 |
2.07 ± 0.09 |
0.9998 |
4.06 |
−157 ± 10 |
1.3 ± 1.1 × 10⁻⁴ |
0.51 |
0.9998 |
|
x = 0.4 |
2.55 |
4.50 |
2.22 |
4.22 |
−200 |
1.64 ± 0.04 |
0.9995 |
3.62 |
−52 ± 4 |
2 ± 6 × 10⁻⁵ |
5.3 |
0.9997 |
In our 1D-tunnel network, which is derived from CaFe2O4-type like in the manganese hollandite structures, the ordering temperature of the undoped sample occurs below 50 K with a magnetic state that is fundamentally antiferromagnetic. When Al3+ is introduced, the ordering temperatures defined by the minimum on the derivative curves remain at 50 ± 5 K. This suggests that the magnetic ground state is controlled by the magnetic exchange interaction within the double chains and that the deviation from one composition to another originated from the inter-chain magnetic exchanges. From the Hartree–Fock calculations on a multi-band Mn 3d–O 2p lattice model,32 Fukuzawa and co-workers propose that all Mn3+–O–Mn4+, Mn3+–O–Mn3+, and Mn4+–O–Mn4+ super-exchange interactions are ferromagnetic within the double chain in this charge ordering pattern. They are reinforced by the 90° ferromagnetic interactions but the direct exchange through the t2g, overlapping within the double chain, needs also to be considered. This is correlated to the paramagnetic temperature independent term (if it is to be taken into account). In contrast the inter-chain magnetic exchanges at 180° angle configuration are antiferromagnetic. However, they are weakened due to the low Mn–O–Mn bond angles in this structure (Table 4) that is much smaller than the required ideal 180° angle. As the aluminum content increases, the local charge ordering may be preserved and the Mn–O–Mn interchain angles are not significantly changed. But the Mn4+/Mn3+ ratio increases. Because the superexchange that involves ½ filled eg orbitals (i.e. 180° Mn3+–O–Mn3+ interactions) is much stronger than the corresponding interaction of ½ filled t2g orbital (i.e. 180° Mn4+–O–Mn4+ interactions), the aluminum content increase results in a weakening of the global antiferromagnetic long range interactions which is in good agreement with the variation of magnetic properties with the Al content illustrated in Fig. 8 and 9. Thus, Ca0.66Mn2−xAlxO4 compounds are likely canted antiferromagnets. Beyond our hypothesis, joint temperature dependence powder neutron diffraction and/or density functional theory calculations are needed to extract the magnetic ground state for which a spin glass behavior cannot be excluded even if the thermal hysteresis between the ZFC and FC data for Ca0.66Mn1.6Al0.4O4 is poor.
Table 4 Main angles Mn3+–O–Mn4+ (interchains) of (a) Ca0.66Mn2O4 and (b) Ca0.66Mn1.8Al0.2O4 and Ca0.66Mn1.6Al0.4O4 determined from Rietveld refinements of powder X-ray diffraction data (Fig. S1, Table S1, Fig. 4 and 5 and Table 2)
| (a) Angles Mn–O–Mn (°) |
Mn3+(1)–O1–Mn4+(3) |
Mn3+(5)–O5–Mn4+(3) |
Mn3+(1)–O6–Mn4+(6) |
Mn3+(2)–O9–Mn4+(6) |
| Ca0.66Mn2O4 |
132.4(9) |
128.3(6) |
133.4(7) |
128.5(9) |
| (b) Angles Mn–O–Mn (°) |
(Mn3+)site 1–O1–(Mn4+/Al3+)site 2 |
(Mn3+)site 1–O1–(Mn4+/Al3+)site 2 |
| Ca0.66Mn1.8Al0.2O4 |
122.3(1) |
131.9(2) |
| Ca0.66Mn1.6Al0.4O4 |
122.0(2) |
131.9(2) |
Redox properties and correlation with structural features
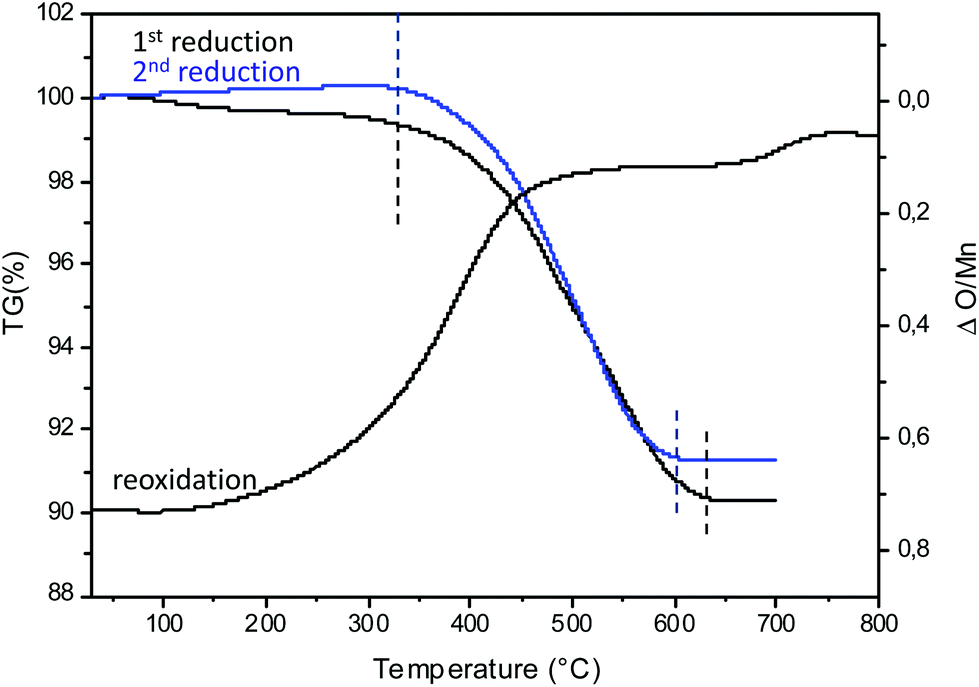
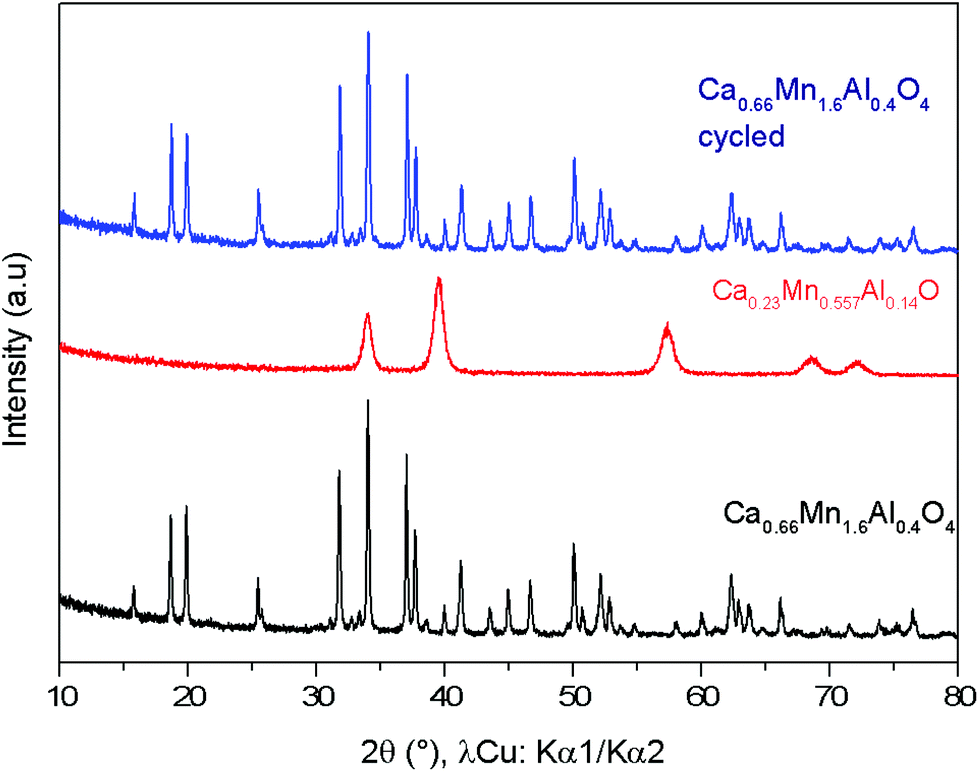
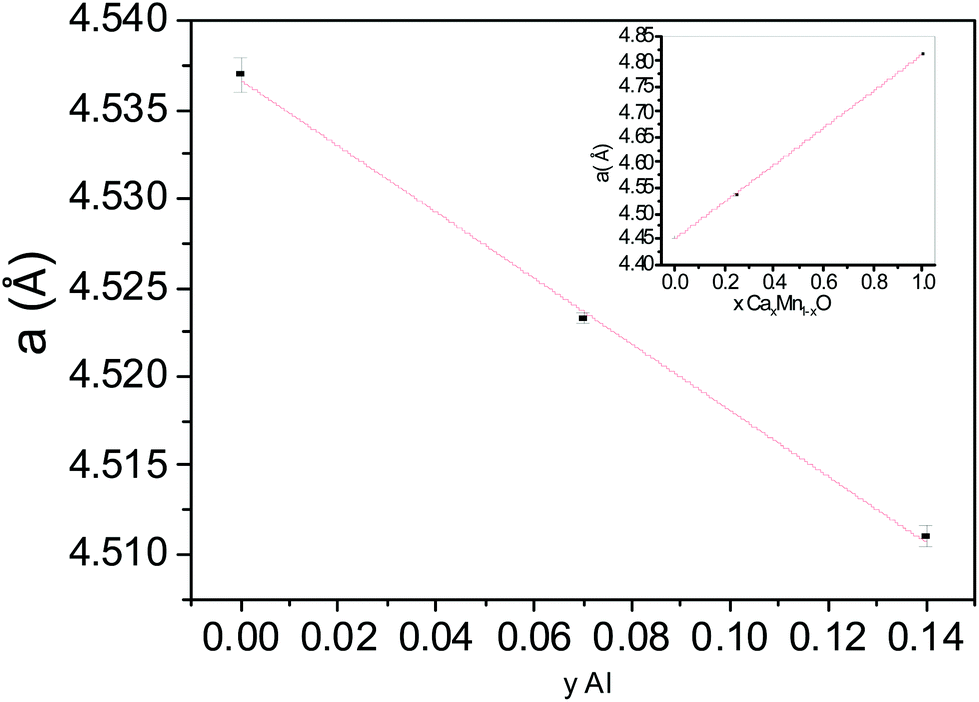
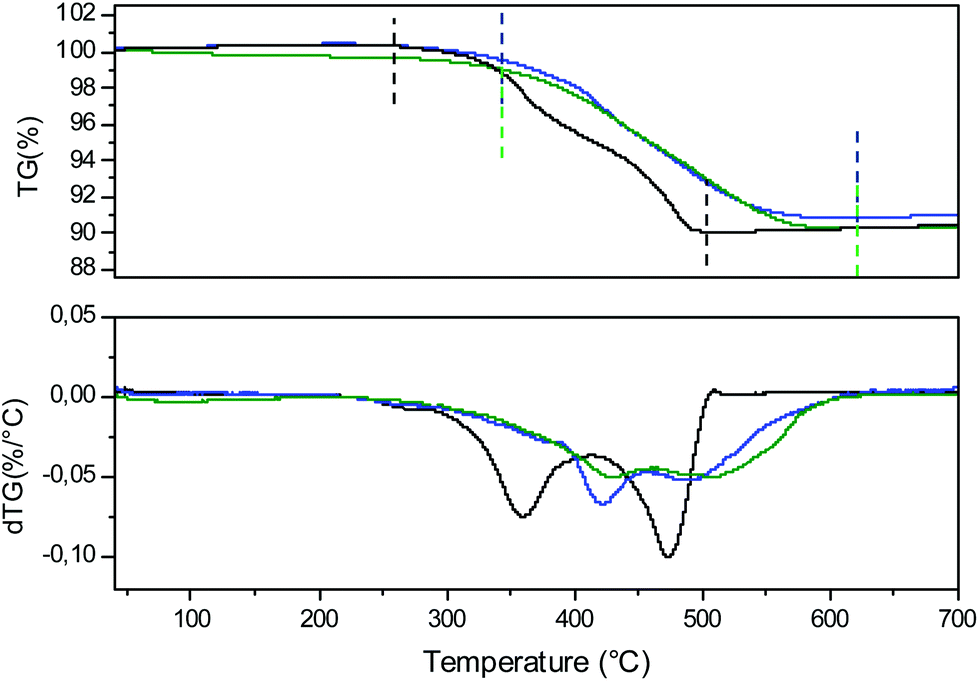
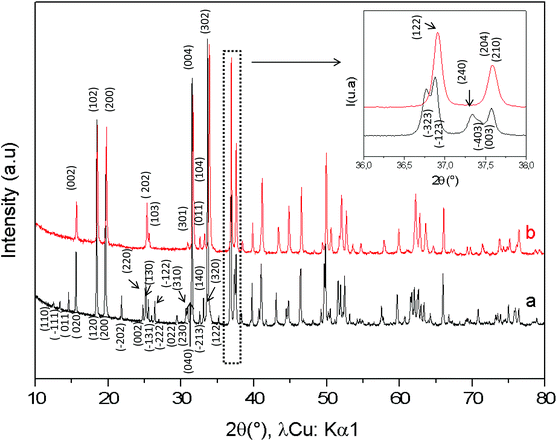
To illustrate the redox cycling properties of these complex oxides, thermogravimetric analyses (TGAs) under a reducing atmosphere (Ar/5% H2) were carried out. The redox cycling behavior of Ca0,66Mn1,6Al0,4O4 is presented in Fig. 10. The weight loss percentage Δm/m, the exchanged oxygen atoms per manganese ΔO starting from Ca0.66Mn1.6Al0.4O4 chemical formulae and the temperature of reduction/oxidation are reported in Table 5. The first reduction occurs mainly between 325 °C and 640 °C. The large content of exchanged oxygen atoms around 0.7 per manganese corresponds exactly to the total reduction of Mn4+/3+ into Mn2+. The re-oxidation starting at 150 °C is slower and occurs through different oxidation steps with a first plateau at 450 °C up to 700 °C then a second plateau starts at 750 °C. However the final state expected for the right ΔO value (i.e. for complete reoxidation) is not yet reached at 800 °C under these oxygen partial pressure and kinetic conditions. Finally the successive reduction occurs roughly in the same temperature range as the first one and the exchanged oxygen content corresponds to the rate obtained after the re-oxidation. However, the slope of the second reduction is clearly higher than the first one. The powder XRD analysis of the reduced phase containing only Mn2+ reveals the stabilization of a pure rocksalt-type structure whatever the composition of the oxidized sample (x = 0, 0.2 and 0.4, see Fig. 11). Moreover the variation of refined cell parameters versus Al3+ or Mn2+ contents (Fig. S5†) follows the Vegard law (Fig. 12). Regardless of the Mn or Al amounts, a complete solid solution forming a rocksalt-type network is obtained despite the large difference of cations’ ionic radii, which is 6-fold coordinated to oxygen (r(Ca2+) = 1.0 Å, r(Mn2+) = 0.83 Å, r(Al3+) = 0.53 Å). The re-oxidation up to 850 °C is slower but leads to the stabilization of the starting oxide (same unit cell parameters and compositions). In situ powder XRD experiments during the oxidation of the rocksalt-type framework show the formation of amorphous phases starting from 500 °C corresponding to the first plateau on the TGA curve up to 850 °C as the CaFe2O4-type structure is stabilized. The reduction process occurs systematically in the same temperature range for both the starting oxide and the cycled material. During oxidation, the smaller ionic size of Al3+ forces a definite distribution of the manganese ions into the two crystallographic sites depending on their valencies which should explain why the reduction takes place in the same temperature range after several cycles. The change of reduction slopes should be due to the various distributions of Al3+ substituted for Mn4+ in the same site (homogeneity being better after cycling) which could affect the iono-covalence of Mn4+–O chemical bonding and its ability to be reduced. One should notice that the morphology of particles can also evolve when cycling.
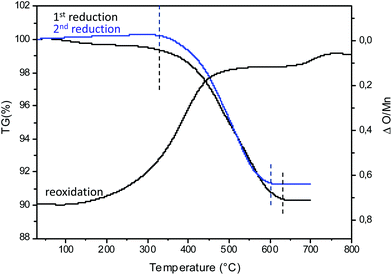 |
| | Fig. 10 Thermogravimetric analysis (TGA) of Ca0.66Mn1.6Al0.4O4 oxide under Ar/H2 5% flow and in air from room temperature to 700 °C. In blue, the second reduction under Ar/H2 5% flow from room temperature to 700 °C. The ΔO/Mn (exchanged oxygen per manganese) is also mentioned. The temperature range and the Δm/m (Table 5) are determined between the dashed lines (black and blue). | |
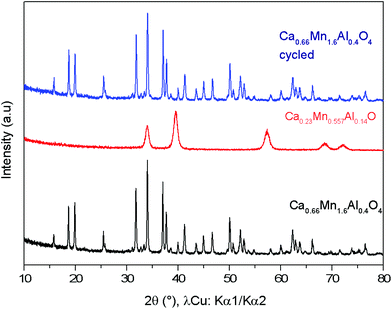 |
| | Fig. 11 X-ray powder diffraction patterns of the Ca0.66Mn1.6Al0.4O4 oxide (orthorhombic unit cell, SG: Pnma) (in black), Ca0.23Mn0.5Al0.14 O (cubic unit cell, Fm![[3 with combining macron]](https://www.rsc.org/images/entities/char_0033_0304.gif) m) obtained after TGA experiment (Fig. 8) and finally the Ca0.66Mn1.6Al0.4O4 oxide (in blue) observed after re-oxidation showing the cyclability of this system. m) obtained after TGA experiment (Fig. 8) and finally the Ca0.66Mn1.6Al0.4O4 oxide (in blue) observed after re-oxidation showing the cyclability of this system. | |
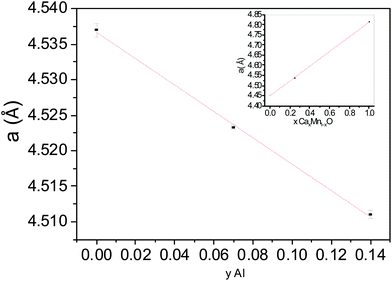 |
| | Fig. 12 Variation of the unit cell parameter for Ca0.25Mn0.75O (y = 0), Ca0.24Mn0.65Al0.07O (y = 0.07), Ca0.23Mn0.56Al0.14O (y = 0.14) versus Al (y) content and CaxMn1−xO (x = 0, 0.25, 1) compounds versus Ca (x) rate following the Vegard law. | |
Table 5 Thermogravimetric analysis (TGA, Fig. 11) values of Ca0.66Mn1.6Al0.4O4 oxide reduced with Ar/H2 5% flow (heating rate 5 °C min−1) then oxidized in air (heating rate 5 °C min−1) from room temperature to 700 °C. The ΔO (exchanged oxygen atom per manganese) theoretical values have been estimated by considering the total reduction of Mn3+/4+ into Mn2+
| Sample |
Δm/m |
ΔO per Mn |
|
| 1st reduction |
Theo. |
Exp. |
Theo. |
Exp. |
Temperature range of reduction |
| Ca0.66Mn1.6Al0.4O4 |
9.6% |
9.5% |
0.71 |
0.7 |
325 °C–640 °C |
| Sample |
Δm/m |
ΔO per Mn |
|
| Oxidation after the first reduction |
Theo. |
Exp. |
Theo. |
Exp. |
Temperature range of oxidation |
| Ca0.23Mn0.56Al0.14O |
9.6% |
9.1% |
0.71 |
0.67 |
150 °C–800 °C |
| Sample |
Δm/m |
ΔO per Mn |
|
| 2nd reduction |
Theo. |
Exp. |
Theo. |
Exp. |
Temperature range of reduction |
| Ca0.66Mn1.6Al0.4O4 |
9.6% |
9.1% |
0.71 |
0.67 |
325 °C–600 °C |
The comparison of the TGA curves and their derivatives obtained during the reduction processes of the x = 0, 0.2 and 0.4 compositions are presented in Fig. 13 and Table 6. For the x = 0 compound, starting at 250 °C, two reduction phenomena can be clearly identified and are separated by a pseudo plateau centered around 420 °C which corresponds to the local maximum of the derivative curve. The weight loss for the first phenomenon is equivalent to that of the second one. In the first approximation, the description of the monoclinic unit cell of CaMn3O6 on the basis of an orthorhombic unit cell (‘Ca0.66Mn2O4’) leads to the identification of two Mn sites with the same multiplicity and corresponding to +3.66 and +3 valence states respectively. Therefore, we propose that the first reduction at a lower temperature should correspond to the mixed valence state Mn4+/3+: at the first inflexion point Mn4+ is fully reduced into Mn3+ and at the first local maximum of the derivative curve, the average valency reaches the value of Mn2.66+ (i.e. 66% of Mn3+ and 34% of Mn2+). The reduction of Al-substituted phases shifts to higher temperatures and the local maxima of the derivative curves, which are much more attenuated, appear around 470 °C for the Al02 and Al04 samples. Moreover, Mn4+ being located at the same atomic position as Al3+ in one specific double chain, the Mn–O chemical bonding in this site becomes more covalent as the Al content increases due to a less distorted site and shorter bond distances. Thus, the reduction phenomenon of the Al-substituted phases occurs at a higher temperature. However, the thermal stability of Al-substituted Ca0.66Mn2−xAlxO4 oxides in air remains the same as the Ca0.66Mn2O4 un-substituted compound at T < 900 °C. That is why, in order to increase or decrease the Mn4+ contents, other compositions with slightly lower or higher Ca contents have been attempted. A target corresponding to the Ca0.6Mn1.6Al0.4O4 composition (Fig. 14) leads to a phase mixture with the CaFe2O4-type framework and Brownmillerite-type structure (Ca2(Mn,Al)2O5, SG: Imma).8 However the Ca0.7Mn1.8Al0.2O4 composition is pure and adopts the CaFe2O4-type network (Fig. 14). It is worth mentioning that there is a slight increase of a and c unit cell parameters (Table 1) compared to those of Ca0.66Mn1.8Al0.2O4 oxide with the shift at low 2θ angles of (002), (102) and (200) diffraction lines (Fig. 14 and S6†). The Ca vacancy rate equal to y = 1/3 is the upper limit to be reached in the Ca1−yMn2−xAlxO4 solid solution. While the Mn average oxidation state of CaMn3O6 and Ca0.7Mn1.8Al0.2O4 oxides is the same and equal to +3.33, the Mn average valence state slightly increases with the Al amount for the Ca0.66Mn2−xAlxO4 composition up to +3.42 for x = 0.4.
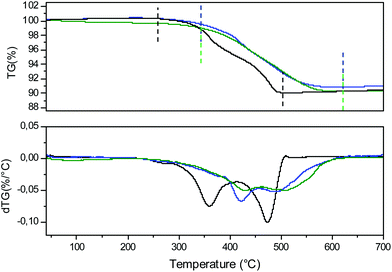 |
| | Fig. 13 Thermogravimetric analysis (TGA) and the derivative curves (dTG) of Ca0.66Mn2O4 (in black), Ca0.66Mn1.8Al0.2O4 (in blue) and Ca0.66Mn1.6Al0.4O4 (in green) oxides under Ar/H2 5% flow. The temperature range and the Δm/m (Table 6) are determined between the dashed lines (black, blue and green) for each compound. | |
 |
| | Fig. 14 X-ray powder diffraction patterns of (a) Ca0.6Mn1.8Al0.2O4, (b) Ca0.66Mn1.8Al0.2O4 and (c) Ca0.7Mn1.8Al0.2O4 compounds. For the composition Ca0.6Mn1.8Al0.2O4 the diffraction peaks of the impurity considered as Brownmillerite-type (SG: Imma) phase (Ca2(Mn,Al)2O5) are marked by a star. | |
Table 6 Thermogravimetric analysis (TGA, Fig. 13) values of Ca0.66Mn2O4, Ca0.66Mn1.8Al0.2O4 and Ca0.66Mn1.6Al0.4O4 oxides reduced with Ar/H2 5% flow (heating rate 2 °C min−1) from room temperature to 700 °C. The ΔO (exchanged oxygen atom per manganese) theoretical values have been estimated by considering the total reduction of Mn3+/4+ into Mn2+
| Sample |
Δm/m |
ΔO per Mn |
|
| |
Theo. |
Exp. |
Theo. |
Exp. |
Temperature range of reduction |
| CaMn3O6 |
10.65% |
10.55% |
0.66 |
0.65 |
250 °C–500 °C |
| Ca0.66Mn1.8Al0.2O4 |
10.1% |
98% |
0.68 |
0.66 |
350 °C–640 °C |
| Ca0.66Mn1.6Al0.4O4 |
9.6% |
9.2% |
0.71 |
0.68 |
350 °C–640 °C |
Conclusion
The Al substitution in the CaMn3O6 1D-tunnel structure (SG: P21/a) allows the stabilization of the CaFe2O4-type structure with a higher symmetry (SG: Pnma) and tunes the Mn valence state in the two atomic positions (x, ¼, z). The unit cell parameters of the Ca0.66Mn2−xAlxO4 solid solution strongly decrease with the Al content increase and tend to an asymptotic value around x = 0.33. The solubility limit is reached for 0.4 < x < 0.47. The two Mn sites are clearly different. The first one, Mn1, is highly anisotropic with four short bond lengths and two longer ones correspond mainly to Mn3+ (3d4) as Jahn–Teller ions. The second Mn2 is smaller, more isotropic and partially occupied by Al3+ ions. For x = 0.33, the second site is occupied by 2/3 of Mn4+ and 1/3 Al3+ whereas 100% of Mn3+ is located in the first site. The magnetic properties follow this Mn valence distribution due to the Al site occupancy and show a modification of the balance between ferromagnetic and antiferromagnetic interactions, the inter-chain long range antiferromagnetic interactions being strongly weakened when the aluminium content increases. Al substitution for Mn sites in the CaMn3O6 network contributes to the modification of the long range Mn charge ordering, which leads to change the symmetry of the unit cell with the disappearance of the Ca ordering. The reduction of Al-substituted phases starts at a higher temperature (T = 350 °C) than the CaMn3O6 oxide (ΔT = +50 °C), confirming the increase of the Mn–O bond covalence with Al substitution. The reduced phases correspond to a perfect solid solution, stabilizing Al3+, Mn2+ and Ca2+ (which have very different ionic sizes) in a rocksalt-type structure. The two rutile double chains in the CaFe2O4-type structure, involving two different valence states of Mn, are clearly related to the rocksalt-type structure and should explain the two reduction phenomena observed at different temperatures. If the oxidation of the reduced phases takes place at lower temperatures (T = 150 °C), the phenomenon is slower than the reduction process and amorphous phases appear before the stabilization of the Ca0.66Mn2−xAlxO4 solid solution at T = 850 °C. The very good cyclability of this system should be associated with the presence of Al3+ which substitutes Mn4+ at the same atomic positions, thus playing the role of a pillar where the Mn–O–Mn interactions involving two rutile double chains can easily develop.
References
- M. Funabiki, T. Yamada and K. Kayano, Catal. Today, 1991, 10, 33 CrossRef CAS.
- J. Kaspar, P. Fornasiero and N. Hickey, Catal. Today, 2003, 77, 419 CrossRef CAS.
-
A. Trovarelli, Catalysis by Ceria and related materials, Imperial College Press, 2002 Search PubMed.
- B. M. Reddy, G. K. Reddy, I. Ganesh and J. M. F. Ferreira, Catal. Lett., 2009, 130, 227 CrossRef CAS.
- S. N. Achary, S. K. Kali, N. K. Kulkarni, P. S. R. Krishna, A. B. Shinde and A. K. Tyagi, Chem. Mater., 2009, 21, 5848 CrossRef CAS.
- J. Abel, M. Lamirand-Majimel, J. Majimel, V. Bellières-Baca, V. Harlé, G. André, C. Prestipino, S. Figueroa, E. Durand and A. Demourgues, Dalton Trans., 2014, 43, 15183–15191 RSC.
- H. Yamaguchi, A. Yamada and U. Hiromoto, Phys. Rev. B: Condens. Matter, 1998, 58(1), 8–11 CrossRef CAS.
- T. Motohashi, Y. Hirano, Y. Masubuchi, K. Oshima, T. Setoyama and S. Kikkawa, Chem. Mater., 2013, 25, 372–377 CrossRef CAS.
- K. R. Poeppelmeier, M. E. Leonowicz, J. C. Scanlon, J. M. Longo and B. Yelon, J. Solid State Chem., 1982, 79, 71–79 CrossRef.
- A. Varela, S. de Dios, M. Parras, M. Hernando, M. T. Fernández-Díaz, A. R. Landa-Cánovas and J. M. González-Calbet, J. Am. Chem. Soc., 2009, 131(24), 8660–8668 CrossRef CAS PubMed.
- T. Negas and R. S. Roth, J. Solid State Chem., 1970, 1, 409–418 CrossRef.
- H. S. Horowitz and J. M. Longo, Mater. Res. Bull., 1978, 13, 1359–1369 CrossRef CAS.
- T. Yamanaka, A. Uchida and Y. Nakamoto, Am. Mineral., 2008, 93(11–12), 1874–1881 CrossRef CAS.
- S. Zouari, L. Ranno, A. Cheikh-Rouhou, M. Pernet and P. Strobel, J. Mater. Chem., 2003, 13(4), 951–956 RSC.
- S. Zouari, L. Ranno, A. Cheikh-Rouhou, O. Isnard, M. Pernet, M. Wolfers and P. Strobel, J. Alloys Compd., 2003, 353(1–2), 5–11 CrossRef CAS.
- C. D. Ling, J. J. Neumeierm and D. N. Argyriou, J. Solid State Chem., 2001, 160, 167–173 CrossRef CAS.
- J. Hadermann, A. M. Abakumov, L. J. Gillie and C. Martin, Chem. Mater., 2006,(9), 5530–5536 CrossRef CAS.
- E. Tsipis, Y. Pivak, J. Waerenborgh, V. Kolotygin, A. Viskup and V. Kharton, Solid State Ionics, 2007, 178(25–26), 1428–1436 CrossRef CAS.
- W. Sławiński, R. Przeniosło and I. Sosnowska, J. Solid State Chem., 2013, 198, 392–398 CrossRef.
- N. Barrier, C. Michel, A. Maignan, M. Hervieu and B. Raveau, J. Mater. Chem., 2005, 15, 386–393 RSC.
- T. Yang, M. Croft, A. Ignatov, I. Nowik, R. Cong and M. Greenblatt, Chem. Mater., 2010, 22, 5876–5886 CrossRef CAS.
- L. Chick, L. Pederson, G. Maupin, J. Bates, L. Thomas and G. J. Exarhos, Mater. Lett., 1990, 10(1,2), 6–12 CrossRef CAS.
- K. Deshpande, A. Mukasyan and A. Varma, J. Am. Ceram. Soc., 2003, 54, 1149–1154 CrossRef.
- R. Epherre, E. Duguet, S. Mornet, E. Pollert, S. Louguet, S. Lecommandoux, C. Schatz and G. Goglio, J. Mater. Chem., 2011, 21, 4393–4401 RSC.
- S. Ishiwata, J. W. G. Bos, Q. Huang and R. J. Cava, J. Phys.: Condens. Matter, 2006, 18, 3745–3752 CrossRef CAS.
- T. Kuwabara, M. Isobe, H. Gotou, T. Yaga, D. Nishio-Hamane and Y. Ueda, J. Phys. Soc. Jpn., 2012, 81, 104701 CrossRef.
- W. S. Glaunsinger, H. S. Horowitz, J. M. Longo and A. Chang, J. Solid State Chem., 1980, 35, 187–191 CrossRef CAS.
- P. S. Anil Kumar, P. A. Joy and S. K. Date, J. Phys.: Condens. Matter., 1998, 10, 269–275 CrossRef.
- O. Toulemonde, I. Skovsen, F. Mesguich and E. Gaudin, Solid State Sci., 2008, 10(4), 476–480 CrossRef CAS.
- Q. Liu, D. Sallagoity, M. Josse and O. Toulemonde, Inorg. Chem., 2013, 52, 7853–7861 CrossRef CAS PubMed.
- J. E. Greedan, N. P. Raju and I. J. Davidson, J. Solid State Chem., 1997, 128, 209–214 CrossRef CAS.
- M. Fukuzawa, D. Ootsuki and T. Mizokawa, J. Phys. Soc. Jpn., 2013, 82, 074708 CrossRef.
Footnote |
| † Electronic supplementary information (ESI) available. See DOI: 10.1039/c5dt02761f |
|
| This journal is © The Royal Society of Chemistry 2016 |
Click here to see how this site uses Cookies. View our privacy policy here. 
 Open Access Article
 This Open Access Article is licensed under a Creative Commons Attribution-Non Commercial 3.0 Unported Licence