
 Open Access Article
 This Open Access Article is licensed under a
 Creative Commons Attribution 3.0 Unported Licence
A non-typical sequence of phase transitions in (NH4)3GeF7: optical and structural characterization†
S. V.
Mel'nikova
a,
M. S.
Molokeev
 *ab,
N. M.
Laptash
c and
S. V.
Misyul
d
*ab,
N. M.
Laptash
c and
S. V.
Misyul
d
aLaboratory of Crystal Physics, Kirensky Institute of Physics, SB RAS, Krasnoyarsk 660036, Russia. E-mail: msmolokeev@gmail.com
bDepartment of Physics, Far Eastern State Transport University, Khabarovsk, 680021, Russia
cInstitute of Chemistry, Far Eastern Branch of RAS, Vladivostok, 690022, Russia
dSiberian Federal University, Krasnoyarsk, 660074, Russia
First published on 10th February 2016
Abstract
Single crystals of germanium double salt (NH4)3GeF7 = (NH4)2GeF6·NH4F = (NH4)3[GeF6]F were grown and studied by the methods of polarization optics and X-ray diffraction. The birefringence Δn = (no − ne), the rotation angle of the optical indicatrix ϕ(T) and unit cell parameters were measured in the temperature range 100–400 K. Three structural phase transitions were found at the temperatures: T1↓ = 279.2 K (T1↑ = 279.4 K), T2↑ = 270 K (T2↓ = 268.9 K), T3↓ = 218 K (T3↑ = 227 K). An unusual sequence of symmetry transformations with temperature change was established: P4/mbm (Z = 2) (G1) ↔ Pbam (Z = 4) (G2) ↔ P21/c (Z = 4) (G3) ↔ Pa![[3 with combining macron]](https://www.rsc.org/images/entities/char_0033_0304.gif) (Z = 8) (G4). The crystal structures of different phases were determined. The experimental data were additionally interpreted by a group-theoretical analysis of the complete condensate of order parameters taking into account the critical and noncritical atomic displacements. Strengthening of the N–H⋯F hydrogen bonds can be a driving force of the observed phase transitions.
(Z = 8) (G4). The crystal structures of different phases were determined. The experimental data were additionally interpreted by a group-theoretical analysis of the complete condensate of order parameters taking into account the critical and noncritical atomic displacements. Strengthening of the N–H⋯F hydrogen bonds can be a driving force of the observed phase transitions.
1 Introduction
Complex compounds with the general formula A3MX7 (X = O, F), incorporating octahedral MX62− and single (“free”) X− anions, are characterized as double salts A3[MX6]F and crystallize as high symmetry phases at room temperature. They are tetragonal for K3SiF7,1 (NH4)3SiF7,2 (NH4)3GeF7![[thin space (1/6-em)]](https://www.rsc.org/images/entities/char_2009.gif) 3 with sp. gr. P4/mbm, and (NH4)3TiF7 (P4/mnc),4 or cubic for (NH4)3SnF7,5 (NH4)3PbF7,6 and (NH4)3WO2F57 with sp. gr. Pmm. Ammonium double salts (NH4)3[MX6]F are the main products of fluoride processing of natural raw materials (quartz and different silicates, ilmenite, scheelite) with ammonium hydrogen difluoride (NH4HF2).8–10 Fluorination reactions proceed exothermally (even at room temperature) with the entropy reserve. Moreover, elemental homologues silicon, germanium, and tin interact with NH4HF2 with the formation of (NH4)3MF7 also.11 These fluorination reactions were used to obtain possible metal nitrides (M3N4) or metal nitride fluorides (MNF). The semiconductor surfaces of Si and Ge can also be etched and cleaned with NH4HF2.12
3 with sp. gr. P4/mbm, and (NH4)3TiF7 (P4/mnc),4 or cubic for (NH4)3SnF7,5 (NH4)3PbF7,6 and (NH4)3WO2F57 with sp. gr. Pmm. Ammonium double salts (NH4)3[MX6]F are the main products of fluoride processing of natural raw materials (quartz and different silicates, ilmenite, scheelite) with ammonium hydrogen difluoride (NH4HF2).8–10 Fluorination reactions proceed exothermally (even at room temperature) with the entropy reserve. Moreover, elemental homologues silicon, germanium, and tin interact with NH4HF2 with the formation of (NH4)3MF7 also.11 These fluorination reactions were used to obtain possible metal nitrides (M3N4) or metal nitride fluorides (MNF). The semiconductor surfaces of Si and Ge can also be etched and cleaned with NH4HF2.12
We continue to investigate (NH4)3[MX6]F with respect to their phase transitions, the sequence of which depends on the nature of the central metal atom. Comparative analysis of the phase states of these compounds and their changes as a result of phase transitions (PTs) is an important task of our present and future research.
Recently, both powder and single crystal X-ray diffraction experiments13 revealed that the real symmetry of (NH4)3SnF7 at room temperature was Pa (Z = 8) instead of (Pmm) (Z = 1) suggested earlier.5 Moreover, a reversible structural PT in this compound of the first order between two cubic modifications Pa ↔ Pmm was found at about T0 = 360 K.13
Two reversible structural phase transitions of the first order at T1↓ = 358.5 K (T1↑ = 360 K) and T2↓ = 287.5 K (T2↑ = 291–310 K) were found for (NH4)3TiF7 with an unusual sequence of symmetry changes (G1, G2, G3).14–16 When the temperature rises, the phase symmetry lowers. Both transitions have striking features of the first order: an abrupt change of birefringence, a large temperature hysteresis and a significant change of entropy. The symmetry of the low-temperature G3 phase was found as Pa in ref. 15. Complicated twinning of tetragonal phases appearing after cycling through a first-order transition and the ability of easy reorientation of the fourth order axis direction due to weak uniaxial stress enabled the authors14 to suggest and then to show the existence of a high-temperature “parent phase” G0 with the Pmm symmetry for (NH4)3TiF7.16 The following sequence of symmetry transformations with temperature or pressure changes was established: Pa (G3) ↔ P4/mnc (G2) ↔ 4/m (G1) ↔ Pmm (G0).14–16 Only point group symmetry was suggested for the G1 phase. The temperature–pressure phase diagram showed the disappearance of two intermediate tetragonal phases under pressure.16 The ability of easy switching of the direction of the optical axis at 90° by a weak uniaxial compression is very interesting and a useful property of the (NH4)3TiF7 crystal.14
The investigation of the (NH4)3GeF7 crystal was limited by the structural study.3 At room temperature, its symmetry was determined as P4/mbm with unit cell parameters a = 8.210, c = 5.984 Å, and Z = 2. The related (NH4)3TiF7 has another space group: P4/mnc, a = 11.9492, c = 11.666 Å, Z = 4.4 The structures of these crystals differ in the degree of ordering of the octahedral MF62− groups. The present work describes an unusual sequence of PTs of germanium double salt (NH4)3GeF7 in accordance with crystal optical and X-ray investigations.
2 Experimental
2.1 Synthesis and crystal growth
For obtaining single crystals of (NH4)3GeF7 Plitzko & Meyer3 used ammonium hydrogen difluoride (NH4HF2) as the fluorinating and oxidizing reagents in the reaction with Ge powder. The process was carried out at 573 K in a sealed Monel (Cu32Ni68) ampoule at the Ge:NH4HF2 molar ratio 1:4. We also used NH4HF2 but for fluorination of GeO2 of a reagent grade at 150–200 °C. It should be noted that the reaction began even at room temperature under grinding the initial components together. At least, a double excess of NH4HF2 was taken relative to stoichiometric reactions: GeO2 + 3.5NH4HF2 = (NH4)3GeF7 + 0.5NH3 + 2H2O. The cake obtained in this way was then water-leached, and colorless prismatic single crystals of (NH4)3GeF7 were formed under slow evaporation in the final solution under ambient conditions.
2.2 Optical observations
Optical studies were performed using the polarizing microscope “Axioskop-40” and the temperature chamber “Linkam LTS 350” in the range of 90–400 K. The birefringence was measured by using a Berek compensator (“Leica”) with accuracy ≈0.00001. It should be noted that all optical studies were performed using the oil under cover glasses because above 300 K crystals began to decompose with isolation of (NH4F = NH3 + HF).2.3 X-ray investigations
The powder diffraction data of (NH4)3GeF7 for Rietveld analysis were collected with a Bruker D8 ADVANCE powder diffractometer (Cu-Kα radiation) and a linear VANTEC detector. The beam was controlled by the 0.6 mm fixed divergence slit, 6 mm receiving VANTEC slit and Soller slits. An Anton Paar TTK450 attachment was used for low- and high-temperature measurements.The variable counting time (VCT) scheme was used to collect the diffraction data at T = 303 K, T = 273 K, T = 243 K, and T = 143 K (Fig. 1S†). The measurement time was systematically increased towards higher 2θ angles, leading to improved data quality.17 Two ranges were generated on diffraction patterns: (1) 2θ 5–72°, step 0.016°, step time 1 s; (2) 2θ 72–140°, step 0.032°, step time 4 s. These X-ray patterns were used to solve and refine crystal structures. 15 additional X-ray patterns were collected from 163 K to 383 K with the standard scan time scheme to identify the space group transformation at phase transition.
3 Results and discussion
The grown single crystals of (NH4)3GeF7, like (NH4)3TiF7,13 have a habitus of elongated rectangular prisms with extinctions along the growth faces. The small single-domain samples were optically uniaxial, which was in agreement with a tetragonal symmetry of the compound.3 However, the study revealed some differences between these two tetragonal crystals in spite of their similarities. The growing faces of (NH4)3TiF7 are the planes (100)t with the lattice parameters a = 11.95 Å.14 In (NH4)3GeF7, growing faces are planes (110)t with interplanar spacing = 11.61 Å. In (NH4)3TiF7, the direction of the 4-fold axis can be easily reoriented to 90° under the small uniaxial pressure, such as pressing a needle.14 In the (NH4)3GeF7 crystal, the pressure application (up to crystal destruction) does not change the orientation of this axis.
Fig. 1 shows the photographs of the crystal plate (NH4)3GeF7, which were taken in polarized light under cooling and heating. The selected sample consists of two blocks with different orientations of the 4-fold axis. This allows simultaneous observation of changes taking place in two crystallographic directions. The upper part of the sample with the (001)t orientation is optically isotropic (Δnc = 0) at room temperature and has a dark color (Fig. 1a). The lower part of the sample has the (110)t orientation, and the 4-fold axis lies horizontally. There are direct extinctions along the growth faces.
 | ||
| Fig. 1 Single crystals (NH4)3GeF7 under polarized light during cooling: a – G1, b – G2, c – G3, d – G4 phases, respectively. The sample in the G1 phase consists of two blocks with different orientations of the 4-fold axis. The arrows indicate the position of extinction. | ||
The observed pattern changes in the process of cooling below T1↓ = 279.2 K (T1↑ = 279.4 K). The upper part of the sample illuminates and the twin boundaries are formed at an angle of 45° to the faces of growth, i.e. along [100]t (Fig. 1b). This area has extinctions along the lateral edges (110)t. Further cooling of the sample leads to increasing of the anisotropy in the upper block. This is evident by the change of the interference color (Fig. 1c). In addition, the extinction position changes. Below T2 = 270 K direct extinction remained only in the upper part of the sample. In the lower block thin lamellar twins with the “floating” position of extinction appear.
Further cooling reveals an abrupt transition to the optically isotropic (cubic) phase at T3↓ = 218 K (Fig. 1d). The sample rapidly becomes uniformly dark. This transition temperature can be varied for the same sample within T3↓ = 218–224 K. During heating the crystal also returns quickly to the anisotropic state at T3↑ = 227 K.
Observations of the growth plate (110)t in polarized light showed that the fine twinning structure appeared during the cooling in the temperature range T1↓ ≤ T ≤ T3↓, which does not allow measurement of the optical characteristics. However, after cooling to the isotropic state (below T3↓) and returning to the anisotropic phases, the formed twin structure consists of large domains of type (I) or (II) (Fig. 2a and b). Region (I) has a stable position of extinction along the edges of growth, whereas it varies with temperature in (II). The temperature dependence of birefringence Δn (T) and rotation of the optical indicatrix ϕ(T) around the [110]t direction with respect to the [001]t direction were measured in these large areas.
 | ||
| Fig. 2 The formation of large twins in the (110)t plate after cooling till the G4 phase and returning into the G3 phase: (a) – (I) and (b) – (II) twins near the position of extinction. | ||
At room temperature, the birefringence of the (NH4)3GeF7 crystal (Δn = no − ne = 0.0034) is higher than that of (NH4)3TiF7 (Δn = 0.0023).13 The temperature dependence of optical characteristics Δn (T) of (NH4)3GeF7 is shown in Fig. 3. It can be seen that the birefringence of a high-temperature phase varies smoothly with temperature. Below T1, the dependence Δn (T) is divided into two curves measured in different twins. Curve 1 was obtained for the twin type (I) with the extinctions along the facet. The birefringence in this area gradually decreases approaching zero. Therefore, the interference color of the twin (I) is gray (Fig. 2b). In the area (II), the changing of color intensity indicates an increase of the optical anisotropy (Fig. 2a). Indeed, according to Fig. 3 (curve 2), this twin has an increasing birefringence. Measurements in the twin (II) were made, taking into account the rotation of the indicatrix at each temperature. Below T3↓ = 218 K, the birefringence of the crystal abruptly drops to zero. The anisotropic phase appears suddenly at T3↑ = 227 K during the process of heating.
 | ||
| Fig. 3 The temperature behavior of birefringence Δn (T) in the plate (110)t of the (NH4)3GeF7 crystal. Curve 1 is Δna (T) measured in the twin (I) (cooling), curve 2 is Δnb (T) measured in the twin (II) (heating). | ||
The splitting of Δn (T) into two curves below T1 is associated with a reduction of crystal symmetry and the appearance of the optical anisotropy along the [001]t direction. The measurement results of Δnc (T) are shown in Fig. 4 (curve 1). Birefringence appears at T1 and smoothly changes near T2 without large spikes, while the anisotropy disappears at T3.
 | ||
| Fig. 4 The appearance of optical anisotropy in the plate (001)t at T1, and its changing at T2 (curve 1). The rotation of the optical indicatrix ϕ(T) around the [110]t = [010]or direction in the G3 phase (curve 2). | ||
The temperature dependence of the angle rotation of the optical indicatrix ϕ(T) in the twin (II) around one of the [110]t directions is shown in Fig. 4 (curve 2). It can be seen that the indicatrix rotates only in the temperature region T3 ≤ T ≤ T2, where T2↑ = 270 K, T2↓ = 268.9 K, δT2 = 1.1 K. It should be noted that the rotation of the indicatrix occurs up to a very high angle ϕ ≈ 24°.
Comprehensive polarization-optical and structural studies, as well as measuring the birefringence and the rotation angle of the indicatrix in the (NH4)3GeF7 crystal allowed establishment of the existence of three structural phase transitions between the G1, G2, G3, and G4 phases of different symmetries. According to the temperature dependence of optical characteristics (Fig. 3 and 4), transitions G1 ↔ G2 ↔ G3 occur smoothly, close to the second-order. Therefore, we assume that a successive lowering of crystal symmetry takes place upon cooling from the room temperature. The presence of the optical anisotropy Δnc and twin structure with boundaries along the [100]t direction enables one to distinguish the G2 phase from the G1 phase. These facts demonstrate the loss of the second order axes along the [100]t direction and (100)t plane. The position of extinction of the sample along the [110]t direction reveals the geometry of a new cell. Most likely, the group symmetry of the G2 phase is orthorhombic, and two axes of the unit cell should be perpendicular to the 4-fold axis and directed along the unit cell diagonals of the tetragonal G1 phase.
As the crystal structure of (NH4)3GeF7 at room temperature was solved earlier,3 we used this model (P4/mbm) to make Rietveld refinement by using TOPAS 4.2.18 The refinement was stable and gave low R-factors (Table 1 and Fig. 1S(a)†). Atomic coordinates are given in Table 1S,† and the crystal structure is presented in Fig. 2S(a).† The compound (NH4)3GeF7 was very pure and all the lines were indexed by the P4/mbm phase (Fig. 1S(a)†). Cell parameters after refinement were close to those from ref. 3.
| Phase | G1 | G2 | G3 | G4 |
|---|---|---|---|---|
| Temperature, K | 303 | 273 | 243 | 143 |
| Sp. gr. | P4/mbm | Pbam | P21/c |
Pa |
| a, Å | 8.2171(1) | 11.6135(2) | 5.9134(1) | 11.6472(3) |
| b, Å | 8.2171(1) | 11.6031(2) | 11.5923(3) | 11.6472(3) |
| c, Å | 5.9390(1) | 5.92488(9) | 11.6187(3) | 11.6472(3) |
| β, ° | 90 | 90 | 89.810(2) | 90 |
| V, Å3 | 401.01(2) | 798.40(3) | 796.46(3) | 1580.0(1) |
| Z | 2 | 4 | 4 | 8 |
| 2θ-interval, ° | 5–120 | 5–120 | 5–120 | 5–120 |
| No. of reflections | 234 | 844 | 1521 | 507 |
| No. of refined parameters | 14 | 28 | 35 | 24 |
| R wp, % | 9.13 | 7.55 | 6.79 | 6.41 |
| R p, % | 7.64 | 6.32 | 5.93 | 5.05 |
| R exp, % | 3.55 | 3.01 | 2.76 | 2.76 |
| χ 2 | 2.57 | 2.51 | 2.46 | 2.33 |
| R B, % | 4.27 | 4.03 | 3.45 | 1.57 |
One can see (Fig. 5 and 6a) that the first wave of superstructure peaks appears at T = 279 K. It was concluded that at this PT (G1 → G2) the cell parameters increased. All these additional peaks can be described by the emergence of instability at the (1/2, 1/2, 0) k18-point (M) of the Brillouin zone of the G1 – P4/mbm unit cell (hereinafter the designation of irreducible representations (irrep) and points of Brillouin zone are given in accordance with reference books).19,20 Additional useful information is that this PT G1 ↔ G2 is of the second order type (Fig. 3 and 4). Therefore, only a special space group should be considered.
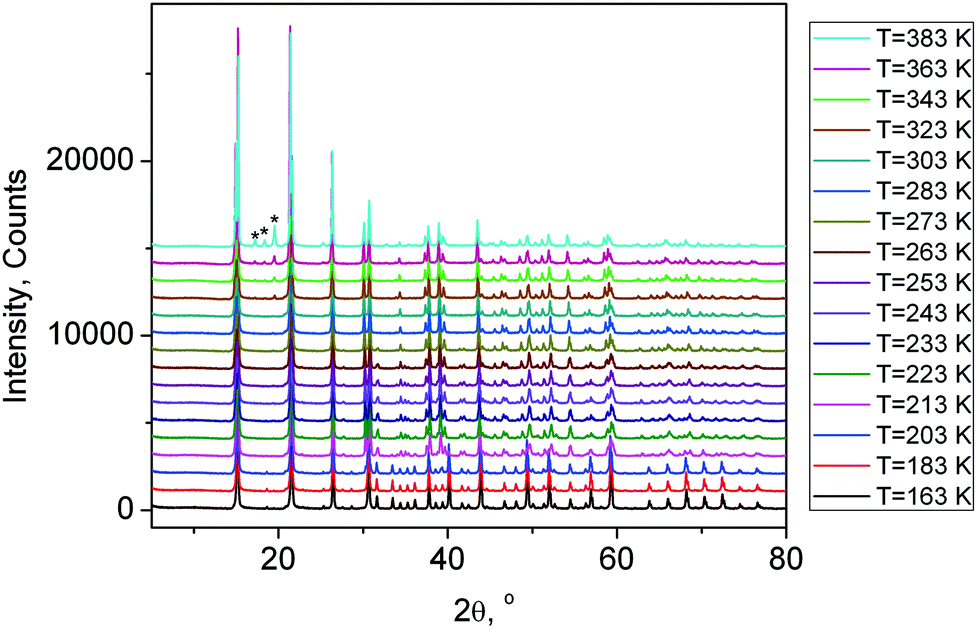 | ||
| Fig. 5 X-ray powder diffraction patterns of (NH4)3GeF7 at different temperatures from 163 K to 383 K. The peaks of the impurity phase of (NH4)2GeF6 appeared at T = 323 K are marked by stars. | ||
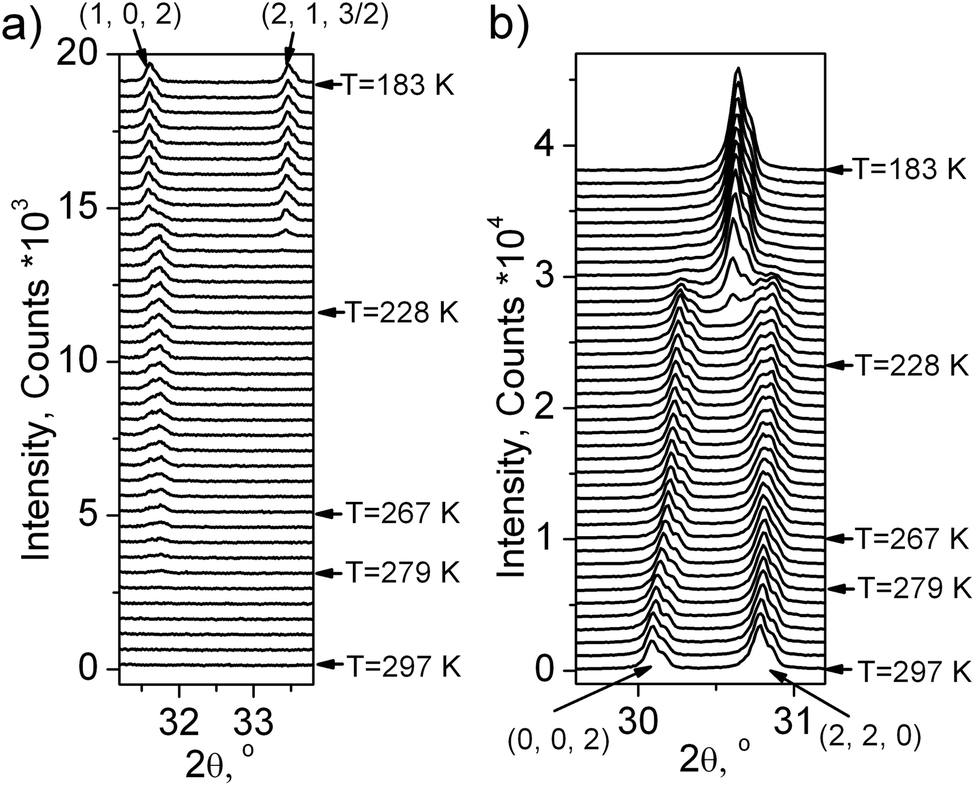 | ||
| Fig. 6 Fragment of X-ray powder diffraction patterns of (NH4)3GeF7 with: (a) superstructure peaks (1, 0, 2) and (2, 1, 3/2) which are prohibited in the G1 tetragonal phase (P4/mbm); (b) structure peaks (0, 0, 2) and (2, 2, 0) of the G1 tetragonal phase. | ||
Using this information and the program ISODISTORT21 it was found that only three space groups fulfilled all these conditions: (1) Pbam with the unit cell transformation matrix (1,1,0),(−1,1,0),(0,0,1); (2) Pmma (−1,1,0),(0,0,1),(1,1,0); (3) Pmmm (1,1,0),(−1,1,0),(0,0,1). As Pbam has the highest symmetry among them, it was decided to use it for Rietveld refinement of the distorted phase G1. The M1− ⊕ M4− irrep drives this PT, and the transformation can be written as:  , where η1 and η2 are the components of critical order parameters (OP). The direct sum of an irrep M1− and a complex conjugate M4−, which is the physically irreducible representation M1− ⊕ M4−, was taken since the irrep M1− is a complex. The crystal structure for Rietveld refinement in TOPAS 4.2 was prepared by the program ISODISTORT using the initial G1 phase (P4/mbm) and M1− ⊕ M4− irrep distortion. The refinement was stable and gave low R-factors (Table 1 and Fig. 1S(b)†). Atomic coordinates are given in Table 1S,† the crystal structure is presented in Fig. 2S(b)†.
It is well-known that group-theoretical analysis allows identification of critical OP and critical distortions of the crystal structure, which determines the symmetry of the distorted phase.22 Critical OP together with noncritical OP, which does not lead to a symmetry change, form a complete condensate of OP.23 Group-theoretical analysis shows only the presence of critical and noncritical OP, but the numerical values of critical/noncritical OP and distortions are obtained from the experimental data, and the structural data are better in this case.
So, it was found that at PT P4/mbm ↔ Pbam, the Ge, F2, F3 and N2 atomic sites were splitting: Ge → Ge1 + Ge2; F2 → F2 + F3; F3 → F4 + F5; N2 → N2 + N3. Other sites remain unsplit. Only fluorine and ammonium ions are shifted at PT, and the largest shifts of 0.67 Å and 0.36 Å are observed for F2 and F5, respectively. The critical irrep M1− ⊕ M4− induces the greatest contribution to these distortions and leads to a critical shift of F2 on 0.66 Å along the a axis and that of F5 on 0.35 Å along the b axis of the orthorhombic phase. These movements can be represented as the rotation of the Ge1F6 octahedron on a large angle ∼23° around the 4-fold axis in a tetragonal phase (Fig. 7a and b). The Ge2F6 octahedron does not virtually change its orientation. The ammonium shifts are smaller: N1 (∼0.27 Å), N2 (∼0.2 Å) and N3 (∼0.1 Å). However, the largest contribution to distortion is due to the critical irrep M1− ⊕ M4−, leading to N1 and N3 shifts in the ab plane of the orthorhombic phase, preferably along the b axis, whereas N2 is preferably shifted along the a axis. Since F1 is only slightly displaced (∼0.08 Å), but NH4 undergoes great shifts, then F1 is shifted from the F1N6 octahedron center, staying exactly in the center of the tetragonal unit cell (Fig. 7b). The F1–N bond lengths vary in the range of 2.931(5)–2.970(1) Å for the tetragonal phase and they become 2.75(2)–3.13(2) Å for the orthorhombic phase. The decreasing of these bond distances may be due to the formation of stronger N–H⋯F hydrogen bonds.
 | ||
| Fig. 7 The main distortions of the (NH4)3GeF7 crystal structure at PTs, leading to rotation of Ge1F6 octahedra during the G1 ↔ G2 transformation (a, b), and to rotation of Ge1F6 and Ge2F6 octahedra in the monoclinic phase G3 (c) in two projections. Dashed red square surrounds the formula unit of different phases. | ||
The geometry of twinning, rotation of the optical indicatrix in the twin (II) and the absence of rotation in the twin (I) indicate the G3 phase to be of monoclinic symmetry with a twofold axis along one of the two [110]t = [010]or directions. Therefore, the crystal symmetry group in this phase can be selected as monoclinic P121/c1. The screw twofold axis is perpendicular to the former fourth-order axis and directed along [010]or of an orthorhombic unit cell of the G2 phase. Such a crystallographic set requires an explanation of the data given in Fig. 3 (curves 1 and 2). The curve 1 is the Δna (T) dependence obtained from measurements in the twin (I) without rotation of the indicatrix. Accordingly, the curve 2 is Δnb (T) obtained in (II).
The X-ray experiment of the G3 phase (Fig. 1S(c)†) reveals that the main peak broadening occurs, but there are no additional superstructure peaks, therefore it can be concluded that this PT is associated with the emergence of instability at the same (1/2, 1/2, 0) k18-point (M) of the Brillouin zone of P4/mbm. Optical investigations showed a monoclinic symmetry of this phase, a unique axis b should be perpendicular to the 4-fold axis and directed along the unit cell diagonals of the tetragonal G1 phase. Similarly to G1 ↔ G2, this G2 ↔ G3 PT is of the second order type. Only one space group fulfills all these conditions, namely P21/c (0,0,1),(1,1,0),(−1,1,0). The M5− irrep drives this PT and the transformation can be written as:  , where (ξ, ξ) is another critical order parameter, which is transformed according to the M5− irrep of the sp.gr. P4/mbm. The crystal structure for Rietveld refinement in TOPAS 4.2 was prepared by the program ISODISTORT using M5− irrep distortion. Refinement was stable and gave low R-factors (Table 1 and Fig. 1S(c)†). Atomic coordinates are presented in Table 1S,† the crystal structure is shown in Fig. 2S(c).†
This PT can be considered as transition from the initial phase to the monoclinic phase P4/mbm ↔ P21/c. Fluorine sites split further as F3 → F4 + F5 + F6 + F7, while the other sites remain unsplit like those in the orthorhombic phase Pbam. Fluorine and ammonium ions experience shifts at PT to the P21/c phase like those in the Pbam phase. F3 and F4 have the largest shifts to 0.73 Å and 0.61 Å, respectively. The other fluorine shifts are in the range of 0.25–0.37 Å. The critical irrep M1− ⊕ M4− induces a majority of distortions, leading to rotation not only in Ge1F6, but also to that of Ge2F6 in the cb plane of the monoclinic phase. These octahedra are simultaneously rotated in the ca plane (Fig. 7c) that is induced by the critical M5− irrep. The shifts of N1 (∼0.39 Å), N2 (0.16 Å) and N3 (0.21 Å) atoms are also basically induced by M1− ⊕ M4− and M5− irreps. Herewith the greatest displacement of N1 on ∼0.27 Å, which occurs along the a axis of the monoclinic unit cell, is induced by M5− irrep. Such ammonium displacements lead not only to a shift of F1 from the F1N6 octahedron center in the cb plane, but also to a noticeable shift along a axis of the monoclinic cell (the former 4-fold axis) (Fig. 7c). A rather short F1–N bond of 2.56(1) Å is formed, which indicates the N1–H⋯F1 hydrogen bond. In general, the range of F1–N distances expands to 2.56(1)–3.24(2) Å.
Below the transition at T2 accompanied by the symmetry change Pbam ↔ P21/c, a shear deformation with component x5 (within the orthorhombic cell) appears causing rotation of the optical indicatrix at an unusually large angle ϕ ∼ 25°. Such great rotation angles of the indicatrix ϕ(T) are characteristic of the “proper” ferroelastic transitions when a parameter of transition ξ is linearly related to the shear component of the spontaneous deformation ξ ∼ x5.24 For example, CsLiSO4 and CsLiCrO4 also belong to the class of “proper” ferroelastics with the observed value of rotation angles of the indicatrix of 30–40°.25,26
It should be noted that the above mentioned shear component x5 within the orthorhombic cell transforms to x5 and x6 within the initial tetragonal phase. The components of shear strain x5 and x6 are converted by a two dimensional irrep Γ5+k17-point (Γ) (0, 0, 0) of the Brillouin zone of the P4/mbm cell. Thus, the transformation properties of the phenomenological parameter components of transition (ξ,ξ) are the same as those of shear strain x5 and x6. In this case the components of OP (ξ,ξ) are linearly related to the components of shear strain, i.e. (ξ,ξ) ∼ (x5,x6).
Below T3↓ = 218 K, the optically isotropic cubic phase was observed, where an additional wave of superstructure peaks appeared (Fig. 5 and 6a). However, main peaks collapsed in one peak after PT (Fig. 6b). It is a very strange situation because an ordinary situation is the splitting of peaks during cooling. The indexing shows that a cell in the G4 phase becomes a cubic (Pa). A similar situation was observed in (NH4)3TiF7, which underwent a reconstructive PT P4/mnc ↔ Pa with increasing symmetry under cooling.14 It should be noted that (NH4)3SnF7 has PT Pmm ↔ Pa with the same low temperature phase Pa,13 as well as (NH4)3WO2F5.7 All these phases have the same high temperature parent phase Pmm and, as it turns out, have the same lowest temperature fully ordered phase Pa. Therefore, the crystal structure of (NH4)3TiF7 was taken as a starting model for refinement of the G4 phase. The NH4 group was refined as a rigid body similarly to that prepared in ref. 14. The refinement was stable and gave low R-factors (Table 1 and Fig. 1S(d)†). The atomic coordinates are given in Table 1S,† the crystal structure is shown in Fig. 1S(d).†
Phase transition P4/mbm ↔ Pa cannot be described by group-theoretical methods since this PT is reconstructive and large rotations of octahedra up to 45° appear. Similar reconstructive PTs were found earlier and studied.13,15 It should be noted that all hydrogen atoms of NH4+ were localized and refined for the Pa phase. However, the powder diffraction method is not very reliable, and it is still questionable whether NH4+ ions remain ordered or not.15 Rather small values of F1–N distances of 2.663(7)–3.184(7) Å indicate the formation of N–H⋯F hydrogen bonds.
All patterns from 163 K to 383 K were treated in a similar way and the temperature dependence of the cell parameters (Fig. 3S(a)†) and cell volume (Fig. 3S(b)†) was plotted. It should be noted that the peaks of the impurity phase (NH4)2GeF6 appeared at T = 323 K (Fig. 5), therefore, the decomposition process (NH4)3GeF7 → (NH4)2GeF6 + NH3 + HF started at this temperature under heating.
Further details of the crystal structures of G1, G2, G3 and G4 phases may be obtained from Fachinformationszentrum Karlsruhe, 76344 Eggenstein-Leopoldshafen, Germany (fax: (+49)7247-808-666; E-mail: crystdata@fiz-karlsruhe.de; http://www.fiz-karlsruhe.de/request_for_deposited_data.html on quoting the deposition numbers: CSD 430463, CSD 430464, CSD 430465 and CSD 430466, respectively.
4 Conclusions
Similarities and differences between two closely related double salts (NH4)3GeF7 = (NH4)3[GeF6]F and (NH4)3TiF7 = (NH4)3[TiF6]F are highlighted. Both compounds have a number of phase transitions with an unusual sequence of symmetry change, including the low-temperature phase with a cubic symmetry. The temperature dependence of unusual sequences of symmetry changes for the (NH4)3GeF7 crystal is as follows: P4/mbm (Z = 2) (G1) ↔ Pbam (Z = 4) (G2) ↔ P21/c (Z = 4) (G3) ↔ Pa (Z = 8) (G4). The tetragonal symmetry of the G1 phase is stable: in the temperature range of 280–380 K the changes of optical anisotropy are weak; the 4-fold axis does not change its direction during uniaxial compression up to crystal destruction. This probably means that in contrast to (NH4)3TiF7, wherein the high-pressure parent phase G0 with Pmm symmetry was found,15 such a phase is unattainable for (NH4)3GeF7.
The driving force of all phase transitions in (NH4)3GeF7 can be associated with the emergence of hydrogen bonds N–H⋯F, because the value of N⋯F contacts decreases at PT under cooling. Such bond length shortening is connected with the F shift from the center of the FN6 octahedron and its distortion. The largest ionic displacements at all PTs are associated with the GeF6 octahedron. Their movements can be represented as rotation of the Ge1F6 octahedron at PT P4/mbm ↔ Pbam, rotation of Ge1F6 and Ge2F6 octahedra around two directions at P4/mbm ↔ P21/c, and huge rotations of all GeF6 octahedra due to reconstructive PT P4/mbm ↔ Pa.
A final scheme of phase transitions including irreducible representations and the corresponding order parameters can be written as:
 . The components of OP (ξ,ξ) at PT P4/mbm ↔ P21/c are linearly related to the components of shear strain x5 and, therefore, this compound belongs to the class of “proper” ferroelastics with a large value of rotation angles of the indicatrix.
Acknowledgements
The reported study was partially supported by RFBR, research project no. 15-02-02009 a.Notes and references
- D. L. Deadmore and W. F. Bradley, Acta Crystallogr., 1962, 15, 186–189 CrossRef CAS.
- J. L. Hoard and M. B. Williams, J. Am. Chem. Soc., 1942, 64, 633–637 CrossRef CAS.
- C. Plitzko and G. Meyer, Z. Kristallogr., 1988, 213, 475–475 Search PubMed.
- A. Vasiliev and N. Laptash, Inst. of Physics Krasnoyarsk, Russia, ICDD Grant-in-Aid, 2003.
- C. Plitzko and G. Meyer, Z. Anorg. Allg. Chem., 1997, 623, 1347–1348 CrossRef CAS.
- U. Reusch and E. Schweda, Mater. Sci. Forum, 2001, 378–381, 326–330 CrossRef CAS.
- A. A. Udovenko and N. M. Laptash, Acta Crystallogr., Sect. B: Struct. Sci., 2015, 71, 478–483 CAS.
- N. M. Laptash and L. N. Kurilenko, RU Patent2157523, 2000 Search PubMed.
- N. M. Laptash, I. G. Maslennikova, L. N. Kurilenko and N. M. Mishchenko, Russ. J. Inorg. Chem., 2001, 46, 28–34 Search PubMed.
- N. M. Laptash, E. I. Melnichenko, S. A. Polyshchuk and T. A. Kaidalova, J. Therm. Anal., 1992, 38, 2335–2341 CrossRef CAS.
- G. Meyer, Z. Anorg. Allg. Chem., 2008, 634, 201–222 CrossRef CAS.
- J. Yota and V. A. Burrows, J. Appl. Phys., 1991, 69, 7369–7371 CrossRef CAS.
- I. N. Flerov, M. S. Molokeev, N. M. Laptash, A. A. Udovenko, E. I. Pogoreltsev, S. V. Mel'nikova and S. V. Misyul, J. Fluorine Chem., 2015, 178, 86–92 CrossRef CAS.
- S. V. Mel'nikova, E. I. Pogoreltsev, I. N. Flerov and N. M. Laptash, J. Fluorine Chem., 2014, 165, 14–19 CrossRef.
- M. S. Molokeev, S. V. Misjul, I. N. Flerov and N. M. Laptash, Acta Crystallogr., Sect. B: Struct. Sci., 2014, 70, 924–931 CAS.
- E. I. Pogoreltsev, I. N. Flerov, A. V. Kartashev, E. V. Bogdanov and N. M. Laptash, J. Fluorine Chem., 2014, 168, 247–250 CrossRef CAS.
- I. C. Madsen and R. J. Hill, J. Appl. Crystallogr., 1994, 27(3), 385–392 CrossRef CAS.
- Bruker AXS TOPAS V4: General profile and structure analysis software for powder diffraction data. – User's Manual, Bruker AXS, Karlsruhe, Germany, 2008 Search PubMed.
- O. V. Kovalev, Representation of Crystallographic Space Groups, CRC Press, 1993 Search PubMed.
- S. C. Miller and W. F. Love, Tables of Irreducible Representations of the Space Groups and Co-Representations of Magnetic Space Groups, Pruett Press Boulder, Colorado, 1967 Search PubMed.
- D. M. Hatch and H. T. Stokes, Phys. Rev. B: Condens. Matter, 1985, 31, 2908–2912 CrossRef CAS.
- K. S. Aleksandrov and S. V. Misjul, Kristallografiya, 1981, 26(5), 1074–1085 CAS.
- V. P. Sakhnenko, V. M. Talanov and G. M. Chechin, Fiz. Met. Metalloved., 1986, 62(5), 847–856 CAS.
- H. Ozeki and A. Sawada, J. Phys. Soc. Jpn., 1982, 51, 2047–2048 CrossRef CAS.
- A. Pietraszko, P. Tomaszewski and K. Lukaszewiez, Phase Transitions, 1981, 2, 141–150 CrossRef CAS.
- K. S. Aleksandrov, S. V. Mel'nikova, A. I. Kruglik, S. M. Tret'yak and V. V. Mitkevich, Kristallografiya, 1989, 34, 147–153 CAS.
Footnote |
| † Electronic supplementary information (ESI) available. See DOI: 10.1039/c5dt04907e |
| This journal is © The Royal Society of Chemistry 2016 |