 Open Access Article
Formazanido complexes of heavier group 13 elements aluminium, gallium, and indium†
W.
Schorn
,
D.
Grosse-Hagenbrock
,
B.
Oelkers‡
 and
J.
Sundermeyer
*
Fachbereich Chemie der Philipps-Universität Marburg and Materials Science Center, Hans-Meerwein-Straße 4, 35307 Marburg, Hessen, Germany. E-mail: jsu@staff.uni-marburg.de
First published on 26th November 2015
Abstract
The preparation, molecular structures and physical properties of novel heavy group 13 metal formazanido complexes are described. The trimethyl derivatives MMe3 (M = Al, Ga, In) react with 1,3,5-triphenylformazan (Htpf) in a 1![[thin space (1/6-em)]](https://www.rsc.org/images/entities/char_2009.gif) :
:![[thin space (1/6-em)]](https://www.rsc.org/images/entities/char_2009.gif) 1 ratio to give methane and metallacycles of the type [M(tpf)Me2]. While [Al(tpf)Me2] and [Ga(tpf)Me2] are mononuclear compounds with six-membered rings and coordination number 4 in solution and in the crystalline state, indium derivative [In(tpf)Me2] forms oligomers in non-coordinating solvents according to NMR studies, these are probably N-bridged dimers with coordination number 5 at indium. The oligomer is cleaved by addition of one equivalent of pyridine or 4-dimethylaminopyridine (DMAP). The complexes [M(tpf)Me2] (M = Al, Ga) and [In(tpf)Me2(DMAP)] are characterized by XRD analyses. They are unique examples of main group metal formazane ring systems of the third and higher periods. The UV-Vis solution spectra of the neutral ligand Htpf and its metallated compounds [M(tpf)Me2] (M = Al, Ga, In) are discussed.
1 ratio to give methane and metallacycles of the type [M(tpf)Me2]. While [Al(tpf)Me2] and [Ga(tpf)Me2] are mononuclear compounds with six-membered rings and coordination number 4 in solution and in the crystalline state, indium derivative [In(tpf)Me2] forms oligomers in non-coordinating solvents according to NMR studies, these are probably N-bridged dimers with coordination number 5 at indium. The oligomer is cleaved by addition of one equivalent of pyridine or 4-dimethylaminopyridine (DMAP). The complexes [M(tpf)Me2] (M = Al, Ga) and [In(tpf)Me2(DMAP)] are characterized by XRD analyses. They are unique examples of main group metal formazane ring systems of the third and higher periods. The UV-Vis solution spectra of the neutral ligand Htpf and its metallated compounds [M(tpf)Me2] (M = Al, Ga, In) are discussed.
Introduction
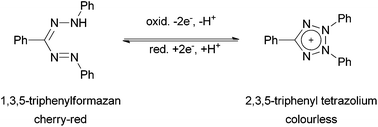
Since the first description of 1,3,5-triphenylformazan (Htpf, 1) in 1884 by Pinner,1 formazans and complexes derived therefrom have become an interesting class of dyes and coloured organic ligands with a number of applications as coloured indicators for several metal ions.2,3 The intrinsic redox chemistry of the ligand was used as a measure for seed germinability,4 since colourless tetrazolium cations can be reduced to coloured formazans by vital tissues (Scheme 1).Even more interesting redox behaviour was discovered in 1964 by Kuhn et al.5N-Methylation of formazans and subsequent oxidation resulted in the formation of so-called verdazyls (Scheme 2). These are air- and water-stable, purely organic radicals that can be isolated and stored over months without decomposition.6
More recently, it was discovered by the groups of Hicks, Otten and Gilroy,7–9 that the unique stability of these nitrogen-rich radicals can also be observed in isoelectronically related boron compounds and borataverdazyl radical anions (Scheme 3).
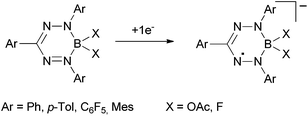 | ||
| Scheme 3 Boron formazan complexes.7–9 | ||
In sharp contrast the coordination chemistry of these formazanes and anionic formazanido ligands towards transition metals has a long-standing tradition following pioneering work of Bamberger et al.10 However, despite of a variety of methods available for their synthesis,1,11–14 formazan complexes typically have been limited to N,N-diaryl ligands. Recently their transition metal chemistry has experienced a renaissance arising from the insight that formazanido ligands are aza-analogues of most prominent β-ketiminato(1−) ligands.15,16 However, in sharp contrast to β-ketiminato(1−) ligands, the non-innocent formazanido(1−) ligand can be reversibly reduced to the complex-stabilized radical dianionic (2−) state, e.g., in the zinc complex shown in Scheme 4.7,17–20
 | ||
| Scheme 4 Redoxactive zinc formazanido complexes.19 | ||
Next to the abovementioned boron compounds, the only other well characterized main group element formazanido complexes described so far are some structurally characterized alkali metal formazanides.21 In this paper, we describe the first formazanido(1−) compounds of the three heavier group 13 elements aluminium, gallium and indium.
Results and discussion
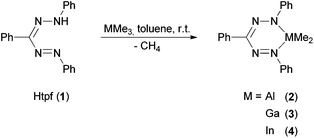
We realized that triphenyl formazane (Htpf, 1) reacts selectively with trimethyl alane, gallane and indane under elimination of methane. The isolated products gave elemental analyses and HR-EI mass spectra in accord with the sum formula C21H21MN4 (M = Al (2), Ga (3), In (4)) (Scheme 5).In the 1H NMR spectra of 2–4 the absence of any N–H protons of the neutral ligand is observed. The integral ratios clearly give evidence of the presence of a deprotonated ligand moiety and one dimethyl fragment MMe2 (M = Al, Ga, In).
The NMR spectra of 2 and 3 show signal patterns that match the expected spectra for C2- or Cs-symmetric compounds: one signal for both MMe2 groups (M = Al, Ga) as well as the magnetic equivalence of the two peripheral N-phenyl rings lead to the assumption that 2 and 3 exist as six-membered MN4C rings with tetrahedrally coordinated Al3+ and Ga3+ in solution. This corresponds to the structure in the crystalline state (see XRD analysis below). No further reaction of 2 and 3 with excess 1 was observed in hot toluene, a consequence of steric and electronic saturation by the set of donor ligands.
The NMR spectra of indium complex 4 differ from the aforementioned ones: two methyl signals for the InMe2 moiety and three magnetically non-equivalent phenyl rings are observed in C6D6. This can be explained by the fact that due to the much larger ionic radius of In3+ (80 pm) compared to Al3+ (53.3 pm) and Ga3+ (62 pm) [In(tpf)Me2] forms dimers or oligomers in non-coordinating solvents.22 This is most likely accomplished by bridging metallated N-atoms, as these are the most nucleophilic donors. This in turn would lead to coordination number five at indium, formation of a In2N2 core and loss of C2- or Cs-symmetry in non-coordinating solvents. In accord with this assumption, addition of three-molar excess [D5]-pyridine to the NMR sample of 4 in C6D6 resulted in the observation of only one set of methyl and N-phenyl protons at 25 °C similar to the spectra of 2 and 3. This is most likely a result of pyridine coordination and dimer/oligomer dissociation. While the isolated DMAP complex 5 shows no symmetry in the solid state and solution (see below), it is proposed that 4 + [D5]-pyridine undergoes rapid ligand exchange of coordinated and free pyridine with two exchanging pyridine coordination sites. In order to get more insight into this exchange process, a 1H-NMR spectrum was recorded at the low temperature limit: at −60 °C the resulting spectrum of 4 + [D5]-pyridine shows a clear splitting of the methyl signal, which is explained by slowing down the ligand exchange on the NMR time scale.
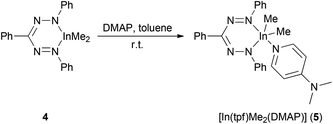
In order to gain final insight into the metal configuration involved in pyridine adducts, the strong donor 4-dimethylaminopyridine (DMAP) was added to 4 in toluene yielding [In(tpf)Me2(DMAP)] (5) as a microcrystalline deep blue compound (Scheme 6). The isolated complex 5 reveals two signals δIn–Me at room temperature and at −60 °C in CD2Cl2. This implies, that there is no plane of symmetry and no ligand exchange in the molecule in CD2Cl2 solution. This would be explainable e.g. by a non planar InN4C ring in case of a trigonal bipyramidal or tetragonal pyramidal indium complex (see below, result of the solid state structure).
UV-Vis spectra of the complexes and neutral ligand
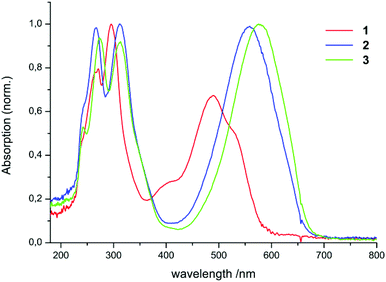
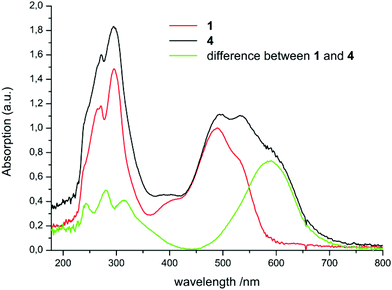
UV-Vis spectra of the compounds 1–5 were recorded in hexane.Spectra of 1–3 in hexane are shown in Fig. 1.
The complexes 2, 3, 4, and 5 dissolve with a blue colour in hexane, while 1 is red in solution. The spectra of 1, 2, and 3 show two distinct absorption regions: the first one lies in the UV region (1: 240–330 nm, 2: 240–340 nm, 3: 240–340 nm). This absorption can be explained by the excitation of the phenyl moieties of the ligand. The second one lies in the visible range (1![[thin space (1/6-em)]](https://www.rsc.org/images/entities/char_2009.gif) :
:![[thin space (1/6-em)]](https://www.rsc.org/images/entities/char_2009.gif) 450–540 nm, 2: 490–620 nm, 3: 510–640 nm). One interesting feature in the spectrum of 1 is the appearance of an additional weak band at 400 nm. This can be attributed to the absorption of the E,s-cis,E isomer of the neutral ligand 1. Hausser et al. could show14,23 that exposing formazan solutions to light (λ < 480 nm) leads to a colour change from red to yellow along with a shift of the absorption maximum from about 490 to 400 nm. This colour change is due to the photoinduced isomerization of one of the double bonds within the ligand backbone.
450–540 nm, 2: 490–620 nm, 3: 510–640 nm). One interesting feature in the spectrum of 1 is the appearance of an additional weak band at 400 nm. This can be attributed to the absorption of the E,s-cis,E isomer of the neutral ligand 1. Hausser et al. could show14,23 that exposing formazan solutions to light (λ < 480 nm) leads to a colour change from red to yellow along with a shift of the absorption maximum from about 490 to 400 nm. This colour change is due to the photoinduced isomerization of one of the double bonds within the ligand backbone.
Since the ratio of the intensities between the maximum at 400 nm and the remaining maxima varied during the measurements, no extinction coefficient was determined for 1. All absorption maxima and extinction coefficients are listed in Table 1.
| Substance | Absorption maximum/nm | Extinction coefficient/(L mol−1 cm−1) |
|---|---|---|
| a Estimated values from difference spectra of 1 and mixture (1 + 4). | ||
| Htpf (1) | 271, 295, 400, 490 | Not determined, see above |
| [Al(tpf)Me2] (2) | 267 | 16![[thin space (1/6-em)]](https://www.rsc.org/images/entities/char_2009.gif) 550 (±130) 550 (±130) |
| 312 | 16![[thin space (1/6-em)]](https://www.rsc.org/images/entities/char_2009.gif) 830 (±70) 830 (±70) |
|
| 559 | 16![[thin space (1/6-em)]](https://www.rsc.org/images/entities/char_2009.gif) 210 (±270) 210 (±270) |
|
| [Ga(tpf)Me2] (3) | 242 | 11![[thin space (1/6-em)]](https://www.rsc.org/images/entities/char_2009.gif) 370 (±440) 370 (±440) |
| 274 | 20![[thin space (1/6-em)]](https://www.rsc.org/images/entities/char_2009.gif) 860 (±360) 860 (±360) |
|
| 313 | 19![[thin space (1/6-em)]](https://www.rsc.org/images/entities/char_2009.gif) 960 (±180) 960 (±180) |
|
| 576 | 20![[thin space (1/6-em)]](https://www.rsc.org/images/entities/char_2009.gif) 960 (±200) 960 (±200) |
|
| [In(tpf)Me2] (4) | 243, 279, 314, 591a | Not determined, see below |
The spectra of 4 and 5 are more complicated. The most obvious reason is partial hydrolysis accompanying the dissolution of these extremely oxygen- and water-sensitive indium compounds at a sufficiently low molar concentration needed for UV-Vis measurements of compounds with such high extinction coefficients. The water content of n-hexane was checked to be <10 ppm.24 Nevertheless partial hydrolysis during the UV-Vis sample preparation and recording is indicated by the appearance of overlapping bands of Htpf 1 (Fig. 2). Two of the maxima of extreemly diluted 4 and 5 are identical with the spectrum of Htpf. A weak absorption at about 400 nm is characteristic for the aforementioned presence of the E,s-cis,E isomer of the neutral ligand. Therefore the absorption maxima for 4 in Table 1 are estimated values obtained by substracting the spectrum of pure 1 from the mixture of 4 and 1 (Fig. 2). Under these conditions it seems unappropriate to calculate extinction coefficients for 4. NMR samples of 4 or 5 recorded at higher concentration did not indicate any free ligand 1.
The determined absorption maxima and extinction coefficients are in agreement with reports of Berry et al.6 and Gilroy et al.12,25 They attribute the red shift of the complexes compared to the protonated neutral formazans to the fixed conformation and the anionic character of the ligand moiety. The comparison of our studies with a literature known boron complex shows that the higher aluminium, gallium, and indium analogues (2, 3, and 4, respectively) absorb increasingly more red-shifted (Scheme 7).
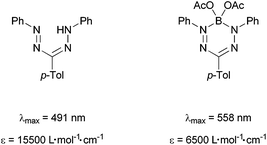 | ||
| Scheme 7 Extinction coefficients and absorption maxima of formazans and formazan complexes prepared by Berry et al.6 | ||
This can be explained with an increasingly anionic character of the ligand moiety going from boron to indium. Interestingly, the extinction coefficient of the boron complex lies considerably below its higher homologues aluminium and gallium. We plan to further investigate this trend by evaluation of HOMO and LUMO energies by a combined CV and theoretical study. A preliminary CV screening on 2–4 indicates irreversible redox processes that might be attributed to follow-up reactions of the labile radical metal alkyls. Therefore we are planning to apply electrochemically more robust metal ligands in this chemistry.
Crystal structures of Htfp (1), [Al(tpf)Me2] (2), [Ga(tpf)Me2] (3), and [In(tpf)Me2(DMAP)] (5)
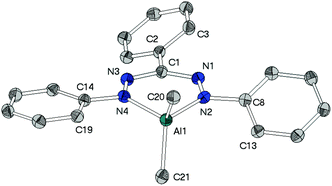
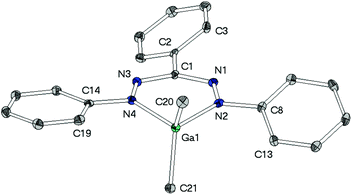
As a fundament for further theoretical studies the molecular structures of aluminium, gallium and indium complexes 2, 3, and 5 were determined by single crystal XRD analyses. | ||
| Scheme 8 Examples of tetrahedral complexes of the type.26,27 | ||
The heterocycles MN4C are nearly planar as shown by the sum of angles within these 6-membered cycles (2: 719.2(4)°, 3: 719.1(6)°). This planarity allows the methyl groups to avoid each other's steric demand leading to the widening of the angles CH3–M–CH3 (2: 117.0(1)°, 3: 121.6(1)°), which clearly deviate from the ideal tetrahedral angle of 109.5°.
While in neutral ligand Htpf 1 all three phenyl groups are coplanar to the inner HNNCNN ring, phenyl groups of 2 and 3 show no preference for a particular conformation: their torsion angles with respect to the ligand plane range from 9° to 28°. This difference is most likely due to steric repulsion between the ortho-protons of the peripheral phenyl substituents and the methyl groups of the MMe2-moiety.
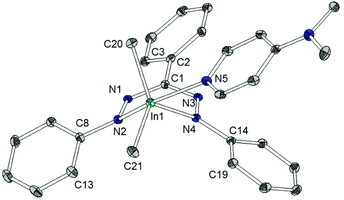
The indium coordination is inbetween the limits of a distorted square pyramid and a trigonal bipyramid: describing it in the latter configuration, the peripheral nitrogen atoms of the triphenylformazanido ligand occupy one apical and one equatorial position, whereas the DMAP ligand is bound via the other apical coordination site. The two remaining equatorial sites are occupied by two methyl groups. The indium–carbon bond lengths (2.153(2)/2.155(2) Å) show no significant difference to related complexes (Scheme 9).28,29
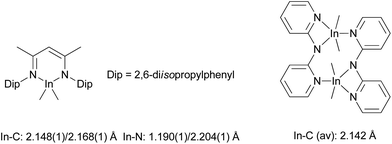 | ||
| Scheme 9 Examples of dimethylindium complexes.28,29 | ||
The shortest In–N distance of the formazan ligand is observed in the equatorial plane (In1–N4: 2.269(1) Å), indicating a localized amide character, while a longer In–N distance (In1–N5: 2.368(1) Å) is found towards the apical DMAP ligand and the longest one (In1–N2: 2.450(1) Å) corresponds to the (formally) neutral diazene –N![[double bond, length as m-dash]](https://www.rsc.org/images/entities/char_e001.gif) NPh donor trans to DMAP. This points out that the equivalence of both N-donor centers of tpf as observed for 2 and 3 is suspended upon coordination of DMAP by increasing the coordination number.
NPh donor trans to DMAP. This points out that the equivalence of both N-donor centers of tpf as observed for 2 and 3 is suspended upon coordination of DMAP by increasing the coordination number.
There are some further structural differences between 5 and the lighter homologues 2 and 3. In contrast to the aluminium and gallium complex the metallacycle in 5 shows a considerable deviation from planarity: the angle between the planes N1–N2–N3–N4 and N2–In1–N4 amounts to 130.9(1)° in 5 (2: 173.9(1)°, 3: 173.8(1)°). Thus the tpf complex 5 shows a deviation from ring planarity comparable with the doming of very large metal ions in porphyrins and phthalocyanins.30 This is due to the larger In3+ cation and the larger coordination number caused by the co-ligand DMAP, which pulls the cation out of the ligand plane.
Conclusions
Novel formazanido complexes of the higher group 13 elements Al, Ga and In are described. The complexes were fully characterized by NMR, IR, and UV-Vis spectroscopy as well as by combustion analyses, high resolution EI mass spectrometry, and crystal structure analyses. Thus these complexes represent the first structurally characterized formazanido main group metal complexes with the exception of a few alkali metal complexes and metalloid boron complexes. The compounds contain reactive metal carbon bonds suitable for further reactivity studies. Their UV-Vis spectra in hexane show a red shift compared to the neutral ligand 1,3,5-triphenylformazan which can be attributed to the anionic charge within the ligand of the complexes leading to a energetically higher HOMO and a larger HOMO–LUMO gap. This assumption will be further evaluated by a combined CV and DFT study including N,N-dialkyl formazanes and more robust non-alkyl metal complexes.Experimental
Materials and methods
All reactions were carried out under inert atmosphere using standard Schlenk techniques. Moisture and air sensitive substances were stored in a conventional nitrogen-flushed glovebox. The utilized solvents as well as deuterated solvents were distilled under nitrogen from an appropriate drying agent (hexane, toluene, THF, C6D6: Na/K) and stored under nitrogen over molecular sieves (4 Å). Commercially available 1,3,5-triphenylformazan (Htpf, >90%, Sigma-Aldrich) was recrystallized from a 2![[thin space (1/6-em)]](https://www.rsc.org/images/entities/char_2009.gif) :
:![[thin space (1/6-em)]](https://www.rsc.org/images/entities/char_2009.gif) 1 mixture of dry hexane/toluene. 4-Dimethylaminopyridine (DMAP) was used as obtained (Sigma-Aldrich). AlMe3, GaMe3 and InMe3 were condensed from commercially available MOVPE bubblers and destilled before use. Spectra were recorded on the following spectrometers: NMR: Bruker AC300, Bruker DRX400, and Bruker DRX500; IR: Bruker Alpha ATR-IR; EI-MS: Finnigan MAT95; UV-Vis: Avantes AvaSpec-2048, Varian Cary-5000. Elemental analysis were performed on an Elementar Vario-Micro-Cube.
1 mixture of dry hexane/toluene. 4-Dimethylaminopyridine (DMAP) was used as obtained (Sigma-Aldrich). AlMe3, GaMe3 and InMe3 were condensed from commercially available MOVPE bubblers and destilled before use. Spectra were recorded on the following spectrometers: NMR: Bruker AC300, Bruker DRX400, and Bruker DRX500; IR: Bruker Alpha ATR-IR; EI-MS: Finnigan MAT95; UV-Vis: Avantes AvaSpec-2048, Varian Cary-5000. Elemental analysis were performed on an Elementar Vario-Micro-Cube.
1H NMR (CD2Cl2, 300 MHz): δ = −0.03 (s, 6 H, InMe2), 2.96 (s, 6 H, NMe2), 6.42–6.44 (m, 2 H, InPy(meta)), 7.18–7.23 (m, 2 H, NPh(para)), 7.31–7.46 (m, 4 H, NPh(meta)), (m, 1 H, CPh(para)), (m, 2 H, CPh(meta)), 7.54–7.57 (m, 4 H, NPh(ortho)), 7.99–8.00 (m, 1 H, InPy(ortho)), 8.02 (m, 2 H, CPh(ortho)), 8.04–8.05 (m, 1 H, InPy(ortho)) ppm. Vt-1H NMR (CD2Cl2, 300 MHz, 213 K): δ = −0.24 (s, 2 H, InMe2), −0.12 (s, 4 H, InMe2) 2.88 (s, 6 H, NMe2), 6.28–6.29 (m, 2 H, InPy(meta)), 6.77–7.47 (m, 12 H, NPh(para), NPh(meta), (CPh(meta), NPh(ortho)), 7.60–7.62 (m, 2 H, CPh(ortho)), 7.72–7.74 (m, 2 H, InPy(ortho)), 8.05–8.06 (m, 1 H, CPh(para)) ppm. 13C{1H} NMR (CD2Cl2, 75 MHz): δ = −4.8 (AlMe2), 39.3 (s, NMe2) 107.0 (s, InPy(meta)), 120.9 (NPh(ortho)), 127.0 (s, CPh(ortho)), 127.1 (s, NPh(para)), 127.7 (CPh(para)), 128.5 (CPh(meta)), 129.7 (NPh(meta)), 129.9 (NCN), 149.3 (InPy(ortho)), 153.8 (NNC-Cquart), 154.9 (NN-Cquart) ppm. Anal. calc. for C28H31InN6: C, 59.37; H, 5.52; N, 14.84%. Found C, 59.03; H, 5.43; N, 14.98%. IR (neat, cm−1): 3062, 3031, 2968 2918, 1619, 1538, 1276, 1220, 1005, 802, 757, 475.
Single-crystal structure analyses
Crystallographic data are provided in Table 1 (ESI†). X-Ray data collection was performed via a Stoe IPDS II or Bruker D8 Quest area detector system using Mo-Kα radiation (λ = 71.073 pm). Stoe IPDS and Bruker SAINT software31 was used for integration and data reduction. Structure solution and refinement was done with the WinGX program suite32 using SIR92, SIR2004, SUPERFLIP and SHELX2014.33For Htpf (1), the N–H proton H1 was located between the two nitrogen atoms N2 and N4. Within the accuracy of the measurement, no clear decision could be made as to whether a rather symmetric configuration or a superposition of two “normal” N–H⋯H configurations was present. As the former was the natural interpretation of the electron density map, it was arbitrarily chosen in this case.
Acknowledgements
This work was partly funded by DFG within GRK 1782. We thank the Crystallographic Service group, namely Dr K. Harms and associates, of the Fachbereich Chemie for XRD data collection.References
- A. Pinner, Ber. Dtsch. Chem. Ges., 1884, 17, 182 CrossRef.
- A. G. Ciba, CH246475, 1947 Search PubMed.
- R. M. Rush and J. H. Yoe, Anal. Chem., 1954, 26, 1345 CrossRef CAS.
- G. Lakon, Plant Physiol., 1949, 24, 389 CrossRef CAS PubMed.
- R. Kuhn and H. Trischmann, Monatsh. Chem., 1964, 95, 457 CrossRef CAS.
- (a) F. A. Neugebauer and R. Siegel, Angew. Chem., Int. Ed. Engl., 1973, 85, 485 CrossRef CAS; (b) B. D. Koivisto and R. G. Hicks, Coord. Chem. Rev., 2005, 249, 2612 CrossRef CAS; (c) D. E. Berry, R. G. Hicks and J. B. Gilroy, J. Chem. Educ., 2009, 86, 76 CrossRef CAS.
- J. B. Gilroy, M. J. Ferguson, R. McDonald, B. O. Patrick and R. G. Hicks, Chem. Commun., 2007, 126 RSC.
- M.-C. Chang and E. Otten, Chem. Commun., 2014, 50, 7431 RSC.
- S. M. Barbon, J. T. Price, P. A. Reinkeluers and J. B. Gilroy, Inorg. Chem., 2014, 53, 10585 CrossRef CAS PubMed.
- E. Bamberger and E. Wheelright, Ber. Dtsch. Chem. Ges., 1892, 25, 3201 CrossRef.
- H. von Pechmann, Ber. Dtsch. Chem. Ges., 1892, 25, 3175 CrossRef.
- J. B. Gilroy, P. O. Otieno, M. J. Ferguson, R. McDonald and R. G. Hicks, Inorg. Chem., 2008, 47, 1279 CrossRef CAS PubMed.
- D. Jerchel and H. Fischer, Justus Liebigs Ann. Chem., 1949, 563, 200 CrossRef CAS.
- I. Hausser, D. Jerchel and R. Kuhn, Chem. Ber., 1949, 82, 515 CrossRef CAS.
- L. Bourget-Merle, M. F. Lappert and J. R. Severn, Chem. Rev., 2002, 102, 3031 CrossRef CAS PubMed.
- Y.-C. Tsai, Coord. Chem. Rev., 2012, 256, 722 CrossRef CAS.
- S. Hong, L. M. R. Hill, A. K. Gupta, B. D. Naab, J. B. Gilroy, R. G. Hicks, C. J. Cramer and W. B. Tolman, Inorg. Chem., 2009, 48, 4514 CrossRef CAS PubMed.
- J. B. Gilroy, M. J. Ferguson, R. McDonald and R. G. Hicks, Inorg. Chim. Acta, 2008, 361, 3388 CrossRef CAS.
- M.-C. Chang, T. Daun, D. P. Day, M. Lutz, G. G. Wildgoose and E. Otten, Angew. Chem., Int. Ed., 2014, 53, 4118 CrossRef CAS PubMed.
- M.-C. Chang, P. Roewen, R. Travieso-Puente, M. Lutz and E. Otten, Inorg. Chem., 2015, 54, 379 CrossRef CAS PubMed.
- R. Travieso-Puente, M.-C. Chang and E. Otten, Dalton Trans., 2014, 43, 18035 RSC.
- R. D. Shannon, Acta Crystallogr., Sect. A: Cryst. Phys., Diffr., Theor. Gen. Cryst., 1976, 32, 751 CrossRef.
- I. Hausser, D. Jerchel and R. Kuhn, Chem. Ber., 1949, 82, 195 CrossRef CAS.
- The water contents of the solvents were determined by Karl Fischer titration: hexane 6.5 ppm, THF 8.9 ppm.
- J. B. Gilroy, B. O. Patrick, R. McDonald and R. G. Hicks, Inorg. Chem., 2008, 47, 1287 CrossRef CAS PubMed.
- H. Gornitzka and D. Stalke, Organometallics, 1994, 13, 4398 CrossRef CAS.
- D. Vidovic, J. N. Jones, J. A. Moore and A. H. Cowley, Z. Anorg. Allg. Chem., 2005, 631, 2888 CrossRef CAS.
- H. Gornitzka, Eur. J. Inorg. Chem., 1998, 3, 311 CrossRef.
- M. Stender, B. E. Eichler, N. J. Hardman, P. P. Power, J. Prust, M. Noltemeyer and H. W. Roesky, Inorg. Chem., 2001, 40, 2794 CrossRef CAS PubMed.
- K. M. Kadish, K. M. Smith and R. Guilard, Academic Press, San Diego, The porphyrin handbook, 2000 Search PubMed.
- (a) STOE X-AREA and X-RED, Stoe & Cie GmbH, Darmstadt, Germany, 2001 Search PubMed; (b) Bruker SAINT, Bruker AXS Inc., Madison, Wisconsin, USA, 2012 Search PubMed.
- L. J. Farrugia, J. Appl. Crystallogr., 1999, 32, 837 CrossRef CAS.
- (a) A. Altomare, G. Cascarano, C. Giacovazzo and A. Guagliardi, J. Appl. Crystallogr., 1993, 26, 343 CrossRef; (b) M. C. Burla, M. Camalli, B. Carrozzini, G. L. Cascarano, C. Giacovazzo, G. Polidori and R. Spagna, J. Appl. Crystallogr., 2003, 36, 1103 CrossRef CAS; (c) L. Palatinus and G. Chapuis, J. Appl. Crystallogr., 2007, 40, 786 CrossRef CAS; (d) G. M. Sheldrick, Acta Crystallogr., Sect. C: Cryst. Struct. Commun., 2015, 71, 3 CrossRef PubMed.
Footnotes |
| † Electronic supplementary information (ESI) available: NMR spectra and details of the crystal structure analyses. CCDC 1414630–1414633. For ESI and crystallographic data in CIF or other electronic format see DOI: 10.1039/c5dt03906a |
| ‡ Current address: Fachbereich Chemie der TU Kaiserslautern, Erwin-Schrödinger-Straße 54, 67663 Kaiserslautern, Germany. |
| This journal is © The Royal Society of Chemistry 2016 |

