 Open Access Article
Creative Commons Attribution 3.0 Unported Licence
Practical aspects of real-time reaction monitoring using multi-nuclear high resolution FlowNMR spectroscopy†
Andrew M. R.
Hall
a,
Jonathan C.
Chouler
a,
Anna
Codina
b,
Peter T.
Gierth
b,
John P.
Lowe
*c and
Ulrich
Hintermair
*a
aCentre for Sustainable Chemical Technologies, University of Bath, Bath BA2 7AY, UK. E-mail: u.hintermair@bath.ac.uk
bBruker UK Ltd., Banner Lane, Coventry CV4 9GH, UK
cDepartment of Chemistry, University of Bath, Bath BA2 7AY, UK. E-mail: j.lowe@bath.ac.uk
First published on 19th September 2016
Abstract
FlowNMR spectroscopy is an excellent technique for non-invasive real-time reaction monitoring under relevant conditions that avoids many of the limitations that bedevil other reaction monitoring techniques. With the recent commercial availability of FlowNMR hard- and software solutions for high resolution spectrometers it is enjoying increased popularity in both academia and industry. We present an account on practical aspects of high field multi-nuclear FlowNMR for reaction monitoring including apparatus design, flow effects, acquisition parameters and data treatment, which are important to consider if accurate kinetic data are to be obtained from FlowNMR experiments. Flow effects on NMR peak areas are particularly important as they can lead to large quantification errors if overlooked, but can easily be corrected for and even used to increase temporal resolution with suitably adjusted instrument settings.
Introduction
The ability to monitor chemical reactions by simultaneously following the concentration of different species in real time under reaction conditions is a vital tool for determination of reaction kinetics and elucidation of reaction mechanisms, as well as for process development and monitoring on an industrial scale. In principle a variety of methods are suitable for application in real-time reaction monitoring, including spectroscopic techniques such as infrared (IR), Raman, ultraviolet-visible (UV-vis) and nuclear magnetic resonance (NMR) spectroscopies along with other methods such as calorimetry, mass spectrometry, electrochemistry, chromatography and chemical analysis. In practice, the ideal reaction monitoring technique would provide information about all species within a reaction mixture under normal reaction conditions, with high sensitivity and temporal resolution, whilst remaining accessible to a non-specialist and at minimum cost. Whilst none of the above methods are able to fulfil these rather exacting conditions, one of the most commonly used techniques is NMR spectroscopy, which is particularly useful due to the large amount of information it can provide about the structure of the species under investigation and its inherently quantitative nature.Reaction monitoring techniques may be coupled directly to a reaction vessel, with a probe inserted into the vessel (in situ or in-line monitoring) or with the reaction vessel connected to the instrument via hyphenated tubing (on-line monitoring). Alternatively, reaction monitoring may be performed remotely from the reaction vessel by sampling (at-line or off-line monitoring). In situ methods are generally preferred as they do not introduce sampling delays and minimise the risk of disturbing the reaction system or changing the aliquot taken, which is vital for accurate mapping of the reaction kinetics. Reaction monitoring by NMR is typically performed either by off-line sampling or by in situ monitoring of a reaction carried out on a small scale in a standard sample tube within the spectrometer.1 Despite the many intrinsic benefits of NMR spectroscopy both approaches have significant practical limitations: off-line sampling introduces delays in the order of several minutes and exposes the sample to different conditions potentially leading to compositional changes, whilst the lack of mixing in commonly used 5 mm NMR tubes may cause unrepresentative kinetic data to be acquired. A recent study by Foley et al. clearly demonstrates the significance of mass transfer limitations when using static NMR tubes for reaction monitoring, leading to strikingly different kinetic results for the same reaction when monitored by different NMR techniques.2
An alternative to these established techniques is the growing field of on-line NMR monitoring, which is amenable to a wide range of reaction conditions including reactions requiring heating, cooling and inert or reactive gas atmospheres,3–5 and in principle can circumvent the above limitations. Performing the reaction outside of the spectrometer allows reagents to be added without stopping data acquisition and the reaction to be properly mixed to ensure that the reaction kinetics measured are not obscured by diffusional effects. This means that reactions can be performed under realistic conditions and without the delay that is introduced by sampling techniques.
Flow techniques in NMR spectroscopy are well known in the context of high performance liquid chromatography (HPLC)-NMR coupled setups for multi-technique analysis and high-throughput characterisation.6–9 Recently, however, interest in flow techniques for on-line reaction monitoring has grown, both on a laboratory scale4,10–12 and for process monitoring and control in industry.13–16 This has in part been driven by the recent development and commercialisation of a number of systems for on-line NMR reaction monitoring for both high field17,18 and low field19 approaches. Whilst modern low field instruments with good field stability have proven increasingly useful for process monitoring in industrial settings due to their lower cost and portable design,20–22 low field spectrometers lack the resolution and variety of experiments required for studying most catalytic mechanisms and kinetics in a research setting, where the reaction by-products and intermediates may not be well known.19 In addition, due to the high degree of temperature control required for magnetic field stability in low field instruments, the reaction sample must be brought to the magnet temperature before passing through the spectrometer to avoid disrupting the magnetic field homogeneity.19 Multi-nuclear spectra have become possible with modern low field instruments, and deconvolution techniques can be used to alleviate some of the constraints on spectral resolution,20,23 but high field instruments are clearly much more useful for reaction and catalyst development due to higher spectral resolution, increased sensitivity, and the ability to study a wide range of nuclei and perform advanced measurements. A significant advance in high field reaction monitoring has been the recent development of integrated flow tubes that can be inserted into a standard spectrometer probe without having to use specialised flow probes such as those developed for HPLC-NMR6,7 or microfluidic devices,24–29 reducing costs and greatly facilitating use of the technique.17,30
With all these benefits of performing on-line reaction monitoring by continuous-flow high resolution NMR spectroscopy, the presence of flow can have significant effects on the quality and quantification of the NMR signal, and it is important that these effects are considered if accurate data are to be generated. Although some basic principles of how NMR data acquisition is affected by moving samples have been known for some time,6,7 and the use of low field NMR spectroscopy in process monitoring has been well covered in the recent literature,10,20,21,31 we felt it necessary to re-investigate the considerations required for real-time reaction monitoring using high field FlowNMR with contemporary instruments and software. Here we report a summary of the most important effects and parameters that need to be considered when using multi-nuclear high resolution FlowNMR for accurate reaction monitoring with the aim of analysing kinetics and elucidating reaction mechanisms in the research laboratory.
Results and discussion
a) Hardware configuration and design
On-line NMR reaction monitoring may be performed either with continuous flow, where data is acquired whilst the sample is moving through the receiver coil, or with a pulsed flow, where the flow is halted during measurement. Most on-line-NMR reaction monitoring systems use continuous flow3,10,11,21,30 as this means that the sample within the spectrometer is continually refreshed to ensure that the volume measured is always representative of the mixture within the reaction vessel; however, pulsed systems have been developed for use with some low field spectrometers where continuous flow is not possible.32 For all on-line NMR reaction monitoring setups there is an inherent time required for the sample to be pumped from the reaction vessel to the spectrometer, leading to a slight delay between a change occurring in the reaction vessel and detection. This delay means that standard on-line NMR is not suitable for monitoring reactions with half-lives of less than a few minutes that are triggered by an external stimulus (such as the addition of a reagent). Fast-injection methods, including stopped-flow NMR techniques, have been developed to overcome this, although these typically use a static sample that is discarded after measurement.33–40 Capturing fast events that are naturally occurring in a flowing sample during the reaction, however, is not limited by the pump delay but the NMR acquisition parameters.We have used a closed-loop continuously recirculating flow system‡ based on a simple setup using off-the-shelf commercial components (Fig. 1). The reaction vessel may be anything from an open beaker to a Schlenk flask or a pressure reactor. As long as adequate mixing in the reaction vessel is provided, ensuring that the sample circulated through the spectrometer is representative of the bulk, there is no upper limit on the reaction volume. A standard HPLC pump with 1/16′′ HPLC tubing was used to circulate the sample through the system, with a bypass loop fitted for safety reasons. A NMR flow tube with a flexible, thermally jacketed transfer line and 5 mm glass sample tip inserted into a standard 500 MHz spectrometer was used as the flow module. Details on all components used can be found in the Experimental section.
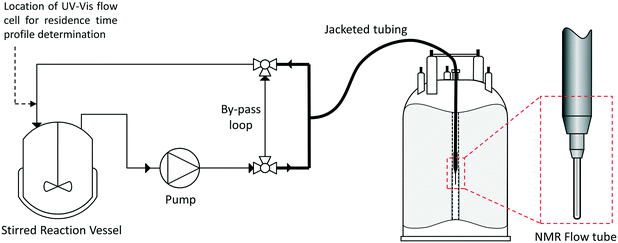 | ||
| Fig. 1 Flow scheme and instrumentation diagram for the FlowNMR reaction monitoring apparatus (not to scale; for details see the Experimental section). | ||
As expected for such small dimensions, under typical conditions (4 mL min−1 flow rate, water-like densities and viscosities) the hydrodynamics of the system are characterised by a low Reynolds number of Re = 113 operating in the laminar flow regime. Laminar flow leads to back-mixing within the flowing sample due to shearing, causing a symmetrical broadening of the residence time distribution.42 In order to quantify the degree of back-mixing and check for additional dead volumes within the system, residence time distribution profiles were recorded by step tracer experiments quantified by an on-line UV-vis flow cell positioned at the exit (cf.Fig. 1). Fig. 2a shows the difference between the residence time distribution (RTD) of the apparatus with the flow tube bypassed, and with the flow tube included. At 4 mL min−1 (acetone, 25 °C) the pump and tubing alone have a reasonably sharp RTD with a mean residence time of τ = 18.7 s and only minor tailing, signifying negligible hold-up by non-uniform flow paths.§ Adding the flow tube to the system shifts the total mean residence time to τ = 53.7 s, showing the total internal volume to be 3.6 mL. As expected, the RTD profile broadening is increased after the longer travel, but also a slightly more pronounced tailing is seen with the flow tube included. Visual analysis of the flow tube during injection and displacement of a tracer dye illustrates the non-ideal plug flow in the tip end of the flow tube, where the narrow transport tubing expands into the 5 mm analysis tube and back out again (see sample hold-up in Fig. 2b and c, and the video in the ESI†).
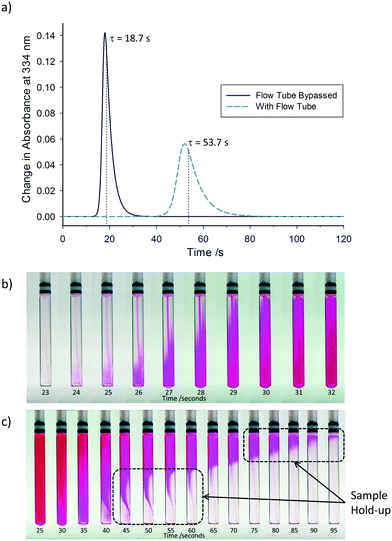 | ||
| Fig. 2 a) Residence time distribution profiles for the apparatus described in Fig. 1 at a flow rate of 4 mL min−1 (acetone, 25 °C), comparing the effects on residence time distribution with and without the flow tube. Still images captured at different time points during the b) addition and c) removal of a tracer dye solution into the flow tube at a flow rate of 4 mL min−1 (video available in ESI†). Note: Time values in a) correspond to a complete circuit of the apparatus returning to the reaction vessel, whilst time values in b) and c) are the time taken to travel between the reaction vessel and flow tube only. | ||
b) Intrinsic flow effects on NMR quantification
The hydrodynamics of a NMR flow system are not only important for quantifying internal volumes, residence times and sample back-mixing, but they also directly impact on NMR signal acquisition as they determine the time a given volume element experiences the magnetic field (pre-magnetisation) and spends in the detector coil. In our setup, the volume of the tubing between the sample entering the magnet and arriving at the flow tube is approximately 0.2 mL, leading to a residence time within the magnet, before entering the detector coil region, of approximately 3 seconds (at a flow rate of 4 mL min−1). The volume of the flow tube itself is approximately 0.5 mL, corresponding to a residence time of around 8 seconds in the detector. As the residence time within the magnet prior to detection is significantly less than the 5 times the T1 relaxation time delay required for complete magnetisation for many nuclei, this may impact on signal intensity and quantification in a way that is not an issue for conventional NMR spectroscopy on static samples. This effect and its impact on NMR data have been studied in some detail in the context of HPLC-NMR,6,7 however, there has been some recent discussion of flow effects in the context of on-line reaction monitoring.3,10,16,43To illustrate how flow may affect the signal intensity of peaks in the NMR spectrum, the apparatus may be divided into three sections (Fig. 3): section A is outside the influence of the magnetic field (B = 0); section B is defined as within the magnet but before the detector (0 < B < B0), whilst section C encompasses the sample volume within the detector (at B0). For simplicity and to aid explanation, the schematic in Fig. 3 assumes three distinct regions, whereas in reality there would be a gradual increase in magnetic field strength as the sample approaches sections B and C. Before entering the magnet (A), all nuclei have random spin orientations, leading to an overall magnetisation vector of zero. Upon entering the magnetic field (B), the nuclear spins start to align along the Z axis, leading to an increase in the magnitude of the overall magnetisation vector, M. For a given flow rate, the extent of this process is dependent on the individual T1 relaxation times of each of the respective nuclei, with nuclei with short T1 values (Fig. 3, solid red line) building up magnetisation faster than those with longer T1 relaxation times (Fig. 3, dashed and dotted red lines).
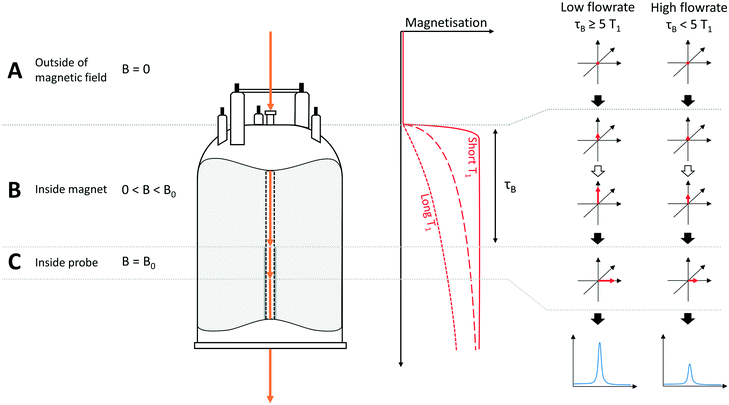 | ||
| Fig. 3 Schematic illustration of magnetisation build-up effects in flow, resulting in non-quantitative results for nuclei with long T1 relaxation times or for high flow rates, where τB < 5 × T1. B = magnetic field strength, τB = residence time of sample in magnet prior to entering detector. Note: For the purpose of clarity, the sample is shown as exiting through the base of the instrument in this diagram, whereas in reality the sample returns by a path parallel to that it entered the instrument by (see Fig. 1). Stray field effects are ignored in this example. | ||
Thus if the flow rate is “fast” or the nuclei have “long” T1 values (or both), the residence time (τB) within the magnet (section B) will be insufficient to allow full build-up of magnetisation before the sample reaches the detector region (C). In this case the free induction decay (FID) detected in the receiver coils will be less than it would be if the nuclei were fully magnetised, leading to an underestimation of signal intensity. Most importantly however, since the T1 relaxation time will be different for each nucleus within a molecule or reaction mixture, the amount of magnetisation of the nuclei as they enter the detector will be different (see example in Fig. 4). This causes the signal intensity to vary for each nucleus, affecting the ability to quantify reaction progress based on different peak areas in flow, an issue which doesn't arise with static samples in which all nuclei will have had sufficient time for full magnetisation build-up before acquisition.
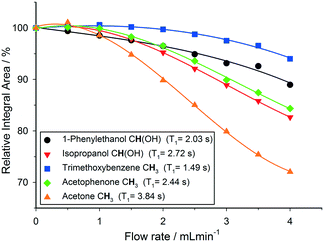 | ||
| Fig. 4 Variation of relative 1H NMR integral areas for a mixture of organic molecules over flow rate (isopropanol, 25 °C, 30° pulse, 4 s acquisition time, 1 s relaxation delay). | ||
As can be seen in Fig. 4, relative 1H peak area discrepancies induced by flow can be as high as 25% at flow rates of 4 mL min−1. If unaccounted for, such differences would directly translate to erroneous kinetic data being acquired with a technique that is otherwise valued for being inherently quantitative. Of course, this effect is not restricted to 1H but equally applies to other common hetero-nuclei often used for reaction monitoring such as 19F, 11B, 31P and 13C. At a given flip angle, the decrease in peak integral area at a given flow rate only depends on the intrinsic T1 relaxation time of the nucleus. 1H and 19F have relatively short relaxation times and thus are affected to a lesser degree by flow effects, which are much more pronounced for 31P and 13C which have longer T1 times causing up to 70% signal loss at 4 mL min−1. Such severe signal reductions may not only falsify quantification by relative integration but even lead to missing transient reaction intermediates. Fig. 5 shows an overview plot of relative integral area reduction induced by flow for various nuclei (for details see the Experimental section and ESI†).
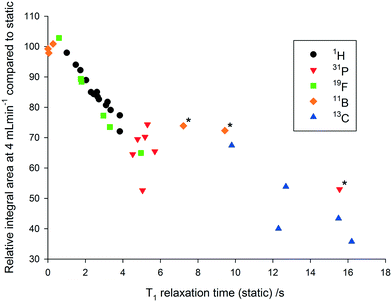 | ||
| Fig. 5 Correlation between the decrease in integral area at a flow rate of 4 mL min−1 and the T1 relaxation time at a flow rate of 0 mL min−1 for a variety of commonly used NMR nuclei (25 °C, 30° pulse, inverse gated decoupling for 31P and 13C, various delay and acquisition times – see Experimental section for details). *Highly symmetrical compounds such as BH4−, BF4− and PPh3 result in unusually long relaxation times.44,45 | ||
Fortunately, this so-called in-flow effect on peak area is relatively easy to correct for. Previously reported methods for preventing quantification errors have included the addition of a pre-magnetisation loop within the magnetic field to increase τB for complete magnetisation of the sample,10 or simply restriction to lower flow rates to ensure operation within the regime where in-flow effects are negligible.21 Both of these methods suffer from an increased delay between a change occurring in the reaction vessel and the change being detected in the spectrometer, which may be undesirable for fast reacting systems. An alternative which does not require any modification of equipment or additional delays in data acquisition is simply to record two spectra of the same sample mixture; one with the sample flowing at the desired flow rate and one with a stationary (fully pre-magnetised, quantitative conditions) sample. These additional spectra may easily be acquired at the start and end of the reaction, or by temporarily halting the flow when there are intermediate species of interest. A correction factor may then be calculated for each peak using the simple mathematical formula expressed below (I = peak integral, CF = correction factor).
| ICorrected = CF × I | (1) |
 | (2) |
In addition to in-flow effects due to incomplete pre-magnetisation, flowing the sample through the detector also has the effect of continuously replenishing the polarised nuclei within the detection region C with fresh material for each scan. This so-called out-flow effect (cf.Fig. 3) leads to a faster decay of the FID under flow conditions, and faster restoration of Z-magnetisation, because nuclei with detectable magnetisation in the XY plane at the start of the acquisition period are leaving the detector before they have fully relaxed, being replaced by either fresh Z-magnetisation from nuclei in region B (if flow is relatively slow and/or T1 relatively fast) or at least partial Z-magnetisation (if flow is relatively fast and/or T1 is relatively slow).
This out-flow effect on the effective T1 relaxation time for different 1H environments can be directly observed by standard T1 measurements, with effective T1 reductions of up to 66% at 4 mL min−1 as compared to static samples (Fig. 7). Whilst the absolute (intrinsic) T1 relaxation times remain unaffected by the motion of the sample, the effective T1 value that is observed under flow conditions  decreases as flow rate is increased in a manner that is proportional to the static T1 value. This decrease in measured T1 relaxation time has been documented previously as a feature of HPLC-NMR,6 and is governed by the following equation, where τB is the residence time within the magnetic field, prior to entering the detector (cf.Fig. 3):
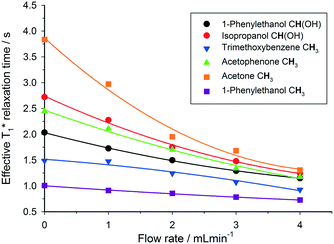 | ||
Fig. 7 Measured 1H  relaxation times for a mixture of organic molecules over flow rate (isopropanol, 25 °C, 2 s acquisition time, 20 s relaxation delay). relaxation times for a mixture of organic molecules over flow rate (isopropanol, 25 °C, 2 s acquisition time, 20 s relaxation delay). | ||
The faster decay in the FID brought about by the out-flow effect necessarily leads to a concomitant decrease in the measured T2 relaxation time (Fig. 8) which is governed by an analogous equation to that for T1 relaxation:6
 , is actually minimal (Fig. 9).
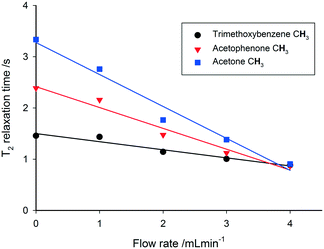 | ||
| Fig. 8 Decrease in 1H T2 relaxation times with increasing flow rate (isopropanol, 25 °C, CPMG pulse sequence, 4 s acquisition time, 15 s relaxation delay). | ||
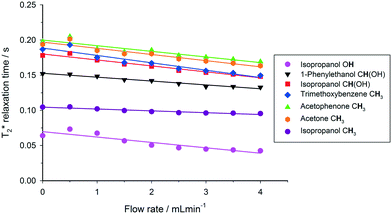 | ||
Fig. 9 Decrease in 1H  relaxation times with increasing flow rate (isopropanol, 25 °C, 30° pulse, 4 s acquisition time, 15 s relaxation delay). relaxation times with increasing flow rate (isopropanol, 25 °C, 30° pulse, 4 s acquisition time, 15 s relaxation delay). | ||
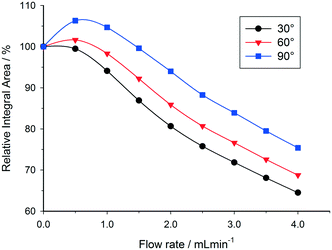
Under certain conditions it is also possible to observe an initial enhancement in signal intensity when flowing a sample through the detector, compared to a static sample. This effect may occur when the relaxation delay time between pulses is set too short, and a return to the Boltzmann distribution between scans is not achieved in the absence of flow. Under slow flow conditions, the rate of return to Boltzmann distribution is then artificially increased by the influx of freshly polarised nuclei (from region B of Fig. 3). This effect is more pronounced for large flip angle pulses, since the return to equilibrium takes longer (Fig. 10). At progressively higher flow rates, in-flow effects of incompletely magnetised fresh sample mean that the signal intensity drops off (Fig. 4); but under conditions where insufficient relaxation times have been left between scans, the relative integral area remains higher when using a 90 degree pulse rather than a 30 degree pulse since the in-flow of even partially Z-magnetised nuclei contributes to a faster return to the Boltzmann distribution and an increase in relative integral area (Fig. 10).
Since this effect is only significant if the relaxation times between pulses are set too short (which would also result in non-quantitative results under static conditions), it is unlikely to be an issue for quantitative FlowNMR studies using appropriate relaxation time delays. However, use of the methods described above (eqn (1) and (2)) would be able to compensate for any such errors should they arise. If the interpulse delay is set long enough to allow full T1 relaxation in the absence of flow, no signal enhancements caused by out-flow effects are observed at any flip angle when starting to flow (see Fig. S6†).
The extent of all flow effects on NMR signal quantification discussed here are dependent on the exact specifications of the probe and spectrometer used. For instance, the design of the magnet and its shielding can greatly modify the amount of stray field experienced by the sample as it approaches the detector, leading to large differences in the results obtained between different instruments even at the same nominal field strength (Fig. S7†). We therefore recommend our results to be taken as a qualitative guideline, and any compensation calculations and parameter fine-tuning should be based on data acquired with the instrument used for reaction monitoring in flow.
c) Practical aspects of data acquisition and processing
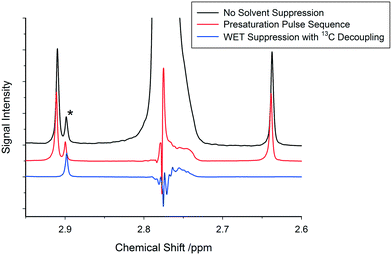
Due to the high cost of deuterated solvents and the amount of solvent required for a typical flow experiment (about one order of magnitude higher than tube experiments), it is generally not practical to carry out FlowNMR reactions in deuterated solvents.48,49 In addition, from a mechanistic perspective deuterated solvents may also cause problems when interacting with reaction intermediates or actively participating in the reaction (H/D exchange), falsifying measured kinetics through isotope effects.43 It is therefore desirable to carry out FlowNMR reactions in non-deuterated solvents; however, this leads to decreased spectral intensity due to the need to adjust the receiver gain of the spectrometer to ensure that the dominant solvent peaks do not overwhelm the detector, otherwise causing severe distortions to the spectrum.In order to improve the relative signal intensity of peaks of interest when using non-deuterated solvents it is common to use solvent suppression pulse sequences that reduce solvent peak intensity, allowing the receiver gain to be increased to reach satisfactory signal-to-noise values of the smaller peaks of interest.48,50 Standard presaturation sequences typically used for solvent suppression are unfortunately of limited use in FlowNMR, since some of the solvent molecules that have been presaturated during the relaxation delay will have been replaced by fresh unsaturated solvent molecules with full signal intensity when the actual FID is recorded.50 WET pulse sequences are much more effective in suppressing solvent signals in flow than presaturation due to the significantly shorter pulse sequences employed in WET which are less affected by sample motion.51,52 With advanced WET techniques it is also possible to simultaneously suppress multiple resonances (Fig. S8†) including their carbon satellites very effectively (Fig. 11; for details see the ESI†).
In addition to eliminating solvent peaks, deuterated solvents are traditionally also used to perform field locking and shimming of the spectrometer. While with most high field spectrometers it is still not possible to perform field locking without an internal 2H standard, modern instruments are capable of maintaining a high level of field stability over extended periods of time. For instance, signal drifts for the 500 MHz Bruker Ultrashield spectrometer used in this study are in the order of 0.1 Hz h−1 (0.0002 ppm h−1), which is quite acceptable for most reaction monitoring time scales. Where field drift is significant, the spectrometer can usually be set to compensate continuously for the measured drift. Shimming of the magnetic field can easily be performed on solvent proton signals using automated shimming programs, however, if a high degree of field homogeneity is required then manual fine tuning of the shims may be required. Using the setup described in Fig. 3, due to the capillary within the flow tube there is a substantial increase in magnetic inhomogeneity in the XY plane, meaning that particular attention must be paid to ensuring good shimming in these planes. Slight differences in tube positioning will require a shim check before each run, though this can easily be performed starting from previously saved parameters. As internal and external differences in magnetic susceptibility can affect the local magnetic field, the shim quality may drift over the course of a reaction monitoring experiment. Although we haven't found this to be an issue over periods as long as 24 hours using a shielded 500 MHz instrument (variation in HHLW < 0.05 Hz h−1), it is possible to include periodic shimming routines in the reaction monitoring sequence should significant drifting occur during a long term experiment.
Once good data has been recorded it is vital to ensure that all spectra are well phased and have a flat baseline to avoid errors when integrating various peaks across multiple spectra for deriving quantitative reaction profiles. The amount of data generated (easily hundreds to thousands of spectra) generally means that one has to rely on automated processing, which can be performed with a variety of contemporary NMR software packages. Whilst most of these offer multi-spectra commands for automatic phasing and baseline correction, manual adjustment of the parameters used is recommended to achieve high accuracy and precision. For instance, we often find substantial improvements in data quality when phasing and baseline corrections are performed within manually defined ranges of interest rather than the full spectral window as the standard setting, as spectra often include bent edges of varying size and phasing that can cause severe data scattering through baseline jumps or tilts when using automated correction commands (Fig. 12).
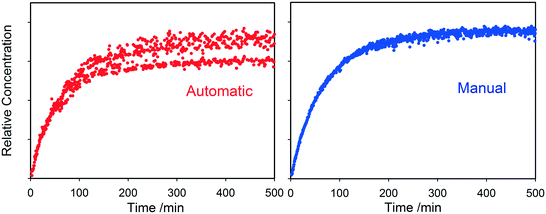 | ||
| Fig. 12 Comparison between the same 1H reaction progress data processed using automatic phase and baseline corrections (left) and with manual refinement of parameters to reduce baseline distortions and data scatter (right). Note that a particularly noisy data set was chosen for illustration purposes, and higher quality reaction profiles are typically obtained from FlowNMR experiments (see e.g.Fig. 6 and 13). | ||
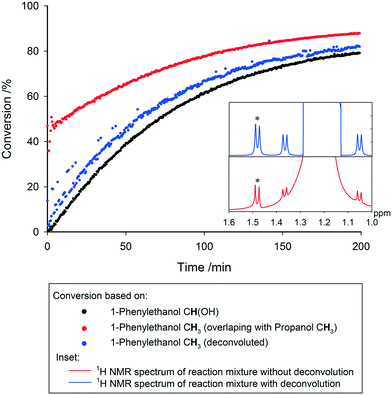
Even with the above precautions, drifting peaks and overlapping signals may pose additional challenges to extracting the desired information from the data generated. Recent software solutions offer the ability to track moving peaks across multiple spectra for accurate integration, and perform automatic deconvolution of overlapping signals. Spectral deconvolution is used extensively in quantitative process monitoring by UV-vis and IR spectroscopies, and has recently been discussed at great length as an important tool for low field NMR reaction monitoring where spectral resolution is similarly low.20 Although not always required, these advances can also be applied to high field measurements with equal success, where not having to rely on well-separated diagnostic peaks for each molecule of interest within a dynamic mixture adds to the utility of reaction monitoring by NMR. Below in Fig. 13 we show an example where overlapping resonances have been deconvoluted to yield the same reaction profile as derived from fully separated signals in other parts of the spectra.
Conclusions
High field on-line NMR is a particularly versatile and useful tool for real time reaction monitoring as it offers direct insight into complex mixtures without the need of external calibration and is applicable to a wide range of reaction conditions. FlowNMR systems are easy to set up, using commercially available apparatus and software, and are a time and cost efficient means of analysing reaction kinetics and studying mechanisms. Reactions may be studied under realistic conditions with efficient mixing, whilst allowing reagents to be added during the course of the reaction. Suitable solvent suppression techniques can remove the need for deuterated solvents, reducing cost and avoiding unwanted isotope effects.The inherently quantitative nature of NMR is of great benefit for reaction monitoring, however, precautions must be taken when accurate results are required from reactions where T1 relaxation times are similar or greater than the residence time of the sample within the magnet at the chosen flow rate. Residence time effects may lead to a decrease in the amount of signal detected, which has the potential to cause inaccuracies when comparing concentrations of species with different relaxation times. However, these in-flow effects can easily be corrected by simple mathematical calculation.
Out-flow effects, reducing the delay time required between scans, may be used to increase the amount of data that can be acquired within a given time period. This allows increasing either the temporal resolution of the experiment (more spectra per time) or the quality of the data (more scans per spectrum) as required.
A number of software packages are available to assist with the acquisition and processing of FlowNMR data, and include methods for suppressing solvent peaks and tracking peak drift over time. Care must be taken when applying automatic multiple spectra commands for phasing and baseline correction, and manual adjustment of the parameters is recommended. We hope that our account will be of use to others in quickly generating high quality data from FlowNMR experiments.
Experimental
Reactions were carried out in a standard glass round-bottomed flask, with a double-piston HPLC pump (JASCO PU-2085 Plus) with a semi-micro pump head used to circulate the mixture around the system to an InsightMR flow tube (Bruker) located within the spectrometer (Bruker 500 MHz Avance II+ Ultrashield equipped with a broadband BBO probe). In order to minimise the delay time between a change occurring in the reaction vessel and the arrival of the sample to the spectrometer for detection it is desirable to ensure that the volume of the tubing connecting the reaction vessel to the spectrometer is minimised, therefore narrow diameter polyetheretherketone (PEEK) tubing (0.762 mm i.d., Upchurch Scientific) was used. The PEEK tubing offers high chemical and mechanical stability (pH 0–14, −50–100 °C, >300 bar) along with good flexibility and low gas permeability. For reactions at atmospheric pressure standard rubber seals were used to connect the tubing with the reaction solution, and found effective for air-sensitive systems over prolonged times (>10 hours) when sealed off with silicone grease. All other connections were made using standard HPLC-type PEEK connectors (Upchurch Scientific), allowing the apparatus to be purged with inert or reactive gases as required. All equipment was positioned on a mobile trolley made of plastic (Rubbermaid), allowing the equipment to be transported between the laboratory and the spectrometer as required. The trolley and apparatus were able to be placed at a minimum distance of 0.5 m from the shielded magnet without experiencing adverse magnetic effects. Data acquisition was performed without lock and with shimming performed using automated 1H shimming routines, followed by manual fine tuning. Data processing was performed using commercially available software. All samples were prepared using reagents purchased from Sigma Aldrich or Alfa Aesar at reagent grade or higher and were used without further purification.Residence time distribution profiles were obtained by concentration step using a tracer dye. Acetone was flowed through the apparatus at a continuous flow rate of 4 mL min−1 before the sample inlet was switched to a solution of fluorescein in acetone (1 g dm−3). The change in absorbance at 334 nm at the outlet tubing was monitored over time using a fibre optic light source (Avantes AvaLight-DH-S-BAL), flow cell and spectrometer (Avantes AvaSoft 2048L) until no further change was observed. The input was then switched back to clean acetone and the process repeated. Data was fitted using a 5 parameter sigmoidal function and the fitted data differentiated to provide the residence time distribution. Photographs and video of the sample hold-up within the flow tube were recorded by concentration step using a Rose Bengal dye (1 g dm−3, acetone) in an analogous way to the residence time distribution profiles.
1H T1 relaxation time measurements were performed on a mixture of acetophenone, 1-phenylethanol, acetone and 1,3,5-trimethoxybenzene in isopropanol using an inversion-recovery pulse sequence with variable delay times of 0.01, 0.25, 0.5, 1, 2, 3, 5, 7.5, 10 and 15 seconds and a relaxation delay time between data acquisition of 15 seconds (4 s acquisition time), averaged over 8 scans with 4 dummy scans to ensure an equilibrium state was attained prior to data acquisition. Data was processed and fitted using the Topspin ‘t1guide’ utility. 1H integral area measurements were performed on the same sample using a standard 30° pulse sequence (1 s delay, 4 s acquisition time, 8 scans) at flow rates between 0–4 mL min−1.
19F T1 relaxation time measurements were performed on a mixture of α,α,α-trifluorotoluene, 2-fluorotoluene, trifluoroethanol, trifluoroacetic acid, tetrabutylammonium hexafluorophosphate, and tetrabutylammonium fluoride in acetone using an inversion-recovery pulse sequence with variable delay times of 0.05, 0.25, 0.5, 1, 1.5, 2, 3, 5, 7.5 and 10 seconds and a relaxation delay time of 10 seconds (4.65 s acquisition time), averaged over 8 scans with 2 dummy scans. Due to limited pulse excitation width, data was acquired separately for regions −50–−90 ppm, −105–−135 ppm and −170–−200 ppm. Data was zero filled to quadruple the size of the FID before data processing using the ‘t1guide’ utility. 19F integral area measurements were performed on the same sample using a standard 30° pulse sequence (10 s delay, 4.65 s acquisition time, 16 scans) at flow rates between 0–4 mL min−1. Integral area data was zero filled and linear back prediction (128 points) used to remove broad spectral distortions due to fluorine in the probe prior to integration.
31P T1 relaxation time measurements were performed on a mixture of dichlorophenylphosphine, chlorodiphenylphosphine, triphenylphosphine oxide, triphenylphosphine sulphide, triphenylphosphine, triphenylphosphate and tetrabutylammonium hexafluorophosphate in acetone using an inversion-recovery pulse sequence modified to include an adiabatic 180° pulse and inverse gated proton decoupling. Variable delay times of 0.05, 0.25, 0.5, 1, 2, 3, 5, 10, 20 and 30 seconds were used with a relaxation delay time of 30 seconds (2 s acquisition time), averaged over 8 scans with 4 dummy scans. Data was zero filled to quadruple the size of the FID before data processing using the ‘t1guide’ utility. 31P integral area measurements were performed on the same sample using a standard 30° pulse sequence with inverse gated 1H decoupling (45 s delay, 2 s acquisition time, 8 scans) at flow rates between 0–4 mL min−1.
11B T1 relaxation time measurements were performed on a mixture of phenylboronic acid, bis(pinacolato)diboron, tri(isopropyl)boron, sodium tetrafluoroborate and sodium borohydride in 1 M aqueous sodium hydroxide solution using an inversion-recovery pulse sequence. Due to the range of 11B T1 values observed for this mixture, the experiment was performed in two sections, the first using variable delay times of 0.0005, 0.001, 0.0015, 0.002, 0.003, 0.004, 0.005, 0.0075, 0.01, 0.02, 0.03, 0.05, 0.075, 0.1, 0.15, 0.2, 0.3, 0.5, 0.75 and 1 seconds with a relaxation delay time of 1.5 seconds (0.8 s acquisition time), averaged over 8 scans with 4 dummy scans, and the second using variable delay times of 0.1, 0.5, 1, 2, 3, 4, 5, 7.5, 10 and 25 seconds with a relaxation delay time of 30 seconds (0.8 s acquisition time), averaged over 8 scans with 4 dummy scans. Data was zero filled to quadruple the size of the FID before data processing using the ‘t1guide’ utility. 11B integral area measurements were performed on the same sample using a standard 30° pulse sequence (30 s delay, 1 s acquisition time, 4 scans) at flow rates between 0–4 mL min−1. Integral area data was zero filled and linear back prediction (128 points) used to remove broad spectral distortions due to the borosilicate glassware prior to integration.
13C T1 relaxation time measurements were performed on a mixture of equal volumes of toluene, ethanol, cyclohexane and acetone using an inversion-recovery pulse sequence modified to include an adiabatic 180° pulse and inverse gated proton decoupling. Variable delay times of 0.05, 0.1, 0.5, 1, 3, 5, 7.5, 10, 15, 20, 30, 40, 60 and 90 seconds were used with a relaxation delay time of 90 seconds (0.82 s acquisition time), averaged over 16 scans with 4 dummy scans for the spectral region 0–80 ppm. Data was zero filled to quadruple the size of the FID before data processing using the ‘t1guide’ utility. 13C integral area measurements were performed on the same sample using a standard 30° pulse sequence with inverse gated 1H decoupling (80 s delay, 3.72 s acquisition time, 8 scans) at flow rates between 0–4 mL min−1.
1H T2 relaxation time measurements were performed on a mixture of acetophenone, 1-phenylethanol, acetone and 1,3,5-trimethoxybenzene in isopropanol using a CPMG pulse program with a 20 ms delay between successive 180 degree pulses, and variable loop counts of 2, 10, 20, 40, 60, 100, 150, 200, 300 and 500, giving echo times of between 40 and 10![[thin space (1/6-em)]](https://www.rsc.org/images/entities/char_2009.gif) 000 ms. A 15 s delay time between data acquisition was used, and the signal averaged over 8 scans with 16 dummy scans. Data was processed and fitted using the Topspin ‘t1guide’ utility.
000 ms. A 15 s delay time between data acquisition was used, and the signal averaged over 8 scans with 16 dummy scans. Data was processed and fitted using the Topspin ‘t1guide’ utility.
 values were calculated from 1H peak linewidths from the same sample as the 1H integral area measurements (15 s delay, 4 s acquisition time, 30° pulse, 8 scans). Peaks were deconvoluted from the spectra and peak widths at half height (HHLW) taken from the fitted Lorentzian peaks.
  were calculated using the following equation:
Solvent suppression was performed on a sample of 1% benzaldehyde in acetonitrile at a flow rate of 4 mL min−1. Spectra were acquired using a standard 30° pulse program (4 s delay, 3.17 s acquisition, 8 scans, receiver gain = 6.35, transmitter frequency offset = 2.78 ppm), a presaturation pulse sequence (4 s delay, 3.17 s acquisition, 8 scans, receiver gain = 114, transmitter frequency offset = 2.78 ppm) and a WET pulse sequence with a shaped pulse and low power 13C decoupling during acquisition (4 s delay, 3.17 s acquisition, 8 scans, receiver gain = 203, transmitter frequency offset = 2.78 ppm).
Reaction of triphenylphosphine with sulfur
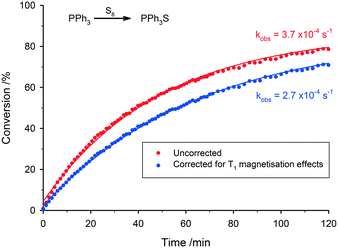
Following the general procedure for FlowNMR experiments given in the ESI,† the FlowNMR apparatus was purged with toluene and then filled with a solution of triphenylphosphine (0.624 g, 2.4 mmol) in toluene (13.6 mL). 31P data was acquired for the static sample (inverse gated 1H decoupled, 2 s delay, 0.803 s acquisition time, 30° pulse, 16 scans). Flow of sample around the apparatus was started (4 mL min−1) and a second spectrum acquired. Both spectra were integrated and the absolute integral values compared to calculate a flow correction factor for triphenylphosphine. An additional spectrum acquired under quantitative conditions (inverse gated 1H decoupled, 60 s delay, 0.803 s acquisition time, 30° pulse) was used to calculate a second correction factor which was applied to both datasets to compensate for the non-quantitative conditions required during reaction monitoring.¶ A solution of S8 (87 mg, 0.34 mmol) in toluene (10 mL) was added to the stirred reaction flask and data acquisition started (1 spectrum per minute for the first hour of data acquisition, 1 spectrum every 2 minutes for the second and third hour of acquisition). After three hours, data acquisition was halted. Spectra were recorded at flow rates of 0 and 4 mL min−1 and a correction factor calculated for the triphenylphosphine sulphide product. All spectra were integrated and the integrals scaled by the correction factor for each peak respectively to give the corrected integral for conversion calculation.Transfer hydrogenation of acetophenone
The FlowNMR apparatus was purged with dry nitrogen for 30 min to remove any traces of air or moisture. The apparatus was filled with 10 mL of a stock solution of potassium hydroxide (anhydrous, 0.112 g, 2 mmol) and 1,3,5-trimethoxybenzene (3.364 g, 0.02 mol) in dry, degassed isopropanol (200 mL) and acetophenone (0.47 mL, 4 mmol) was added. Data acquisition was started (4 s delay, 1 s acquisition time, 30° pulse, 4 scans) and a solution of the catalyst (S,S)-(TsDPEN)mesitylruthenium chloride (12 mg, 0.02 mmol) in isopropanol (1 mL) was added to start the reaction.Concentrations of species were determined by peak integrals and referenced to 1,3,5-trimethoxybenzene as internal standard. For deconvolution of the 1-phenylethanol peaks (overlapping with isopropanol) spectra were first aligned before automatic deconvolution of spectra was performed. Deconvoluted spectra were integrated in the usual manner to obtain peak areas for concentration determination.
Author information
A. C. and P. G. are employees of Bruker UK Ltd., manufacturer and supplier of NMR hard- and software solutions that have been used in this research. The other authors declare no competing financial interest.Acknowledgements
This work was supported by a Research Grant from the Royal Society (Y0603), the EPSRC Centre for Doctoral Training in Sustainable Chemical Technologies (EP/L016354/1), and Bruker UK Ltd. UH thanks the Centre for Sustainable Chemical Technologies for a Whorrod Research Fellowship. The authors would like to thank Dr Tim Woodman and Dr Antoine Buchard from the University of Bath for their support and assistance with this project and for many useful discussions.References
- A. Mix, P. Jutzi, B. Rummel and K. Hagedorn, Organometallics, 2010, 29, 442 CrossRef CAS.
- D. A. Foley, A. L. Dunn and M. T. Zell, Magn. Reson. Chem., 2016, 54, 451–456 CrossRef CAS PubMed.
- J. Y. Buser and A. D. McFarland, Chem. Commun., 2014, 50, 4234–4237 RSC.
- M. Goldbach, E. Danieli, J. Perlo, B. Kaptein, V. M. Litvinov, B. Blümich, F. Casanova and A. L. L. Duchateau, Tetrahedron Lett., 2016, 57, 122–125 CrossRef CAS.
- M. A. Vargas, M. Cudaj, K. Hailu, K. Sachsenheimer and G. Guthausen, Macromolecules, 2010, 43, 5561–5568 CrossRef CAS.
- K. Albert and E. Bayer, TrAC, Trends Anal. Chem., 1988, 7, 288–293 CrossRef CAS.
- K. Albert, M. Kunst, E. Bayer, M. Spraul and W. Bermel, J. Chromatogr., 1989, 463, 355–363 CrossRef CAS.
- V. Räntzsch, M. Wilhelm and G. Guthausen, Magn. Reson. Chem., 2016, 54, 494–501 CrossRef PubMed.
- M. V. Silva Elipe, LC-NMR and Other Hyphenated NMR Techniques, John Wiley & Sons, Inc., 2011 Search PubMed.
- M. Maiwald, H. H. Fischer, Y.-K. Kim, K. Albert and H. Hasse, J. Magn. Reson., 2004, 166, 135–146 CrossRef CAS PubMed.
- D. A. Foley, J. Wang, B. Maranzano, M. T. Zell, B. L. Marquez, Y. Xiang and G. L. Reid, Anal. Chem., 2013, 85, 8928–8932 CrossRef CAS PubMed.
- D. A. Foley, C. W. Doecke, J. Y. Buser, J. M. Merritt, L. Murphy, M. Kissane, S. G. Collins, A. R. Maguire and A. Kaerner, J. Org. Chem., 2011, 76, 9630 CrossRef CAS PubMed.
- J. M. Merritt, J. Y. Buser, A. N. Campbell, J. W. Fennell, N. J. Kallman, T. M. Koenig, H. Moursy, M. A. Pietz, N. Scully and U. K. Singh, Org. Process Res. Dev., 2014, 18, 246–256 CrossRef CAS.
- D. A. Foley, M. T. Zell, B. L. Marquez and A. Kaerner, Pharm. Technol., 2011, 11, S19 Search PubMed.
- M. A. Bernstein, M. Stefinovic and C. J. Sleigh, Magn. Reson. Chem., 2007, 45, 564 CrossRef CAS PubMed.
- A. Nordon, C. A. McGill and D. Littlejohn, Analyst, 2001, 126, 260–272 RSC.
- D. A. Foley, E. Bez, A. Codina, K. L. Colson, M. Fey, R. Krull, D. Piroli, M. T. Zell and B. L. Marquez, Anal. Chem., 2014, 86, 12008–12013 CrossRef CAS PubMed.
- Bruker, InsightMR: Real-Time Data Analysis and Acquisition Control - the Solution for Process Monitoring, www.bruker.com/products/mr/nmr/nmr-software/software/insightmr/overview.html, (accessed 02/01/2016, 2016) Search PubMed.
- M. V. Silva Elipe and R. R. Milburn, Magn. Reson. Chem., 2016, 54, 437–443 CrossRef CAS PubMed.
- N. Zientek, K. Meyer, S. Kern and M. Maiwald, Chem. Ing. Tech., 2016, 88, 698–709 CrossRef CAS.
- F. Dalitz, M. Cudaj, M. Maiwald and G. Guthausen, Prog. Nucl. Magn. Reson. Spectrosc., 2012, 60, 52–70 CrossRef CAS PubMed.
- K. Meyer, S. Kern, N. Zientek, G. Guthausen and M. Maiwald, Trends Anal. Chem., 2016, 83, 39–52 CrossRef CAS.
- V. Sans, L. Porwol, V. Dragone and L. Cronin, Chem. Sci., 2015, 6, 1258–1264 RSC.
- C. J. Jones and C. K. Larive, Anal. Bioanal. Chem., 2012, 402, 61–68 CrossRef CAS PubMed.
- O. Gökay and K. Albert, Anal. Bioanal. Chem., 2012, 402, 647–669 CrossRef PubMed.
- J. Bart, A. J. Kolkman, A. J. Oosthoek-de Vries, K. Koch, P. J. Nieuwland, H. Janssen, J. van Bentum, K. A. M. Ampt, F. P. J. T. Rutjes, S. S. Wijmenga, H. Gardeniers and A. P. M. Kentgens, J. Am. Chem. Soc., 2009, 131, 5014–5015 CrossRef CAS PubMed.
- G. Finch, A. Yilmaz and M. Utz, J. Magn. Reson., 2016, 262, 73–80 CrossRef CAS PubMed.
- R. M. Fratila, M. V. Gomez, S. Sýkora and A. H. Velders, Nat. Commun., 2014, 5, 3025 Search PubMed.
- S. S. Zalesskiy, E. Danieli, B. Blümich and V. P. Ananikov, Chem. Rev., 2014, 114, 5641–5694 CrossRef CAS PubMed.
- M. Khajeh, M. A. Bernstein and G. A. Morris, Magn. Reson. Chem., 2010, 48, 516–522 CrossRef CAS PubMed.
- A. Nordon, A. Diez-Lazaro, C. W. L. Wong, C. A. McGill, D. Littlejohn, M. Weerasinghe, D. A. Mamman, M. L. Hitchman and J. Wilkie, Analyst, 2008, 133, 339–347 RSC.
- Thermo Scientific, NMR Reaction Monitoring Accessory, https://tools.thermofisher.com/content/sfs/brochures/PS52672-E-0315M-NMR-Accessory.pdf, (accessed 28/05/2016, 2016) Search PubMed.
- C. A. Fyfe, M. Cocivera and S. W. H. Damji, Acc. Chem. Res., 1978, 11, 277–282 CrossRef CAS.
- P. V. Yushmanov and I. Furo, J. Magn. Reson., 2005, 175, 264 CrossRef CAS PubMed.
- D. B. Green, J. Lane and R. M. Wing, Appl. Spectrosc., 1987, 41, 847–851 CrossRef CAS.
- P. A. Keifer, Magn. Reson. Chem., 2003, 41, 509–516 CrossRef CAS.
- J. F. McGarrity, J. Prodolliet and T. Smyth, Org. Magn. Reson., 1981, 17, 59–65 CrossRef CAS.
- M. D. Christianson, E. H. P. Tan and C. R. Landis, J. Am. Chem. Soc., 2010, 132, 11461–11463 CrossRef CAS PubMed.
- J. F. McGarrity and J. Prodolliet, J. Org. Chem., 1984, 49, 4465–4470 CrossRef CAS.
- S. E. Denmark, B. J. Williams, B. M. Eklov, S. M. Pham and G. L. Beutner, J. Org. Chem., 2010, 75, 5558–5572 CrossRef CAS PubMed.
- F. E. Valera, M. Quaranta, A. Moran, J. Blacker, A. Armstrong, J. T. Cabral and D. G. Blackmond, Angew. Chem., Int. Ed., 2010, 49, 2478–2485 CrossRef CAS PubMed.
- O. Levenspiel, Chemical Reaction Engineering, Wiley, New York, Chichester, 3rd edn., 1999 Search PubMed.
- M. Maiwald, H. H. Fischer, Y.-K. Kim and H. Hasse, Anal. Bioanal. Chem., 2003, 375, 1111–1115 CAS.
- C. A. Wilkie, J. Magn. Reson., 1979, 33, 127–134 CAS.
- S. J. Seymour and J. Jonas, J. Chem. Phys., 1971, 54, 487–491 CrossRef CAS.
- G. E. Wagner, P. Sakhaii, W. Bermel and K. Zangger, Chem. Commun., 2013, 49, 3155–3157 RSC.
- K. J. Donovan, M. Allen, R. W. Martin and A. J. Shaka, J. Magn. Reson., 2012, 219, 41–45 CrossRef CAS PubMed.
- T. R. Hoye, B. M. Eklov, T. D. Ryba, M. Voloshin and L. J. Yao, Org. Lett., 2004, 6, 953–956 CrossRef CAS PubMed.
- M. Maiwald, H. H. Fischer, Y. K. Kim, K. Albert and H. Hasse, J. Magn. Reson., 2004, 166, 135 CrossRef CAS PubMed.
- S. H. Smallcombe, S. L. Patt and P. A. Keifer, J. Magn. Reson., Ser. A, 1995, 117, 295–303 CrossRef CAS.
- J. L. Sudmeier, U. L. Günther, K. Albert and W. W. Bachovchin, J. Magn. Reson., Ser. A, 1996, 118, 145–156 CrossRef CAS.
- K. Albert, in On-Line LC-NMR And Related Techniques, John Wiley & Sons, Ltd, 2003, pp. 1–22, DOI:10.1002/0470854820.ch1.
Footnotes |
| † Electronic supplementary information (ESI) available: Electronic supporting information containing additional photographs, diagrams, calculations, experimental details and a video of the RTD experiment (Fig. 2). See DOI: 10.1039/c6cy01754a |
| ‡ Note that whilst NMR data is acquired on a flowing aliquot, the reaction itself is performed as a batch process in a continuously stirred reaction vessel, yielding reaction profiles as a function of time rather than of reactor length or flow velocity as would be the case for continuous flow mode.41 |
| § All experiments were performed with the internal pressure sensor of the pump disconnected due to additional sample hold-up within the sensor (Fig. S4†). Sample hold-up and tailing analysis are strictly qualitative. |
| ¶ In practice, both effects may be corrected for simultaneously by ensuring that the static spectrum acquired for the calculation of a correction factor for flow effects is acquired under quantitative conditions. |
| This journal is © The Royal Society of Chemistry 2016 |

