 Open Access Article
Creative Commons Attribution 3.0 Unported Licence
Support effect for nanosized Au catalysts in hydrogen production from formic acid decomposition
Monika
Zacharska
ab,
Andrey L.
Chuvilin
 cd,
Vladimir V.
Kriventsov
e,
Sergey
Beloshapkin
b,
Miguel
Estrada
f,
Andrey
Simakov
f and
Dmitri A.
Bulushev
*egh
aChemical & Environmental Sciences Department, University of Limerick, Limerick, Ireland
bMaterials & Surface Science Institute, University of Limerick, Limerick, Ireland
cCIC nanoGUNE Consolider, Donostia - San Sebastián, 20018 Spain
dIKERBASQUE, Basque Foundation for Science, Bilbao, 20013 Spain
eBoreskov Institute of Catalysis, SB RAS, Novosibirsk 630090, Russia. E-mail: dmitri.bulushev@catalysis.ru
fCentro de Nanociencias y Nanotecnología de la UNAM, 22860, Ensenada, BC, México
gNovosibirsk State University, Novosibirsk 630090, Russia
hNikolaev Institute of Inorganic Chemistry, SB RAS, Novosibirsk 630090, Russia
First published on 9th May 2016
Abstract
Catalysts with about 2.5 wt% of gold supported on Al2O3, ZrO2, CeO2, La2O3 and MgO oxides and with the same mean metal particle sizes of 2.4–3.0 nm have been studied in hydrogen production via formic acid decomposition. A strong volcano-type relation of the catalytic activity on the electronegativity of the support's cation was demonstrated with the Au/Al2O3 catalyst on the top. This indicated that the activity is affected by the acid–base properties of the support. A study of the most active Au/Al2O3 catalyst with aberration-corrected HAADF/STEM, XPS and EXAFS proved that gold is in metallic state. The content of single supported gold atoms/cations was negligible. Therefore, the mechanism of the reaction was related to the activation of formic acid on the catalyst's support followed by further decomposition of the formed reaction intermediate on the Au/support interface.
Introduction
Biomass-derived formic acid containing 4.4 wt% of hydrogen is considered as a potential hydrogen source producing hydrogen by decomposition at low temperatures using noble metal catalysts.1 This feature could be utilized further for important application of this acid in some hydrogenation reactions instead of molecular hydrogen2,3 thus avoiding the problems of expensive hydrogen transportation. Heterogeneous catalysts could be used for decomposition of formic acid in liquid or vapour phase. In the present paper, we consider only vapour phase formic acid decomposition and gold catalysts on different supports.Catalysis with nanosized gold has attracted a lot of attention during the last 15 years as gold catalysts with particle sizes smaller than 5 nm may provide a better performance in reactions where Pt-group metals are traditionally used. Thus, for formic acid decomposition, Ojeda and Iglesia4 have demonstrated that the activity of Au/Al2O3 catalysts with a mean size of 2–4 nm could be one order of magnitude higher than that of Pt/Al2O3 catalysts. They assigned the exceptional activity to the presence of sub-nanometre sized Au species invisible by conventional TEM. However, these authors provided no spectroscopic or electron microscopy evidence of the presence of such species. The content of CO in these studies was less than 10 ppm, and hence, the reaction corresponded to CO-free hydrogen production. The explanation of these authors was based on the approach developed by the group of Flytzani-Stephanopoulos,5 who demonstrated a unique activity of isolated Au–Ox(OH)– species attached to reducible CeO2, TiO2 and Fe2O3 supports in water-gas shift (WGS) reaction. This group confirmed the presence of Au species in isolated atomic state in their catalysts by aberration-corrected HAADF/STEM studies. Later, they also investigated formic acid decomposition and showed that Au/CeO2 catalysts containing only single Au atoms at low concentrations (0.03 and 0.5 at%), left on the support after leaching of Au nanoparticles by a NaCN solution, provided a catalytic activity towards H2 and CO2 products at low temperatures (<323 K).6 These results were in accordance with the results of Ciftci et al.,7 who used quite similar catalysts.
Alternatively, Singh et al.8 using microkinetic modelling and density functional theory (DFT) calculations showed that the reaction of formic acid decomposition is structure-sensitive and the reaction rates are determined by a mechanism taking place via formate species decomposition over low coordinated corner sites located on the Au nanoparticles. They used an unreducible catalyst support (SiC), for which stabilization of single Au atoms is not expected, and the mean Au particle sizes of their catalysts were in the range from 2.5 to 11 nm. The content of CO in these studies was negligible (∼25 ppm).
Gazsi et al.9 determined the catalytic activity in formic acid decomposition of 1 wt% Au catalysts on different supports. Comparing the activity of the catalysts with similar mean particle sizes of 5.5–6.5 nm at 473 K, they showed that an Au/SiO2 catalyst demonstrated a 4–6 times higher activity than Au/Al2O3 and Au/C catalysts. We could note that the mean particle sizes used in this work did not correspond to the sizes showing the highest activity of gold; hence, the authors needed to use high temperatures. This led to low selectivity for hydrogen production, since high temperatures favour reverse WGS reaction giving CO and water from CO2 and hydrogen over some of the catalysts. Also, in accordance with the results of our studies for an Au/TiO2 catalyst,10 Gazsi et al.9 showed that the selectivity could be significantly improved with addition of water vapour to the reaction mixture. In contrast, addition of CO did not influence hydrogen production from formic acid6,10 as CO is known not to be adsorbed strongly on any Au species.
Catalytic reactions on Au nanoparticles are very sensitive to the nature of the support;11–14 however, explanations for these effects are contradictory and demand further studies. Hence, the objective of the present work was to reveal the effect of the nature of the oxide support in hydrogen production via formic acid decomposition for gold catalysts. We showed that the catalytic activity of the catalysts with the same mean metal particle sizes (2.4–3.0 nm) is strongly dependent on the acidity of the support. The Au/Al2O3 catalyst possessed the best performance in the reaction followed by Au/ZrO2, Au/CeO2, Au/La2O3 and Au/MgO catalysts.
Experimental
Materials
The catalyst supports and catalysts used in this work have been described earlier by us.13 The following oxides have been used as supports: CeO2, γ-Al2O3, La2O3, ZrO2 (all from Alfa Aesar) and MgO (Mallinckrodt). According to XRD studies, ZrO2 possessed a monoclinic structure, La2O3 a hexagonal one, while CeO2, γ-Al2O3 and MgO demonstrated cubic structures. Au catalysts supported on different metal oxides were synthesized by a deposition–precipitation technique using HAuCl4 (Alfa Aesar) as a metal precursor and urea as a precipitating agent to yield 3 wt% of Au as proposed by Zanella et al.15 The prepared materials were washed with concentrated NH4OH (25 M) to remove chlorides after gold deposition. This treatment was also important to clean the catalysts from other impurities, like alkali metal ions. Then, the samples were washed with distilled water, filtered and dried for 24 h at room temperature. These samples were denoted as initial. The samples denoted as calcined were heated in oxygen from room temperature up to 623 K with a ramp of 20 K min−1 and were immediately cooled back to room temperature. The sample denoted as reduced was heated in H2 up to 573 K and cooled rapidly to room temperature.Catalyst characterization
The content of Au in the obtained gold catalysts was measured by inductively coupled plasma atomic emission spectroscopy (ICPAES) using a Varian Liberty 110 spectrometer.A conventional JEOL JEM-2010 microscope was used for TEM imaging of the calcined Au catalysts supported on different metal oxides before the reaction. Additionally, the calcined Au/Al2O3 catalyst was studied after the formic acid decomposition using a Titan 60–300 TEM/STEM microscope (FEI, Netherlands) in HAADF/STEM mode. The samples for this analysis were prepared by ultrasound dispersion in isopropanol and a drop of the solution was put on a carbon grid.
The electronic state of gold species was studied by X-ray photoelectron spectroscopy (XPS) with a Kratos AXIS 165 photoelectron spectrometer using monochromatic AlKα radiation (hν = 1486.58 eV). All measured binding energies were referred to the C 1s line of carbon at 284.8 eV.
The Au-L3 edge EXAFS spectra of the Au/Al2O3 catalyst were measured at the Siberian Synchrotron and Terahertz Radiation Centre (SSTRC, Novosibirsk, Russia). The storage ring VEPP-3 with an electron beam energy of 2 GeV and an average stored current of 90 mA was used as a source of radiation. The X-ray energy was monitored with a channel cut Si(111) monochromator. Harmonic rejection was performed by using a SiO2 mirror for all measurements.
All EXAFS spectra were recorded under transmission and fluorescent mode with steps of 1.5 eV. Energy calibration was done using a gold foil spectrum. The spectra were treated using standard procedures.16,17 The background was removed by extrapolating the pre-edge region onto the EXAFS region in the form of polynomials. Three cubic splines were used to construct the smooth part of the absorption coefficient. The inflection point of the edge of the X-ray absorption spectrum was used as the initial point (k = 0) of the EXAFS spectrum. The radial distribution function of atoms (RDF) was calculated from the spectra in k3χ(k) by using Fourier transform modulus in the wavenumber interval of 3.0–12.0 Å−1.
A curve fitting procedure with Viper17 and EXCURV9218 codes was applied to determine the distances and coordination numbers. It was performed for k3χ(k) in similar wavenumber intervals after preliminary Fourier filtering by using the known XRD literature data for the bulk compounds. The Debye–Waller factors were fixed: 2σ2 = 0.009–0.013 Å2.
Catalytic activity measurements
Vapour phase formic acid decomposition was carried out in a fixed bed quartz reactor with 4 mm internal diameter under normal atmospheric pressure as was described earlier.19 The loading of a catalyst was 23.5 mg and it was placed between two layers of quartz wool. The catalytic activities were measured after the reduction of the catalysts in a 1 vol% H2/Ar mixture for 1 h at 573 K followed by cooling in He to the reaction temperature.Formic acid (Sigma-Aldrich) was introduced into an evaporator by a syringe-pump (Sage) to get 1.9 vol% in helium flow. The total flow rate of the gas mixture was 51 mL min−1 for all experiments. A gas chromatograph (HP-5890) equipped with a thermal conductivity detector and a Porapak-Q column was used for gas analysis. To evaluate the temperature dependence of the acid conversion, the composition of the outlet gas mixture was measured several times at each temperature (at least for 30 min), to ensure that the activity was stable in time. As there was only negligible content of other carbon-containing products apart from CO and CO2, the degree of conversion of formic acid was determined as the sum of CO and CO2 concentrations related to the initial concentration of formic acid. Apparent activation energies and turnover frequencies (TOFs) were calculated at low conversions (<20%). The TOFs were determined based on the total number of metal atoms in the sample.
Results
Characterization of the catalysts and supports
Table 1 shows some characterization data for the calcined Au catalysts on different supports studied. It is seen that the BET surface areas of the supports differed from 2 to 136 m2 g−1. In spite of this, the average pore diameters were quite similar ranging from 4.0 to 6.6 nm. These sizes indicate that the catalysts were mainly mesoporous implying easy transport of formic acid and products in the pores.| Catalysts | S BET, m2 g−1 | Average pore diameter in metal oxide, nm | Au content, wt% | Mean Au particle size, nm | E a, kJ mol−1 |
|---|---|---|---|---|---|
| Au/Al2O3 | 136 | 5.4 | 2.50 | 2.6 | 57 |
| Au/ZrO2 | 110 | 6.6 | 2.57 | 2.5 | 53 |
| Au/MgO | 105 | 4.0 | 2.59 | 3.0 | 44 |
| Au/CeO2 | 14 | 6.0 | 2.59 | 2.4 | 39 |
| Au/La2O3 | 2 | 5.7 | 2.06 | 2.4 | 56 |
It is seen in Table 1 that the measured content of Au was slightly lower than the calculated one (3 wt%). This could be explained by a higher content of water in the Au precursor than expected. The mean Au particle sizes measured by conventional TEM (JEM-2010) were in the narrow range from 2.4 to 3.0 nm for all the catalysts studied. These particle sizes corresponded to the dispersion of 39–49% calculated for a spherical shape of the Au particles. As the difference in these values was small, we accepted that the mean particle size was the same for all samples. This approach facilitated substantially the elucidation of the support effect for the reaction allowing the particle size effect to be neglected.
Based on the earlier studies,5–7 one can suppose that some catalyst supports may provide stabilization of sub-nanometre sized Au species in the form of isolated atoms in a cationic state. Hence, we used EXAFS, XPS and HAADF/STEM to reveal the state of Au in the most active Au/Al2O3 sample.
EXAFS spectroscopy is a well-known powerful instrument which allows direct information concerning the local arrangement of gold in nanosized (nanostructured) systems to be obtained.20 The interatomic distances (R) and coordination numbers (CN) are the main parameters, which can be estimated by this method. Earlier, we have studied different gold mono- and hetero-metallic nanosystems, including nanostructured catalysts stabilized on oxide supports by means of EXAFS, and showed that this method is useful for structural studies and phase analysis of active components for highly dispersed and low-metal content catalysts.21,22
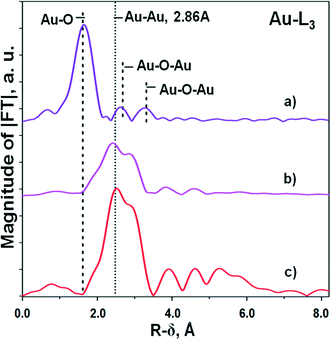
The curves of the radial distribution function of atoms (RDF) describing the local arrangement of gold for the initial and reduced Au/Al2O3 samples are shown in Fig. 1. The initial sample is the sample obtained after the deposition of Au species, their hydrolysis and drying at room temperature. This sample was not calcined at high temperatures and was not reduced. A comparison of the curves was performed with the curves obtained for the reference Au foil. For the initial sample, no metallic Au0 species were determined within the method limit. Obviously, the first main peak in RDF located at 1.2–2.2 Å must be attributed to the Au–O distance ∼2.0 Å,23,24 while the next two low amplitude peaks within the region 2.3–4.0 Å – to a few Au–O–Au distances. Fitting gives the following set of values: RAu–O ∼ 1.98 Å, CN ∼ 5.9-6.0; RAu–O–Au ∼ 3.05 Å, CN ∼ 2.2; RAu–O–Au = 3.69–3.74 Å, CN ∼ 2.3 (Table 2). These Au parameters correspond to a hydroxy-oxide structure, which is not similar to that of the bulk Au2O3 oxide (Au3+ cations in 4-coordinated positions),23 because Au3+ cations are located in almost octahedral oxygen surrounding.
| Au/Al2O3, initial | Au/Al2O3, reduced | Au foil | ||||
|---|---|---|---|---|---|---|
| R, Å | CN | R, Å | CN | R, Å | CN | |
| Au–O | 1.98 | 5.9–6.0 | — | — | — | — |
| Au–Au | — | — | 2.81 | 6.4–6.9 | 2.86 | 12.0 |
| Au–O–Au | 3.05 | 2.2 | — | — | — | — |
| Au–O–Au | 3.69–3.74 | 2.3 | — | — | — | — |
In contrast, the reduced sample contains only metallic species as no Au–O features were observed. The very high dispersion of Au observed from the TEM measurements (Table 1) is further confirmed by calculations of the shortest average distance between Au atoms and coordination number giving the values of ∼2.81 Å and 6.4–6.9, respectively, in comparison with those values for the Au foil (2.86 Å and 12.0)25 (Table 2). Very similar values were also obtained for the calcined sample.
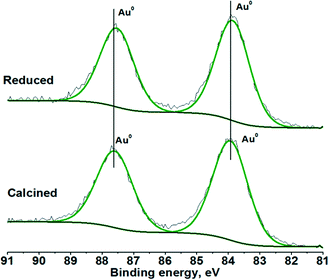
XPS measurements of the calcined and reduced Au/Al2O3 catalysts led to very similar spectra with binding energies for the Au 4f doublet at 83.9 and 87.6 eV, indicating the presence of metallic Au (Fig. 2). One can suppose the presence of shoulders for these lines at about 5% of the intensity located at higher binding energy tails of the peaks, which could be related to Auδ+ species. However, as the shoulders do not change with high temperature reduction, the possibility of the presence of these species is low.
The mean particle size for the calcined Au/Al2O3 sample after the reaction measured with atomic resolution HAADF/STEM (Titan 60–300, Fig. 3a) was the same as before the reaction measured by conventional TEM (Table 1). This indicated that the reaction does not influence significantly the size of the Au nanoparticles.
 | ||
| Fig. 3 Low (a) and high (b, c) resolution HAADF/STEM images of the calcined Au/Al2O3 catalyst after the reaction (single atoms are indicated with arrows). | ||
The major aim for utilization of HAADF/STEM was to reveal the presence of small clusters and isolated Au species. Earlier, this approach allowed us to reveal a large content of isolated Pd atoms in Pd catalysts supported on nitrogen-doped mesoporous carbon.19 Using a number of methods and DFT calculations, we showed that these species could be the active sites for formic acid decomposition. In the present work, the images of the Au/Al2O3 catalyst depicted in Fig. 3b and c demonstrate that very rare small clusters and isolated atoms could be seen in the sample. It was really difficult to find them, as their content was too small in comparison with the content of larger Au nanoparticles. Moreover, we cannot conclude definitively that all the observed single atoms are Au and not some impurities in the sample.
Catalytic properties of the catalysts on different supports
The catalytic activity for the calcined Au catalysts on different supports was compared at high conversions by comparing the temperatures for 50% conversion (Fig. 4a) as well as at small conversions by comparing the TOF values (Fig. 5). It is seen in Fig. 4a that the Au/Al2O3 catalyst showed the lowest temperature for 50% conversion. It was followed by the Au/La2O3 and Au/ZrO2 catalysts, while the catalysts on the MgO and CeO2 supports were much less active. The selectivity for hydrogen production was also the highest for the Au/Al2O3 catalyst (Fig. 4b). The lowest selectivity of about 90% was obtained for the Au/CeO2 and Au/ZrO2 catalysts. These catalysts were probably very active in reverse WGS reaction converting H2 and CO2 products to CO and H2O.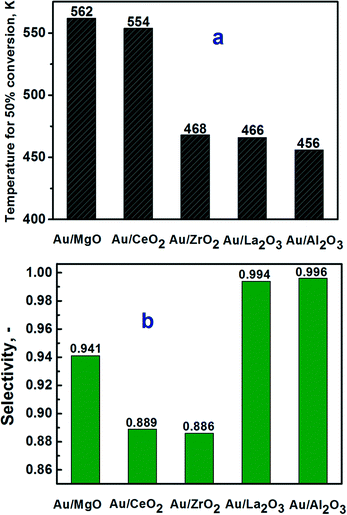 | ||
| Fig. 4 a) Temperature for 50% of conversion of formic acid and b) selectivity to hydrogen at this temperature for the calcined Au catalysts supported on different metal oxides. | ||
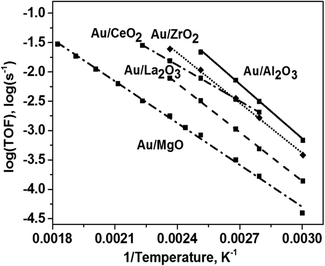 | ||
| Fig. 5 Arrhenius plots for TOFs in the decomposition of formic acid on the calcined Au catalysts supported on different metal oxides. | ||
The Arrhenius plots for the TOFs for formic acid conversion over the Au catalysts on different supports are shown in Fig. 5. The activity trend of the catalysts differed slightly from the trend obtained at 50% conversion (Fig. 4a). However, the Au/Al2O3 catalyst was still the most active catalyst and the Au/MgO catalyst possessed the lowest activity. At the same time, this Au/MgO catalyst was highly active in liquid phase oxidation of alcohols.21 The apparent activation energies for formic acid decomposition (Table 1) were quite similar for the Au catalysts on the Al2O3, ZrO2 and La2O3 supports, showing the values of 53–57 kJ mol−1, while the values were lower for the catalysts supported on MgO and CeO2 – 44 and 39 kJ mol−1, respectively.
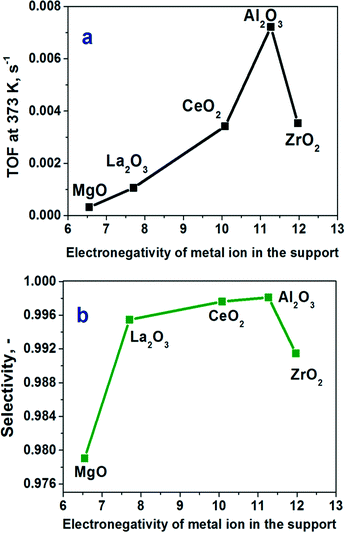
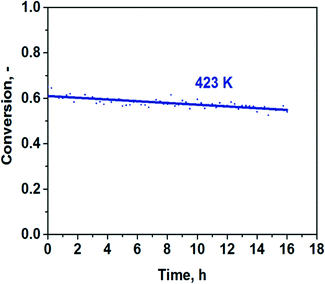
Using an approach applied in ref. 12 and 13, we plotted the TOFs as a function of the electronegativity of the support's cation (Xi). The latter value was calculated from Pauling's electronegativity (x0) and the charge of the metal cation (Z) using an equation (Xi = (1 + 2Z)*x0).26 The TOFs at 373 K plotted as a function of the electronegativity of the metal cation demonstrated a strong volcano-type dependence with the Au/Al2O3 catalyst on the top (Fig. 6a). It is evident that for the optimal performance, the support should not be too basic as the activity of the most basic Au/MgO catalyst was about 20 times lower than that of the Au/Al2O3 catalyst. The Au/Al2O3 catalyst showed almost CO-free hydrogen production. The CO content was less than 40 ppm under these conditions (Fig. 6b), whereas the others showed a higher content of CO in the products. There is also an important question whether the Au/Al2O3 catalyst can be stable in the reaction for a long time. The result of long-term testing of the reduced sample is shown in Fig. 7. It is seen that the conversion of formic acid over this catalyst changes only weakly from 61 to 55% within 16 h. The low content of CO and good stability could be important for possible utilization of the catalyst in fuel cells.
Discussion
As we showed above, the comparison of the performances of the catalysts on different supports with the same mean Au particle sizes led to a conclusion that the Au/Al2O3 catalyst possesses the best performance with the highest activity and selectivity for hydrogen production. This catalyst also demonstrated a sufficient stability. Earlier, the superior activity of highly dispersed Au11,27 and Ag28 catalysts on alumina supports as compared to the catalysts on other supports has been reported for different reactions. The dependence of the TOFs on the electronegativity of the metal cation in the support clearly points out that the activity depends on the ability of the cation to withdraw electrons. This determines the acid–base properties of the support and indicates that these properties influence strongly the activity of the Au catalysts.It is interesting that the observed trend of the activity corresponds well to the trend of the content of Lewis acid sites in the same supports, which we measured earlier by pyridine adsorption combined with FTIR spectroscopy.14 The alumina support possessed the highest content of Lewis acid sites (25 μmol g−1), while CeO2 and ZrO2 contained a lower concentration of these sites (10 μmol g−1 for both), which were stronger for CeO2. The MgO and La2O3 supports did not show any presence of Lewis acid sites able to adsorb pyridine. These data indicate that the Lewis acid sites are important for the activation of formic acid. Additionally, the basic supports (MgO, La2O3) adsorb strongly the product of the reaction (CO2) leading to the poisoning of the support surface at low temperatures used.
It could be useful to compare the rates of the reaction over the catalysts and catalyst supports. The results for formic acid decomposition over oxide materials have been reviewed by Trillo et al.29 They showed that oxides like Al2O3, MgO, TiO2 and others are less active in the reaction as the decomposition takes place at much higher temperatures (>550 K) as compared to that over the studied supported Au catalysts (>373 K). In a more recent study, Patermarakis30 has studied the kinetics of formic acid decomposition over γ-Al2O3 with a BET surface area close to our Al2O3 support. Formic acid dehydration was the major path of the conversion of formic acid with an apparent activation energy of about 87 kJ mol−1 and about 130 kJ mol−1 for dehydrogenation. Both values were much higher than that for the Au/Al2O3 catalyst (57 kJ mol−1, Table 1). The rate of formic acid conversion over Al2O3 at 373 K estimated from the data of Patermarakis was by 3 orders of magnitude lower than that over our Au/Al2O3 catalyst. Hence, the direct contribution of the reaction over the support is negligible.
It is interesting that the CeO2 and ZrO2 supports as compared to the others are reducible oxide supports; however, this fact is not predominant for the catalytic activity in the considered reaction. As the Al2O3 support is amphoteric and contains both types of sites: acidic and basic, they both could play a certain role in formic acid conversion. For example, as proposed by Shimizu et al.28 basic sites may facilitate the abstracting of proton from alcohol forming an alkoxide intermediate, while acidic sites (OHδ+) facilitate hydrogen transfer.
We consider several possible reasons for the explanation of the highest activity of the Au/Al2O3 catalyst in hydrogen production from formic acid as compared to the catalysts with the same mean Au particle size on the other supports (Fig. 6a). Among them, we can mention the highest concentration of single Au atoms/cations as possible active sites, the optimized electronic properties or the shape of Au nanoparticles on the alumina support and the highest concentration of reaction intermediates formed on the support further transforming on the Au/alumina interface to the reaction products. The analysis of the surface of the Au/Al2O3 sample by XPS, and of the bulk by EXAFS and HAADF/STEM indicated the presence of only metallic Au nanoparticles. Therefore, we cannot accept that the support effect is related to a higher concentration of Au atoms/cations on the Al2O3 support than on the other supports; however, further experiments with catalysts leached by NaCN could be useful to determine the content of Au ions quantitatively. The electronic properties of Au in the catalysts on the same supports were analysed earlier by XPS and no serious change in the position of the Au 4f peak was observed.13 Hence, we cannot assign the difference in the activity of Au on the nature of the support to the difference in electronic properties of the Au nanoparticles. We cannot also accept the approach related to the different contents of some specific sites, for example, corner sites in the Au nanoparticles on different supports, as we do not expect a strong dependence of the shape of Au nanoparticles on the acidity of the support with an optimum for the alumina. Moreover, as we reported earlier, the shapes of the Au particles on some supports were quite similar.13
Therefore, the observed behaviour of the catalytic activity should be attributed to the activation of the formic acid molecule on the support sites followed by further conversion of the formed reaction intermediate on some interfacial corner or edge sites of Au nanoparticles8,31 giving hydrogen and carbon dioxide. The role of interfacial sites is considered for a number of catalytic reactions including CO oxidation and H2/D2 exchange.32 An FTIR study could be useful to determine the nature of the intermediate. However, it will not be easy to do this, as for example, the nature of the intermediate for the WGS reaction is still under discussion. Thus, formate or carboxyl species are considered by different authors.33 The problem is that formic acid should interact strongly with the support forming surface formate species, a significant part of which does not possess reaction ability.33,34
It could be also of interest to compare the activity of the Au/Al2O3 catalyst and the apparent activation energies with the literature data. The obtained apparent activation energy values of 57 kJ mol−1 corresponded well to the literature data for different Au catalysts,4,6,9,10,35 not only limited to the catalysts with single supported Au atoms as active sites.4,6 At the same time, the analysis showed that the TOFs obtained in our work were lower than those obtained for the catalysts with single Au atomic species. However, we expect that the activity of the catalysts could be significantly improved by using alkali metal ions as promoters. We showed earlier that the application of potassium carbonate/formate as a promoter improved the reaction rate over a Pd/C catalyst containing nanoparticles of about 3.6 nm by 1–2 orders of magnitude and this takes place because of a change in the mechanism of the reaction.36,37
Conclusions
The Au/Al2O3 catalyst showed the highest activity and almost CO-free hydrogen production in formic acid decomposition in comparison with the Au catalysts with the same mean Au particle sizes (2.4–3.0 nm) on ZrO2, CeO2, La2O3 and MgO supports. After being plotted as a function of the electronegativity of the metal ion in the support, the TOF values showed a volcano-type curve indicating a dependence of the catalytic activity on the acid–base properties of the support. The major mechanism of the reaction, taking place on the studied catalysts, was related to the activation of formic acid on the catalyst's support followed by further conversion of the formed intermediate on metal/support interface sites.Acknowledgements
This publication has emanated from research conducted with the financial support of the Russian Science Foundation (Grant 16-13-00016). Collaboration between partner institutions was partly supported by European FP7 IRSES project 295180 (MagNonMag) as well as by CONACyT (México) and PAPIIT-UNAM (México) through Grants 179619 and 203813, respectively. The work related to the measurements of EXAFS spectra was supported by RFBR (14-03-01066, 16-03-01139). It was done using the infrastructure of the Shared-Use Centre “Siberian Synchrotron and Terahertz Radiation Centre” based on VEPP-3M of BINP SB RAS. M. Z. acknowledges the support of the Earth and Natural Sciences Doctoral Studies Programme, funded by the Higher Education Authority through the Programme of Research at Third Level Institutions, Cycle 5, co-funded by the European Regional Development Fund. A. L. C. acknowledges financial and technical support of FEI Company in the frame of collaboration project.References
- A. K. Singh, S. Singh and A. Kumar, Catal. Sci. Technol., 2016, 6, 12–40 Search PubMed.
- D. A. Bulushev and J. R. H. Ross, Catal. Today, 2011, 163, 42–46 CrossRef CAS.
- J. C. Serrano-Ruiz, D. J. Braden, R. M. West and J. A. Dumesic, Appl. Catal., B, 2010, 100, 184–189 CrossRef CAS.
- M. Ojeda and E. Iglesia, Angew. Chem., Int. Ed., 2009, 48, 4800–4803 CrossRef CAS PubMed.
- M. Flytzani-Stephanopoulos, Accounts in Chemical Research, 2014, vol. 47, pp. 783–792 Search PubMed.
- N. Yi, H. Saltsburg and M. Flytzani-Stephanopoulos, ChemSusChem, 2013, 6, 816–819 CrossRef CAS PubMed.
- A. Ciftci, D. Ligthart, P. Pastorino and E. J. M. Hensen, Appl. Catal., B, 2013, 130, 325–335 CrossRef.
- S. Singh, S. Li, R. Carrasquillo-Flores, A. C. Alba-Rubio, J. A. Dumesic and M. Mavrikakis, AIChE J., 2014, 60, 1303–1319 CrossRef CAS.
- A. Gazsi, T. Bansagi and F. Solymosi, J. Phys. Chem. C, 2011, 115, 15459–15466 CAS.
- D. A. Bulushev, S. Beloshapkin and J. R. H. Ross, Catal. Today, 2010, 154, 7–12 CrossRef CAS.
- G. A. Filonenko, W. L. Vrijburg, E. J. M. Hensen and E. A. Pidko, J. Catal. DOI:10.1016/j.jcat.2015.10.002.
- T. Ishida, R. Takamura, T. Takei, T. Akita and M. Haruta, Appl. Catal., A, 2012, 413, 261–266 CrossRef.
- Y. S. Demidova, I. L. Simakova, M. Estrada, S. Beloshapkin, E. V. Suslov, D. V. Korchagina, K. P. Volcho, N. F. Salakhutdinov, A. V. Simakov and D. Y. Murzin, Appl. Catal., A, 2013, 464, 348–356 CrossRef.
- O. A. Simakova, E. Smolentseva, M. Estrada, E. V. Murzina, S. Beloshapkin, S. M. Willfor, A. V. Simakov and D. Y. Murzin, J. Catal., 2012, 291, 95–103 CrossRef CAS.
- R. Zanella, S. Giorgio, C. R. Henry and C. Louis, J. Phys. Chem. B, 2002, 106, 7634–7642 CrossRef CAS.
- D. I. Kochubey, EXAFS spectroscopy of catalysts, Nauka, Novosibirsk, 1992 Search PubMed.
- K. V. Klementiev, VIPER (Visual Processing in EXAFS Researches), https://intranet.cells.es/Beamlines/CLAESS/software/viper.html Search PubMed.
- N. Binsted, J. V. Campbell, S. J. Gurman and P. C. Stephenson, EXCURV92 program code, SERC Daresbury Laboratory, Daresbury, 1991 Search PubMed.
- D. A. Bulushev, M. Zacharska, E. V. Shlyakhova, A. L. Chuvilin, Y. Guo, S. Beloshapkin, A. V. Okotrub and L. G. Bulusheva, ACS Catal., 2016, 6, 681–691 CrossRef CAS.
- D. C. Konigsberger and R. Prins, X-ray absorption principles and application techniques, Wiley, New York, 1988 Search PubMed.
- V. V. Costa, M. B. Estrada, Y. Demidova, I. Prosvirin, V. Kriventsov, R. F. Cotta, S. Fuentes, A. Simakov and E. V. Gusevskaya, J. Catal., 2012, 292, 148–156 CrossRef CAS.
- S. A. Nikolaev, A. V. Chistyakov, M. V. Chudakova, E. P. Yakimchuk, V. V. Kriventsov and M. V. Tsodikov, J. Catal., 2013, 297, 296–305 CrossRef CAS.
- ICSD Database Code 8014 -Au2O3.
- ICSD Database Code 64701 -AuAlO2.
- ICSD Database Code 64701 -Au0.
- K. Tanaka and A. Ozaki, J. Catal., 1967, 8, 1–7 CrossRef CAS.
- E. Smolentseva, A. Simakov, S. Beloshapkin, M. Estrada, E. Vargas, V. Sobolev, R. Kenzhin and S. Fuentes, Appl. Catal., B, 2012, 115, 117–128 CrossRef.
- K. Shimizu, M. Nishimura and A. Satsuma, ChemCatChem, 2009, 1, 497–503 CrossRef CAS.
- J. M. Trillo, G. Munera and J. M. Criado, Catal. Rev., 1972, 7, 51–86 CAS.
- G. Patermarakis, Appl. Catal., A, 2003, 252, 231–241 CrossRef CAS.
- J. Ohyama, A. Esaki, T. Koketsu, Y. Yamamoto, S. Arai and A. Satsuma, J. Catal., 2016, 335, 24–35 CrossRef CAS.
- M. Haruta, Angew. Chem., Int. Ed., 2014, 53, 52–56 CrossRef CAS PubMed.
- R. Burch, A. Goguet and F. C. Meunier, Appl. Catal., A, 2011, 409, 3–12 CrossRef.
- C. M. Kalamaras, G. G. Olympiou and A. M. Efstathiou, Catal. Today, 2008, 138, 228–234 CrossRef CAS.
- D. A. Bulushev, S. Beloshapkin, P. E. Plyusnin, Y. V. Shubin, V. I. Bukhtiyarov, S. V. Korenev and J. R. H. Ross, J. Catal., 2013, 299, 171–180 CrossRef CAS.
- L. Jia, D. A. Bulushev, S. Beloshapkin and J. R. H. Ross, Appl. Catal., B, 2014, 160, 35–43 CrossRef.
- L. Jia, D. A. Bulushev and J. R. H. Ross, Catal. Today, 2016, 259, 453–459 CrossRef CAS.
| This journal is © The Royal Society of Chemistry 2016 |

