
 Open Access Article
 This Open Access Article is licensed under a
 Creative Commons Attribution 3.0 Unported Licence
Understanding oxidative dehydrogenation of ethane on Co3O4 nanorods from density functional theory
Victor
Fung
a,
Franklin (Feng)
Tao
b and
De-en
Jiang
*a
aDepartment of Chemistry, University of California, Riverside, CA 92521, USA. E-mail: de-en.jiang@ucr.edu; Tel: +1 951 827 4430
bDepartment of Chemical and Petroleum Engineering and Department of Chemistry, University of Kansas, Lawrence, KS 66045, USA
First published on 20th May 2016
Abstract
Co3O4 is a metal oxide catalyst with weak, tunable M–O bonds promising for catalysis. Here, density functional theory (DFT) is used to study the oxidative dehydrogenation (ODH) of ethane on Co3O4 nanorods based on the preferred surface orientation (111) from the experimental electron-microscopy image. The pathway and energetics of the full catalytic cycle including the first and second C–H bond cleavages, hydroxyl clustering, water formation, and oxygen-site regeneration are determined. We find that both lattice O and Co may participate as active sites in the dehydrogenation, with the lattice-O pathway being favored. We identify the best ethane ODH pathway based on the overall energy profiles of several routes. We identify that water formation from the lattice oxygen has the highest energy barrier and is likely a rate-determining step. This work of the complete catalytic cycle of ethane ODH will allow further study into tuning the surface chemistry of Co3O4 nanorods for high selectivity of alkane ODH reactions.
1. Introduction
The conversion of alkanes such as ethane and propane into olefins is an industrially and economically important process and produces a significant portion of highly desired feedstock used in the chemical industry. Due to the high expense and energy cost of steam cracking to produce these olefins, there has been intense effort in recent years to search for more selective and energetically efficient methods.1 Catalytic oxidative dehydrogenation (ODH) has been proposed as an attractive alternative with the advantage of being more thermodynamically favored and with the potential to have greater selectivity at lower temperatures. These qualities of the ODH pathway would significantly reduce the costs of olefin production to suit the quickly increasing global demand.2A wide variety of catalytic materials have been studied for the ODH reaction: earth-abundant metal oxides3–18 appear as cost-effective and more viable alternatives to noble metal catalysts. In particular, spinel cobalt oxide (Co3O4) is a particularly promising candidate which has been found to be very active in many oxidation reactions including those of CO,19 CH4,20 and other hydrocarbons.21 A major factor in the catalytic activity of Co3O4 is the very weak M–O bond among other transition metal oxides22 and the presence of readily generated oxygen vacancies at the surface.20,23 Experimental and theoretical studies have identified a number of stable surfaces on the Co3O4 nanoparticles and nanorods, including the (100), (110) and (111) surfaces.19,21,24–32
Of these surfaces, the high activity of the (110) facet for reactions such as CO oxidation has been widely reported; however, the (111) surface has been found to be readily formed26,29 and more thermodynamically stable28 than the (110) surface. Therefore, the morphology of Co3O4 nanocatalysts may greatly impact their catalytic activity due to the difference in preferred surface orientations and it would be very interesting to understand the change in the reaction mechanism on those different surfaces. DFT has been employed in many previous studies on the surface properties and catalytic activity of Co3O4 that is thought to proceed via the Mars–van Krevelen mechanism involving the lattice oxygen on the surface.33–37 These active oxygen species react and desorb in products to form vacancies which must then be regenerated from gaseous molecular oxygen in order to maintain the catalytic activity of the surface.
Several recent works have shown that modifying the pure Co3O4 surface can improve its performance for alkane activation. These methods include doping transition metals such as Ni to facilitate the oxidation of alkanes20 and depositing nonmetallic elements such as Si and Ge onto the surface of Co3O4 nanorods to tune the selectivity of the catalyst towards the ethane ODH product.38 However, the underlying mechanism of how the modification of the Co3O4 surface by other elements changes the activity and selectivity of the nanocatalyst for ethane ODH remains unclear.
As a first step toward understanding the roles of morphology control and surface modification in Co3O4 nanocatalysts for ethane ODH, herein we present the detailed analysis of the full catalytic cycle from first principles based on the experimental determination of the preferred surface orientation of Co3O4 nanorods. We elucidate the nature of the two C–H activations to produce ethylene, the formation of water, and the regeneration of the oxygen sites to complete the catalytic cycle. These insights will provide a better understanding of the role of the different active surface atoms on a specific surface orientation in determining the selectivity and yield of the ethane ODH pathway that may allow one to design better Co3O4 nanocatalysts.
2. Experimental and computational methods
Co3O4 nanorods were synthesized via a previously reported method.23,39 Briefly, cobalt acetate tetrahydrate was dissolved in ethylene glycol and heated to 160 °C under N2, then reacted with a slowly added NaHCO3 aqueous solution under vigorous stirring. After centrifugation, a purple precipitate was obtained, which was then dried at 50 °C under vacuum and calcined at 350 °C in air to yield the Co3O4 nanorods. Their crystalline form was checked using powder X-ray diffraction. Then, the nanorods were imaged by high-angle annular dark field (HAADF) scanning transmission electron microscopy (STEM) on a JEOL JEM-ARM200F transmission electron microscope at 200 kV. Based on the surface orientation of the Co3O4 nanorods from the STEM images, we then employed density functional theory (DFT) to examine the ethane ODH pathways on it.All DFT calculations were performed using the Vienna ab initio simulation package (VASP).40,41 The on-site Coulomb interaction was included using the DFT+U method by Dudarev et al.42 with a Hubbard parameter of U = 2 eV for Co, which yielded band gaps in good agreement with the experimental results and was used to good effect in previous DFT studies of Co3O4 surface chemistry and catalysis.19,20 The Perdew–Burke–Ernzerhof (PBE)43 form of the generalized-gradient approximation (GGA) was chosen for electron exchange and correlation. The electron–core interaction was described using the projector-augmented wave method (PAW).44,45 A kinetic energy cutoff of 450 eV was used for the planewaves, and the Brillouin zone was sampled using a 3 × 3 × 1 Monkhorst–Pack scheme.46 All calculations in this work were performed with spin polarization. The slab was created containing 11 layers with the bottom 9 layers frozen in their bulk positions. The optimized lattice constant was found to be 8.14 Å, in very good agreement with the experimental value of 8.09 Å.47
The adsorption energies were defined by Eads = Esurface+adsorbate − (Esurface + Eadsorbate), where the energy of the adsorbate Eadsorbate was computed by placing an adsorbate molecule in a cubic cell of 10 Å in side length (in other words, the molecule and its nearest periodic images are separated by about 10 Å vacuum). Transition states were found via a two-step approach, using both the nudged elastic band method (NEB) and the dimer method48 implemented in the VASP-VTST package by Henkelman et al.49 The initial and final states of the reactions were first identified and optimized, and were used to generate 8–10 equally spaced images between them through linear interpolation. These images were then minimized under the NEB constraints to forces of ∼0.4–0.2 eV Å−1 in order to generate an approximate minimum reaction energy path. The highest two energy images along the path were then used to generate a starting geometry for the dimer method, until reaching an energy convergence of 0.05 eV Å−1. Selected transition states were confirmed by vibrational frequency analysis to verify the effectiveness of this method and the convergence criterion.
3. Results and discussion
3.1 Surface structure of Co3O4 nanorods
Recent work has shown that Si and Ge-modified Co3O4 nanorods improved the selectivity and yield of ethane ODH, but the molecular-level mechanism is still unclear.38 Here, we first direct our attention to modeling the mechanism of ethane ODH on the experimentally produced Co3O4 nanorods, so we can examine the role of the surface modification in the future. The synthesized Co3O4 nanorods were imaged via scanning tunneling electron microscopy (STEM) (Fig. 1A and B). The atomic-resolution HAADF-STEM image (Fig. 1B) suggests that the Co3O4(111) surface is preferentially exposed in this sample of Co3O4 nanorods. This information about the surface orientation provides a desired foundation for our DFT modeling. The Co3O4(111) surface and the Co3O4(110) surface are both catalytically active and stable surfaces confirmed from both experimental and theoretical studies in the previous literature.26,28,29 Based on the STEM images, we chose the (111) surface as a model active surface in this work. | ||
| Fig. 1 (A) STEM image of a large area of a Co3O4 nanorod sample. (B) HAADF-STEM image of a small area of the Co3O4 nanorod sample, marked with lattice fringes. (C) The surface model used in this DFT study for the same Co3O4(111) surface: only the first three layers are shown for clarity. The two inequivalent surface lattice oxygens are labeled OA and OB: OA is coordinated to three subsurface Co3+ atoms (in light blue); OB is coordinated to two subsurface Co3+ atoms and one surface Co2+ atom (dark blue). | ||
The Co3O4(111) surface can be terminated into six inequivalent layers; we chose the one with the lowest surface energy based on previous DFT calculations.28 This surface model terminates to yield tetrahedral Co2+ atoms and triply coordinated oxygen atoms on the surface (Fig. 1C). The surface lattice oxygens can be categorized into two types: OA, which are triply coordinated to the subsurface cobalt (Co3+); OB, which are doubly coordinated to the subsurface Co but also singly coordinated to the surface Co (Fig. 1C). After relaxation of this Co3O4(111) surface termination, the surface Co–OB bonds shorten from 1.952 to 1.788 Å. The OA–Co bonds shorten from 1.932 to 1.885 Å. In predicting the reactivity of the two inequivalent lattice O atoms, we find that OA has a lower vacancy formation energy of 2.488 eV and a higher average Bader charge of −0.767 |e|. Meanwhile, OB has a vacancy formation energy of 2.946 eV and an average Bader charge of −0.860 |e|. The average Bader charge of the surface Co was found to be 1.298 |e|. The lower OA vacancy formation energy suggests that the OA oxygen is more active and more likely to react to result in a vacancy.
Both OA and OB vacancies lead to minimal surface rearrangement, with the OA vacancy leading to the least change in surface bond lengths and the OB vacancy leading to a shortening of the remaining two Co–OB bonds from 1.788 to 1.769 Å. These results show that the Co3O4(111) surface can readily generate and refill oxygen vacancies without loss of surface structure, suggesting robustness and stability consistent with experimental and theoretical findings,26,28,50 and making it a good candidate as the model for the catalytic surface.
The less negative Bader charge of OA than that of OB indicates the increased ability of the OA oxygen to further gain electrons, so OA is more electrophilic than OB and thus is the more favored active site for the homolytic fission of the C–H bond in the ethane ODH reaction. The more negative Bader charge of OB suggests that it is more nucleophilic in character and more suitable for the heterolytic fission of the C–H bond as part of the metal–oxygen redox pair, where the metal cation Co2+ participates as the electrophile. Both the homolytic and heterolytic C–H cleavages will be examined next.
3.2 First C–H activation of ethane
In alkane oxidation reactions over metal oxides, both the full oxidation and ODH reactions proceed first via C–H activation onto the surface. Thus, we first studied the activation of the ethane C–H bond by either a surface oxygen or cobalt. It can be characterized as either a homolytic or heterolytic mechanism, via the lattice oxygen or lattice cobalt, respectively.21,51–53 In the homolytic case, the oxygen atom abstracts a hydrogen from the alkane, forming an alkyl radical which then reacts with a nearby lattice oxygen. In the heterolytic case, the reaction occurs over the Co–O acid–base site pair with the lattice Co activating the C–H bond via σ-bond metathesis, leading to the formation of Co–C2H5 and O–H.We examined both the heterolytic and homolytic pathways on the Co3O4(111) surface. Based on the configuration of the surface cobalt and oxygen, there should be five possible final states. Starting with weakly physisorbed C2H6 on the surface, we found the minimum energy paths and transition states leading to the five final states. These transition and final states are illustrated in Fig. 2, while the energy profiles are shown in Fig. 3. For the heterolytic activation (reactions 1A and B), the transition states were found to form a Co–C2H5–H–O complex. The barrier for the pathway via OB is 1.02 eV, lower than that via OA (1.11 eV), likely due to the fact that OA is slightly farther from Co than OB, which results in a less stable transition state complex. For the homolytic activation (reactions 1C–E), the transition states show the formation of a CH3CH2–H–O complex where the C–H–O angle is almost 180 degrees, while in the final states, the ethyl group attaches to another nearby lattice O. Reaction 1C is activated by the OA oxygen with a barrier of 0.62 eV, whereas reactions 1D and 1E are both activated by the OB oxygen with a similar barrier of 0.98 to 1.03 eV. The stronger oxidizing power of OA than that of OB, as indicated by the charge analysis, corroborates the lower activation energy of the first C–H activation on OA.
 | ||
| Fig. 2 Transition and final states for the first C–H activation on Co3O4(111). Reactions 1A and 1B are Co2+-activated heterolytic reactions. Reactions 1C–E are O-activated homolytic reactions. | ||
 | ||
| Fig. 3 Energy profiles of the first C–H activation. Reactions 1A and 1B are Co-activated, whereas reactions 1C–1E are O-activated. | ||
The energy barriers (Ea) and reaction energies (ΔE) of both the heterolytic and homolytic pathways of 1A–E are compared in Table 1, together with those of propane from another study.21 We find that our calculated barriers are in very good agreement with the propane barriers for the same surface. It is apparent that the homolytic pathway is both the thermodynamically and kinetically favored reaction path due to the overall lower barriers as well as the more negative reaction energies. The OA-catalyzed pathway has the lowest barrier by far with a value of 0.62 eV. These results are also in good agreement with the propane DFT results and consistent with the higher bond dissociation energy of the ethane C–H bond.
| No. | Reaction pathway | Ethane Ea (eV) | Ethane ΔE (eV) | Propane Ea (eV) (ref. 21) | Propane ΔE (eV) (ref. 21) |
|---|---|---|---|---|---|
| 1A | C2H6(g) → C2H5–Co2+ + OB–H | 1.02 | −0.47 | 0.95 | −0.71 |
| 1B | C2H6(g) → C2H5–Co2+ + OA–H | 1.11 | −0.33 | N/A | N/A |
| 1C | C2H6(g) → C2H5–OB + OA–H | 0.62 | −1.07 | 0.41 | −1.41 |
| 1D | C2H6(g) → C2H5–OB + OB–H | 1.03 | −0.75 | 0.60 | −0.80 |
| 1E | C2H6(g) → C2H5–OA + OB–H | 0.98 | −1.27 | N/A | N/A |
3.3 Second C–H activation and C2H4 formation
We further examined the second C–H activation of ethane following the first C–H activation. Reactions 1A and 1C were selected as the best starting points for the second activation for the heterolytic and homolytic cases, respectively. The subsequent second C–H pathways (transition states and final states) are illustrated in Fig. 4, while the energy profiles are shown in Fig. 5. In the heterolytic case (following 1A), the second C–H bond is activated via OB on the CH3 group, or β-hydrogen elimination (2A), via OB on the CH2 group, or α-hydrogen elimination (2B), or via OA by β-hydrogen elimination (2C). We find that the 2C path has the lowest barrier of only 0.39 eV (Fig. 5). In the homolytic case (following 1C), the second C–H bond is activated via either OA by β-hydrogen elimination (2D), OB by α-hydrogen elimination (2E), or OA–H in the previous step by α-hydrogen elimination (2F). We found that the 2D and 2E pathways yield very similar barriers of 1.26 eV (Fig. 5). The 2F pathway has a much higher barrier of 2.46 eV, because the presence of a pre-existing adsorbed hydrogen on the lattice O severely deactivates it from further C–H activation. | ||
| Fig. 4 Transition and final states for the second C–H activation of ethane. Reactions 2A–2C continue from the previous heterolytic reaction 1A. Reactions 2D–2F continue from the previous homolytic reaction 1C. | ||
 | ||
| Fig. 5 Energy profiles of the second C–H activation. Reactions 2A–2C follow the 1A path. Reactions 2D–2F follow the 1C path. | ||
The barriers and reaction energies of the second C–H activation are compared in Table 2. Most notably, the second C–H activation following the heterolytic pathway (1A then 2C) appears to have lower barriers than that following the homolytic pathway (1C then 2D or 2E). This result is also consistent with the DFT study of propane on the Co3O4(110) surface.21 Reactions 2A, 2C, and 2D via β-hydrogen elimination all lead to ethylene formation. In the case of 2A and 2C, we found that desorption of C2H4 is uphill by about 1.0 eV, while in the case of 2D, C2H4 was found to spontaneously go to the gas phase. Reactions 2B, 2E, and 2F via α-hydrogen elimination generate CH3CH which were found to bind very strongly to the surface Co or O with a strength greater than 2 eV. We expect that the CH3CH intermediate is unlikely to result in ethylene production and more likely to be part of the further oxidation pathways.
| No. | Reaction pathway | E a (eV) | ΔE (eV) |
|---|---|---|---|
| 2A | C2H5–Co2+ + OB–H → CH2CH2–Co2+ + 2OB–H | 0.87 | −1.08 |
| 2B | C2H5–Co2+ + OB–H → CH3CH–Co2+ + 2OB–H | 1.76 | 0.50 |
| 2C | C2H5–Co2+ + OB–H → CH2CH2–Co2+ + OA–H + OB–H | 0.39 | −1.02 |
| 2D | C2H5–OB + OA–H → CH2CH2–OB + 2OA–H | 1.26 | 0.07 |
| 2E | C2H5–OB + OA–H → CH3CH–OB + OA–H + OB–H | 1.26 | 0.33 |
| 2F | C2H5–OB + OA–H → CH3CH–OB + H–OA–H | 2.47 | 2.34 |
3.4 Hydroxyl clustering, water formation, and water desorption
Following the second C–H activation, ethylene will desorb in the ODH reaction, leaving two lattice O sites with adsorbed hydrogen, that is, the formation of hydroxyls. Previous experimental isotopic studies have thoroughly shown that the oxidation and ODH reactions result in the formation of water containing lattice oxygen.20 Therefore, these surface hydroxyls will come closer (clustering), then form water, and desorb from the surface, in order for the catalytic cycle to proceed. The simplistic path for hydroxyl clustering is via diffusion of the hydrogen atom from a surface hydroxyl to a neighboring lattice oxygen. With two hydroxyl groups nearby, one hydrogen of a hydroxyl can combine with the neighboring hydroxyl to form water. The barrier for a representative H diffusion from OA to OB on the Co3O4(111) surface was found to be 1.35 eV (Fig. 6A). Next, we examined the water formation from two neighboring hydroxyl groups (Fig. 6B) and the barrier increases to 2.02 eV. | ||
| Fig. 6 Initial, transition and final states for hydrogen diffusion across the Co3O4(111) surface: A, diffusion of hydrogen from OA to OB; B, diffusion of hydrogen from OB to an OA–H hydroxyl group. | ||
After the H–O–H species is formed on the surface (Fig. 6B), it can then desorb to the gas phase. The desorption energy was found to be 0.581 eV, much lower than the lattice-oxygen vacancy formation energy (2.488 eV for the OA atom). Indeed, the addition of two hydrogen atoms on the same lattice oxygen destabilizes the system and lengthens the Co–O bonds. Oxygen vacancies are then formed following the desorption of water.
3.5 Regeneration of lattice oxygen sites
The oxygen vacancies left from water desorption can react with gas phase O2 to regenerate the lattice oxygen sites. A very likely scenario would be that one gaseous O2 molecule refills at a double oxygen vacancy site. We found that O2 first binds vertically on one of the vacancies and then one oxygen atom of O2 then dissociates to the neighboring vacancy site. We calculated the barrier of this process and found that it occurs via a barrier of only 0.51 eV and a reaction energy of −4.24 eV (Fig. 7A). These double vacancies may be generated through the process of continuous water formation/desorption reactions on the surface during the catalytic cycle, or through vacancy diffusion across the surface. The diffusion of these oxygen vacancies was also studied and found to have a barrier of 1.63 eV for a diffusion from a vacancy at OB to OA (Fig. 7B). This double-vacancy regeneration model (Fig. 7A) with very low barriers is also consistent with previous theoretical works on the Co3O4(110) surface.19,21 Thus, we can conclude that regeneration of the lattice oxygen sites is highly facile in oxygen-rich environments and unlikely to be a rate-determining step in the overall catalytic cycle.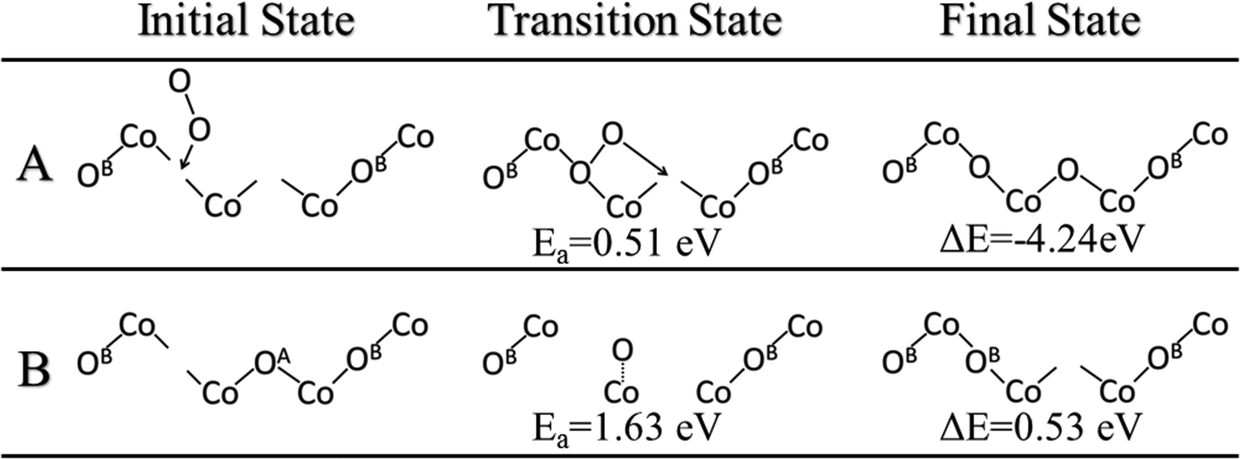 | ||
| Fig. 7 (A) Regeneration of lattice oxygen on Co3O4(111) via reaction of double oxygen vacancies with gaseous molecular oxygen. (B) Vacancy diffusion on the Co3O4(111) surface from the OB site to the OA site. | ||
3.6 Overall energy profile
Fig. 8 shows the overall energy profile including the first and second C–H activations, hydroxyl clustering via hydrogen diffusion, and water formation and desorption. We select the 1C–2D homolytic path as the most representative ODH pathway through consideration of both activation energies and reaction energies, and product desorption. We omit the vacancy regeneration portion of the cycle for simplicity as well as the fact that its barriers are quite low in comparison. Fig. 8 shows that the water formation step is the least energetically favored step and a possible rate-determining step in the overall catalytic cycle. Alternative to the 1C–2D path, we also considered a competitive path via the 1A–2C heterolytic path where the first C–H activation is via Co2+ and the second C–H activation is via OA. We found that again water formation is the rate-determining step (RDS) in this mechanism.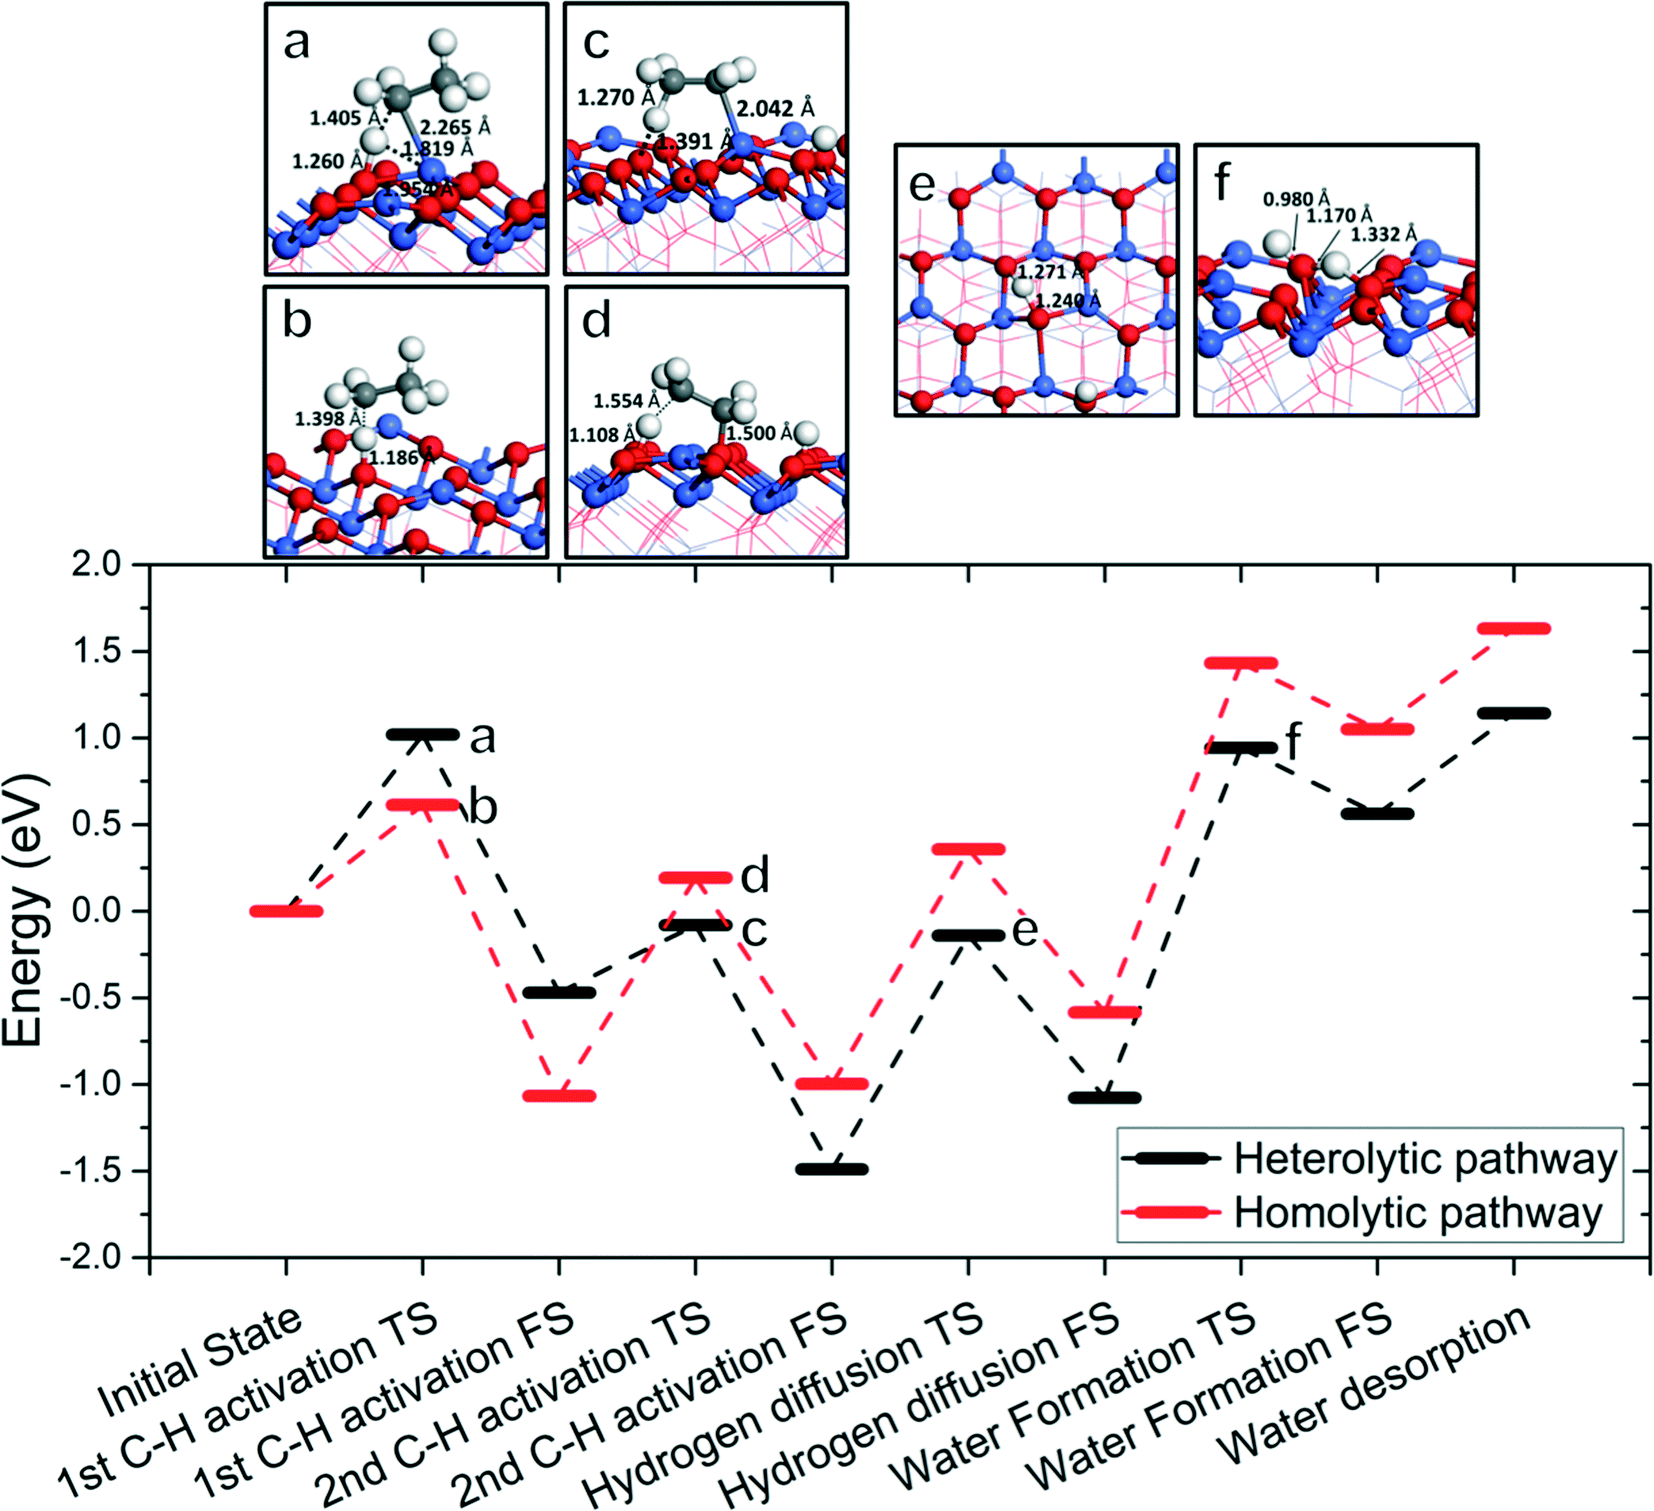 | ||
| Fig. 8 Lower panel: The overall energy profile of ODH of ethane to ethylene on Co3O4(111); upper panel: structures (with key distances) corresponding to the transition states a–f in the energy profile (Co, blue; O, red; C, gray; H, white). In the energy profile, the C–H cleavages follow the 1C–2D homolytic path (red) or the 1A–2C heterolytic path (black) with energetics from Fig. 2–5, while the hydrogen diffusion and water formation energies are from Fig. 6. | ||
A schematic drawing of the complete catalytic cycle for the homolytic path is shown in Fig. 9, composed of the first and second C–H activations, hydrogen diffusion, water formation, and lattice-oxygen regeneration. It starts with C2H6 adsorption, followed by the first C–H cleavage on lattice OA. Then, the second C–H cleavage takes place on another lattice OA, leading to the formation and desorption of C2H4. Next, hydroxyl clusters via hydrogen diffusion and water forms from nearby hydroxyl groups. Water desorbs and leaves lattice-oxygen vacancies, which are refilled by molecular oxygen. The cycle repeats.
 | ||
| Fig. 9 Schematic drawing of the complete catalytic cycle of ethane ODH on the Co3O4(111) surface. | ||
3.7 Implications of the present DFT results
Our present DFT study of ethane ODH on the Co3O4(111) surface presents several interesting perspectives regarding the reaction characteristics. First, we find that for ethane, the first step of the reaction occurs via the activation of its C–H bond over either the Co2+ or the OA/OB atoms. While the first C–H activation is strongly favored towards the O-activated homolytic pathway, the second C–H activation is in fact more favored towards the heterolytic pathway. In reality, it is likely for both pathways to participate in the formation of ethylene; however, without further kinetic analysis, it would be very difficult to quantify their respective contributions towards forming the ODH product.Next, we have found the vacancy formation energy and Bader charge of the lattice oxygen to be good descriptors of the catalytic activity of the lattice oxygen. We were able to predict the OA oxygen to have lower barriers for C–H activation than the OB oxygen. We would expect this trend to hold for lattice oxygen atoms of different Co3O4 surfaces, such as (110), (100), and (112). These surfaces could be important for Co3O4 nanocatalysts with different morphologies.
We find that the water formation step of the catalytic cycle on the pure (111) surface appears to be the RDS, while experiments show that changing the alkane will change the overall barriers,54 thus suggesting that the C–H activation barrier is significant to the overall rates. Based on preliminary DFT results, we believe that the hydroxylation of the surface will affect the energy profile by increasing the barriers of C–H activation and reducing the barriers of H2O formation. In this model, we can then expect that the actual experimental energy profile will have the C–H activation and water formation barriers approach in energy at a steady-state hydrogen coverage of the surface. Thus, varying C–H bond strength would in fact affect the rates of the overall ODH reaction.
Experimental findings have indeed shown that surface hydroxylation occurs on the surfaces of metal oxides as the dominant species during and after a reaction.55,56 In addition, water formation and consequently water concentration were found to affect the rates of the ODH/oxidation reactions on many studied metal oxides.55,57–59 This phenomenon occurs for CO and CH4 oxidation on Co3O4 as well.56,60,61 These experimental findings support our conclusion that water formation is an important step of ethane ODH on Co3O4(111). This phenomenon is notably absent in CO oxidation, which is consistent with experimental observations of CO oxidations having much lower barriers and reaction temperatures than alkane oxidation. The coverage effect of surface hydroxyl groups on the catalytic pathways thus warrants further studies.
The experimental work on ethane ODH on Co3O4 nanorods38 has focused on ethylene/CO2 selectivity and ethylene yield as a function of surface modification by Si and Ge oxides. Detailed kinetic data such as reaction rates and apparent activation energy on the unmodified Co3O4 nanorods are still not available for a direct comparison. To compare with the experimental ethylene/CO2 selectivity, the complete pathway of ethane combustion has to be mapped out, which requires substantial and deeper investigation and is beyond the scope of the present work. A joint experimental and computational study is expected in the near future to directly compare the computational results and the experimental data.
The present DFT study focuses on the (111) surface based on the STEM images of our Co3O4 nanorod sample (Fig. 1), but other facets may also exist such as the (100) and (110) surfaces depending upon the preparation methods and calcination temperature. The different facets can affect the energetics of the elementary steps because the oxygen reactivity can be different. For example, the (110)-B surface of Co3O4 has a twofold-coordinate oxygen site, in contrast with the threefold-coordinate oxygen sites on the (111) surface. How this twofold-coordinate oxygen site on the (110)-B surface would change the energetics of ethane ODH steps is a question that we intend to find out in a future study.
4. Conclusions
We have studied the oxidative dehydrogenation (ODH) of ethane to ethylene on the Co3O4(111) surface with DFT+U, in order to understand the mechanism on Co3O4 nanorods. The more reactive lattice oxygen (OA) was found to yield the lowest barriers for the first C–H activation, consistent with our predictions based on vacancy formation energy and Bader charges. Overall, we found the barriers for the first C–H activation to be lower for the homolytic pathway (∼0.62 eV), but the barriers for the second C–H activation to be lower for the heterolytic pathway. The cleaved hydrogen from C2H6 forms hydroxyl groups on Co3O4(111), which can cluster via hydrogen diffusion. Water formation from nearby hydroxyl groups and desorption to leave oxygen vacancies on the surface were found to have a large activation energy (2.02 eV) and are likely to be the rate-determining step. These vacancies can readily react with oxygen molecules in gas phase to regenerate the lattice oxygen sites. These insights will help understand the role of the surface orientation of the Co3O4 nanocatalysts in improving the selectivity and yield of alkane-to-alkene conversion through ODH.Acknowledgements
This work was mainly supported by the Chemical Sciences, Geosciences and Biosciences Division, Office of Basic Energy Sciences, Office of Science, U.S. Department of Energy under Grant No. DE-SC0014561. This research used resources of the National Energy Research Scientific Computing Center, a DOE Office of Science User Facility supported by the Office of Science of the U.S. Department of Energy.References
- F. Cavani, N. Ballarini and A. Cericola, Catal. Today, 2007, 127, 113–131 CrossRef CAS.
- A. H. Tullo, Chem. Eng. News, 2001, 79, 18 Search PubMed.
- E. Heracleous, M. Machli, A. A. Lemonidou and I. A. Vasalos, J. Mol. Catal. A: Chem., 2005, 232, 29–39 CrossRef CAS.
- G.-L. Dai, Z.-P. Liu, W.-N. Wang, J. Lu and K.-N. Fan, J. Phys. Chem. C, 2008, 112, 3719–3725 CAS.
- H. Fu, Z.-P. Liu, Z.-H. Li, W.-N. Wang and K.-N. Fan, J. Am. Chem. Soc., 2006, 128, 11114–11123 CrossRef CAS PubMed.
- M. Lezanska, G. S. Szymanski, P. Pietrzyk, Z. Sojka and J. A. Lercher, J. Phys. Chem. C, 2007, 111, 1830–1839 CAS.
- E. Thorsteinson, T. Wilson, F. Young and P. Kasai, J. Catal., 1978, 52, 116–132 CrossRef CAS.
- P. Botella, E. Garcıa-González, A. Dejoz, J. L. Nieto, M. Vázquez and J. González-Calbet, J. Catal., 2004, 225, 428–438 CrossRef CAS.
- K. Chen, A. T. Bell and E. Iglesia, J. Catal., 2002, 209, 35–42 CrossRef CAS.
- E. Heracleous and A. Lemonidou, J. Catal., 2010, 270, 67–75 CrossRef CAS.
- X. Sun, B. Li and H. Metiu, J. Phys. Chem. C, 2013, 117, 23597–23608 CAS.
- C. A. Gartner, A. C. van Veen and J. A. Lercher, ChemCatChem, 2013, 5, 3196–3217 CrossRef.
- A. Qiao, V. N. Kalevaru, J. Radnik, A. Duvel, P. Heitjans, A. S. H. Kumar, P. S. S. Prasad, N. Lingaiah and A. Martin, Ind. Eng. Chem. Res., 2014, 53, 18711–18721 CrossRef CAS.
- C. A. Gartner, A. C. van Veen and J. A. Lercher, J. Am. Chem. Soc., 2014, 136, 12691–12701 CrossRef PubMed.
- H. H. Kristoffersen and H. Metiu, J. Phys. Chem. C, 2015, 119, 8681–8691 CAS.
- H. B. Zhu, D. C. Rosenfeld, D. H. Anjum, S. S. Sangaru, Y. Saih, S. Ould-Chikh and J. M. Basset, J. Catal., 2015, 329, 291–306 CrossRef CAS.
- X. Chen, Q. L. Yang, B. Z. Chu, H. An and Y. Cheng, RSC Adv., 2015, 5, 91295–91301 RSC.
- L. Smolakova, M. Kout, E. Koudelkova and L. Capek, Ind. Eng. Chem. Res., 2015, 54, 12730–12740 CrossRef CAS.
- D. E. Jiang and S. Dai, Phys. Chem. Chem. Phys., 2011, 13, 978–984 RSC.
- F. F. Tao, J. J. Shan, L. Nguyen, Z. Wang, S. Zhang, L. Zhang, Z. Wu, W. Huang, S. Zeng and P. Hu, Nat. Commun., 2015, 6, 7798 CrossRef CAS PubMed.
- E. C. Tyo, C. Yin, M. Di Vece, Q. Qian, G. Kwon, S. Lee, B. Lee, J. E. DeBartolo, S. Seifert, R. E. Winans, R. Si, B. Ricks, S. Goergen, M. Rutter, B. Zugic, M. Flytzani-Stephanopoulos, Z. W. Wang, R. E. Palmer, M. Neurock and S. Vajda, ACS Catal., 2012, 2, 2409–2423 CrossRef CAS.
- S. Zhang, J.-J. Shan, Y. Zhu, A. I. Frenkel, A. Patlolla, W. Huang, S. J. Yoon, L. Wang, H. Yoshida, S. Takeda and F. Tao, J. Am. Chem. Soc., 2013, 135, 8283–8293 CrossRef CAS PubMed.
- X. W. Xie, Y. Li, Z. Q. Liu, M. Haruta and W. J. Shen, Nature, 2009, 458, 746–749 CrossRef CAS PubMed.
- X. Liu, G. Qiu and X. Li, Nanotechnology, 2005, 16, 3035 CrossRef CAS.
- F. Zasada, J. Gryboś, P. Indyka, W. Piskorz, J. Kaczmarczyk and Z. Sojka, J. Phys. Chem. C, 2014, 118, 19085–19097 CAS.
- W. Meyer, K. Biedermann, M. Gubo, L. Hammer and K. Heinz, J. Phys.: Condens. Matter, 2008, 20, 265011 CrossRef CAS PubMed.
- J. Chen and A. Selloni, Phys. Rev. B: Condens. Matter Mater. Phys., 2012, 85, 085306 CrossRef.
- X.-L. Xu, Z.-H. Chen, Y. Li, W.-K. Chen and J.-Q. Li, Surf. Sci., 2009, 603, 653–658 CrossRef CAS.
- P. Ferstl, S. Mehl, M. A. Arman, M. Schuler, A. Toghan, B. Laszlo, Y. Lykhach, O. Brummel, E. Lundgren, J. Knudsen, L. Hammer, M. A. Schneider and J. Libuda, J. Phys. Chem. C, 2015, 119, 16688–16699 CAS.
- Y. Li, B. Tan and Y. Wu, J. Am. Chem. Soc., 2006, 128, 14258–14259 CrossRef CAS PubMed.
- F. Zasada, W. Piskorz, J. Janas, J. Gryboś, P. Indyka and Z. Sojka, ACS Catal., 2015, 5, 6879–6892 CrossRef CAS.
- K. Biedermann, M. Gubo, L. Hammer and K. Heinz, J. Phys.: Condens. Matter, 2009, 21, 185003 CrossRef CAS PubMed.
- C. Doornkamp and V. Ponec, J. Mol. Catal. A: Chem., 2000, 162, 19–32 CrossRef CAS.
- P. Broqvist, J. Catal., 2002, 210, 198–206 CrossRef CAS.
- X. Y. Pang, C. Liu, D. C. Li, C. Q. Lv and G. C. Wang, ChemPhysChem, 2013, 14, 204–212 CrossRef CAS PubMed.
- X.-L. Xu, E. Yang, J.-Q. Li, Y. Li and W.-K. Chen, ChemCatChem, 2009, 1, 384–392 CrossRef CAS.
- R. Pestman, R. Koster, J. Pieterse and V. Ponec, J. Catal., 1997, 168, 255–264 CrossRef CAS.
- J. Liu, S. Zhang, Y. Zhou, V. Fung, L. Nguyen, D. E. Jiang, W. Shen, J. Fan and F. F. Tao, ACS Catal. DOI:10.1021/acscatal.5b02900.
- X. W. Xie, P. J. Shang, Z. Q. Liu, Y. G. Lv, Y. Li and W. J. Shen, J. Phys. Chem. C, 2010, 114, 2116–2123 CAS.
- G. Kresse and J. Furthmuller, Comput. Mater. Sci., 1996, 6, 15–50 CrossRef CAS.
- G. Kresse and J. Furthmuller, Phys. Rev. B: Condens. Matter Mater. Phys., 1996, 54, 11169–11186 CrossRef CAS.
- S. Dudarev, G. Botton, S. Savrasov, C. Humphreys and A. Sutton, Phys. Rev. B, 1998, 57, 1505 CrossRef CAS.
- J. P. Perdew, K. Burke and M. Ernzerhof, Phys. Rev. Lett., 1996, 77, 3865 CrossRef CAS PubMed.
- G. Kresse and D. Joubert, Phys. Rev. B: Condens. Matter Mater. Phys., 1999, 59, 1758 CrossRef CAS.
- P. E. Blöchl, Phys. Rev. B: Condens. Matter Mater. Phys., 1994, 50, 17953–17979 CrossRef.
- H. J. Monkhorst and J. D. Pack, Phys. Rev. B: Solid State, 1976, 13, 5188 CrossRef.
- P. Dutta, M. S. Seehra, S. Thota and J. Kumar, J. Phys.: Condens. Matter, 2008, 20, 015218 CrossRef.
- G. Henkelman and H. Jónsson, J. Chem. Phys., 1999, 111, 7010 CrossRef CAS.
- http://theory.cm.utexas.edu/vtsttools/ .
- L. Hu, Q. Peng and Y. Li, J. Am. Chem. Soc., 2008, 130, 16136–16137 CrossRef CAS PubMed.
- G. Martin and C. Mirodatos, Fuel Process. Technol., 1995, 42, 179–215 CrossRef CAS.
- G. Fu, X. Xu, X. Lu and H. Wan, J. Am. Chem. Soc., 2005, 127, 3989–3996 CrossRef CAS PubMed.
- M. C. Holthausen and W. Koch, J. Am. Chem. Soc., 1996, 118, 9932–9940 CrossRef CAS.
- Z. Tian, N. Bahlawane, F. Qi and K. Kohse-Höinghaus, Catal. Commun., 2009, 11, 118–122 CrossRef CAS.
- M. D. Argyle, K. Chen, A. T. Bell and E. Iglesia, J. Phys. Chem. B, 2002, 106, 5421–5427 CrossRef CAS.
- G. B. Hoflund and Z. Li, Appl. Surf. Sci., 2006, 253, 2830–2834 CrossRef CAS.
- M. D. Argyle, K. Chen, A. T. Bell and E. Iglesia, J. Catal., 2002, 208, 139–149 CrossRef CAS.
- K. Chen, A. T. Bell and E. Iglesia, J. Phys. Chem. B, 2000, 104, 1292–1299 CrossRef CAS.
- B. Kilos, A. T. Bell and E. Iglesia, J. Phys. Chem. C, 2009, 113, 2830–2836 CAS.
- Y. Yu, T. Takei, H. Ohashi, H. He, X. Zhang and M. Haruta, J. Catal., 2009, 267, 121–128 CrossRef CAS.
- F. Grillo, M. M. Natile and A. Glisenti, Appl. Catal., B, 2004, 48, 267–274 CrossRef CAS.
| This journal is © The Royal Society of Chemistry 2016 |