In situ fabrication of AgI/AgVO3 nanoribbon composites with enhanced visible photocatalytic activity for redox reactions†
Xiaohan
Wang
a,
Juan
Yang
*a,
Shuqi
Ma
a,
Dan
Zhao
a,
Jun
Dai
b and
Dafeng
Zhang
a
aInstitute of Applied Chemistry, Henan Polytechnic University, Jiaozuo, 454003, PR China. E-mail: yangjuanhpu@yahoo.com; Fax: +86 391 3987811; Tel: +86 391 3987818
bState Key Laboratory Cultivation Base for Gas Geology and Gas Control, School of Safety Science and Engineering, Henan Polytechnic University, Jiaozuo, 454003, PR China
First published on 7th August 2015
Abstract
AgI/AgVO3 nanocomposites have been newly synthesized through a facile in situ ion-exchange approach with β-AgVO3 nanoribbons as the Ag source and support to immobilize AgI. The as-prepared composites can serve as highly efficient visible light-driven photocatalysts toward selective oxidation of benzylic amine to imine and reduction of toxic Cr(VI) ions. It is found that the mole ratios of AgI have an essential effect on the photocatalytic redox activity and the highest photocatalytic performance is obtained over the 20% AgI/AgVO3 nanocomposite. AgI in situ grown on the surface of β-AgVO3 nanoribbons facilitates close interfacial contact, which thus improves the separation of photoinduced electron–hole pairs. On the basis of detailed characterization of a typical 20% AgI/AgVO3 sample before and after photocatalytic reactions, Ag0 species is formed in the initial stage of the reactions. The considerable improvement in the photocatalytic redox properties of AgI/AgVO3 is mainly ascribed to the efficient separation of photoinduced electrons/holes via a Z-scheme bridge mechanism of formed Ag/AgI/AgVO3, in which Ag nanoparticles serve as the charge migration bridge.
1. Introduction
Trapping and conversion of solar energy over semiconductors and the resulting heterogeneous photocatalysis have attracted ever-increasing attention due to their potential as one of most promising and green methods to solve the present energy and environmental problems.1–3 Among various semiconductor-based photocatalysts, TiO2 has been proven to be a superior candidate, especially for the photocatalytic degradation of contaminants and splitting of water to H2, because of its excellent reactivity and stability.4–6 However, TiO2 shows limited quantum yields due to low separation efficiency of photoinduced electrons/holes and lacks visible-light response because of its large band gap of 3.2 eV. Hence, studies on the construction of high-efficiency photocatalysts with visible-light response are becoming the focal issues in the field of photocatalysis.In recent years, Ag-based compounds, such as Ag3PO4,7–9 AgX (X = Cl or Br),10,11 and Ag2CO3,12,13 have been recognized as novel visible light-driven photocatalysts for photocatalytic degradation of pollutants or splitting of water to O2. However, there are several intrinsic factors which restrict their practical applications under visible-light irradiation. For example, the above-mentioned Ag-based materials are usually unstable and the unavoidable decomposition generally gives rise to the formation of Ag particles on the surface of the photocatalysts during the photocatalytic process. Besides, the more positive conduction band potential of these Ag-based photocatalysts restricts their utilization in photocatalytic reduction reactions. As a result, further research studies are necessary to improve the activity and stability of Ag-based photocatalysts.
Among these Ag-based compounds, β-AgVO3 has recently gained widespread attention because of its excellent properties in rechargeable lithium batteries, bacterial inactivation and H2S sensors.14–16 Additionally, the unique hybridization of the valence bands of V 3d, O 2p and Ag 4d orbitals in AgVO3 gives rise to a narrow band gap and a highly dispersed valence band, which contribute to its purpose as a visible light-driven photocatalyst.17–19 Meanwhile, β-AgVO3 shows relatively high stability under photo or chemical corrosion than other Ag-based materials. However, the photocatalytic performance of β-AgVO3 is limited, which might be attributed to the low separation efficiency of photogenerated charge carriers. Thus, studies on improving the separation of photoinduced electrons/holes are extremely important to promote the photocatalytic activity of β-AgVO3. Generally, the fabrication of a photocatalyst with specific morphology is considered as one of the most effective methods to improve the catalytic performance. Among the different architectures of silver vanadate, one-dimensional nanoribbons have gained considerable interest in the photocatalytic field because of their large aspect ratio and the resulting effective charge separation.15,18,19
Furthermore, the photocatalytic activity of a catalyst greatly depends on the separation efficiency of photogenerated charge carriers. Construction of heterostructures or nanocomposites with other materials having an appropriate energy band is proven to be an effective method to improve the separation of photoinduced electron–hole pairs and the photocatalytic properties of β-AgVO3. Very recently, Geng et al. demonstrated that AgVO3@AgBr@Ag nanobelt heterostructures displayed superior photocatalytic performance over bare β-AgVO3 for removing organic dye Rhodamine B (RhB) under irradiation of visible light.20 Liao and co-workers reported that the obtained one-dimensional Ag/AgVO3 photocatalysts showed high activity for photocatalytic degradation of dye pollutants basic fuchsin (BF) and crystal violet (CV).21,22 Additionally, BiVO4@β-AgVO3 nanocomposites were synthesized through an in situ growth process, which exhibited enhanced photocatalytic properties compared to single AgVO3 and BiVO4.23 However, photocatalytic research studies on AgVO3-based composites have primarily focused on traditional “non-selective” photocatalytic oxidative degradation. To the best of our knowledge, application of AgVO3 hybrid materials as visible light-driven photocatalysts for selective photocatalytic oxidation remains underreported so far. In particular, compared to photocatalytic oxidation processes, photocatalytic reduction reactions are less studied over AgVO3-based composites, due to their positive conduction band potential and the resulting weak reductive properties.
In this study, to enhance the photocatalytic redox properties of β-AgVO3, AgI having matched energy band levels is selected as a suitable component to couple with AgVO3. AgI/AgVO3 composites with different mole ratios are newly synthesized through an in situ ion-exchange approach, utilizing β-AgVO3 nanoribbons as the Ag source. A facile in situ growth strategy can effectively restrain the aggregation of AgI and facilitate the formation of close interfacial contact between AgI and β-AgVO3. The as-prepared AgI/AgVO3 nanoribbon composites exhibit much higher photocatalytic redox activity than single AgI or AgVO3 toward selective oxidation of benzylamine to imine and reduction of toxic Cr(VI) ions under visible light illumination. The considerable improvement in the photocatalytic redox properties of AgI/AgVO3 is mainly ascribed to the efficient separation of photoinduced electrons/holes and the more negative conduction band potential of coupled AgI. Based on the characterization of the catalysts before and after photocatalytic reactions and the formation of superoxide radicals, a possible photocatalytic mechanism of highly improved redox activity over AgI/AgVO3 nanoribbon composites is also elucidated.
2. Experimental
2.1 Preparation of AgI/AgVO3 nanoribbon composites
In a typical process, 0.117 g of ammonium vanadate was dissolved in 60 mL of deionized water under stirring to obtain a transparent solution. Then, 0.167 g of silver nitrate was added to the above solution and stirred for 5 min. The pH value of the solution was adjusted to 8–8.2 by using NH3·H2O (25–28%) and the mixture was transferred into a 100 mL autoclave with a PTFE container inside, which was maintained at a hydrothermal temperature of 180 °C for 12 h. The precipitate was collected after filtering, washed with deionized water and dried at 70 °C for 10 h to obtain AgVO3 nanoribbons.AgI/AgVO3 nanoribbon composites were synthesized via a facile in situ ion-exchange approach. 0.5 g of AgVO3 was added to 100 mL of deionized water, which was sonicated for 30 min. A certain amount of potassium iodide was dissolved in 30 mL of deionized water to prepare aqueous KI solution. The obtained KI solution was dropped into the above AgVO3 suspension, which was then stirred for 5 h at room temperature. After this, the final precipitates were recovered, washed with water, and dried at 60 °C for 12 h. According to the method, different AgI/AgVO3 nanoribbon composites with I/V molar ratios of 5%, 10%, 20%, 30% and 40% were prepared and denoted as 5% AgI/AgVO3, 10% AgI/AgVO3, 20% AgI/AgVO3, 30% AgI/AgVO3 and 40% AgI/AgVO3, respectively. For comparison, bare AgI was prepared by mixing KI solution with AgNO3 solution in NH3·H2O.24
2.2 Catalyst characterization
The crystalline structures of the samples were identified by using a D8 Advance X-ray diffractometer (Bruker) with Cu Kα radiation (λ = 0.15405 nm) in the range of 5–80° (2θ). The images of the micro-morphology were observed by scanning electron microscopy (SEM, Hitachi, S4800). Energy-dispersive X-ray (EDX) spectroscopy coupled with SEM was used to measure the chemical composition of the samples. The BET surface area of the AgI/AgVO3 composites was recorded by using an Autosorb iQ surface area analyzer and ASiQwin software. XPS measurements were performed on a Thermo Scientific ESCALAB 250Xi system with a Mg Kα source. All the binding energies were calibrated with the C1s peak of surface adventitious carbon at 284.8 eV. Ultraviolet-visible diffuse reflectance spectra (UV-vis DRS) were recorded using a UV-vis spectrophotometer (UV-2550, Shimadzu, Japan) using BaSO4 as the reflectance standard. The photoluminescence spectra (PL) of the catalysts were recorded using a PerkinElmer LS55 fluorescence spectrophotometer with a 400 nm excitation wavelength. The electron spin resonance (ESR) signals of the radicals spin-trapped with 5,5-dimethyl-1-pyrroline-N-oxide (DMPO) were recorded on a Bruker ER200-SRC spectrometer at ambient temperature using the following settings: 20 mW microwave power, 100 G scan range and 1 G field modulation. Photoinduced current density measurements were carried out in a three-electrode system and the working electrode was prepared according to the previous report.25 A platinum foil and a saturated calomel electrode served as the counter electrode and the reference electrode. The measurements were performed on a CHI electrochemical workstation (CHI 760D, Shanghai, China) and the electrolyte was 0.5 mol L−1 aqueous Na2SO4 solution (pH ~6.8).2.3 Photocatalytic activities
The light source for the photocatalytic reactions was a 300 W Xe lamp (PLS-SXE 300, Beijing Perfect Light Co., Ltd.) with a 400 nm cutoff filter. Photocatalytic selective oxidation of benzylamine was carried out in a 25 mL round-bottomed Pyrex glass flask equipped with a sealed spigot. Typically, benzylamine (0.25 mmol) and the catalyst (50 mg) were dispersed in acetonitrile (10 mL). Prior to irradiation, the mixture was stirred for 0.5 h in the dark to ensure the formation of a homogeneous suspension. After the reaction, about 1.5 mL of the mixture was collected and filtered by using a Millipore filter (pore size 0.45 μm) to completely remove the catalyst particles. The remaining filtrate was quantitatively analyzed on an Agilent 7890 gas chromatograph (GC) equipped with a standard FID and a DM-5 Amine capillary column (30 m × 0.5 mm × 0.25 mm, Dikma) using highly pure N2 as the carrier gas. The standard analytical conditions are as follows: injector temperature 230 °C, FID temperature 300 °C, column temperature program: 40 °C (hold for 6 min) to 280 °C (hold for 4 min) at 25 °C min−1. Benzylamine and the derivatives were determined by comparison of their retention times with those of the authentic samples. The structures of the products were confirmed by comparison of the retention times with those of standard samples and further substantiated by gas chromatography-mass spectrometry (GC-MS). GC-MS (Thermo-Finingan Trace 2000/Trace DSQ) analyses were carried out with a GsBP-5MS capillary column (30 m × 0.25 mm × 0.25 μm, Dikma) and highly pure He as the carrier gas with the same temperature program as that of GC.Control photoactivity experiments using different radical scavengers (triethanolamine26,27 as the scavenger for photogenerated holes, tetrachloromethane28 as the scavenger for electrons and benzoquinone29 as the scavenger for superoxide radical species) were carried out through a process similar to the above photocatalytic oxidation of benzylamine except that radical scavengers (0.2 mmol) were added to the reaction system.
As to the photocatalytic reduction of Cr(VI), 50 mg of the photocatalyst was dispersed in 50 mL of Cr(VI) solution (20 mg L−1), based on Cr in dilute K2Cr2O7 solution. The obtained suspension was stirred in the dark for 30 min to ensure adsorption–desorption equilibrium before irradiation with the 300 W Xe lamp. During the photocatalytic reduction of Cr(VI), 3 mL of the reaction solution was taken out at a certain interval and centrifuged to remove the catalyst particles. The residual amount of Cr(VI) in the solution was analyzed on the basis of its characteristic optical absorption at ca. 371 nm using a Cary 100 UV-vis spectrophotometer (Varian Co.) to measure the change of Cr(VI) concentration with irradiation time based on Lambert–Beer's law. The percentage of Cr(VI) removal is indicated as (C0 − C)/C0. Here, C is the characteristic absorption of Cr(VI) solution at each irradiation time interval and C0 is the absorption of the initial solution prior to irradiation.
3. Results and discussion
3.1 Catalyst characterization
Fig. 1 displays the XRD patterns of the as-prepared β-AgVO3 nanoribbons, AgI and AgI/AgVO3 composites with different amounts of AgI. The diffraction peaks of the pure β-AgVO3 sample (Fig. 1a) match well with those of the standard monoclinic phase (JCPDS 29-1154).20–23 The XRD pattern of the prepared AgI (Fig. 1g) coincides with that of the hexagonal β-AgI phase (JCPDS 85-0801).30,31 It can be clearly observed (Fig. 1b–f) that all the AgI/AgVO3 composites display a co-occurrence of both AgI and AgVO3 phases. For the as-prepared composites, the diffraction peak intensity of AgI becomes stronger with increasing AgI amounts. Additionally, the diffraction peak positions of β-AgVO3 do not shift, which suggests that compounding of AgI does not influence the crystal structure of β-AgVO3.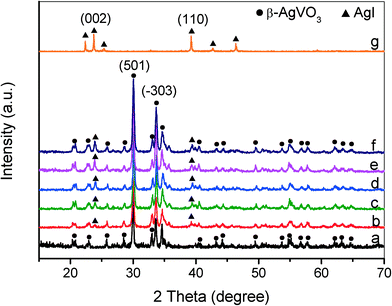 | ||
| Fig. 1 XRD patterns of β-AgVO3 nanoribbons (a), 5% AgI/AgVO3 (b), 10% AgI/AgVO3 (c), 20% AgI/AgVO3 (d), 30% AgI/AgVO3 (e), 40% AgI/AgVO3 (f) and AgI (g). | ||
The morphologies of the as-prepared bare β-AgVO3 and AgI/AgVO3 composites are characterized by using SEM and the images are given in Fig. 2. It is observed from Fig. 2a that bare β-AgVO3 consists of ultralong nanoribbons with a length of several tens of micrometers. Through in situ ion-exchange between AgVO3 and KI, small AgI nanoparticles (the bright spots in Fig. 2b–f) are anchored on the surface of the β-AgVO3 nanoribbons, whereas the ribbon-like morphology of bare AgVO3 remains unvaried for the AgI/AgVO3 composites as-obtained via ion-exchange reactions. Furthermore, it can be found that the distribution and size of AgI particles greatly depend on the mole ratios of KI to AgVO3. When the ratio of KI to AgVO3 is 5%, several AgI nanoparticles (about 60 nm, Fig. 2b) are formed on the surface of the AgVO3 nanoribbons. With an increase in the mole ratio of KI/AgVO3, more AgI particles are observed on the nanoribbons and the size of AgI becomes larger. As the mole ratio of KI/AgVO3 increases up to 40%, the formed AgI has a size of about 200–400 nm (Fig. 2f). The amount and size of in situ formed AgI nanoparticles on the β-AgVO3 nanoribbons increase with the molar ratio of KI to AgVO3, which coincides with the XRD results in Fig. 1. Besides, blank AgI prepared by mixing KI with AgNO3 solution in NH3·H2O (ref. 24) displays irregular particles (about 200–500 nm) and their aggregates (2–3 μm) (Fig. S1, ESI†). Hence, the in situ ion-exchange method can inhibit the aggregation of AgI and promote the formation of homogeneous nanoparticles.
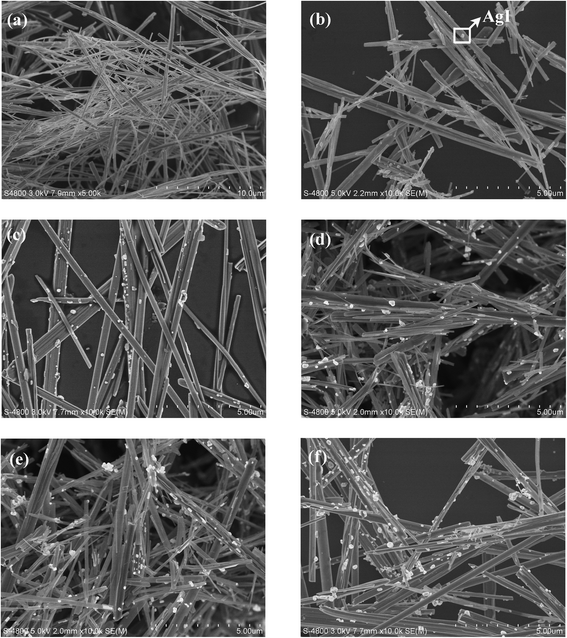 | ||
| Fig. 2 SEM images of β-AgVO3 nanoribbons (a), 5% AgI/AgVO3 (b), 10% AgI/AgVO3 (c), 20% AgI/AgVO3 (d), 30% AgI/AgVO3 (e) and 40% AgI/AgVO3 (f). | ||
The structure of the 20% AgI/AgVO3 composite is further investigated by TEM and HRTEM. Fig. 3a indicates that some nanoparticles are deposited on the surface of the β-AgVO3 nanoribbons. The HRTEM image of the magnified view of the red-square area is given in Fig. 3b. As can be seen, two sets of different lattice fringes can be observed. The lattice fringe of 0.777 nm corresponds to the (−101) crystal plane of β-AgVO3,23 whereas the lattice fringe of 0.273 nm matches well with the (102) plane of β-AgI.32 These results further confirm the formation of AgI/AgVO3 heterostructures, thereby improving the charge transfer between them.
 | ||
| Fig. 3 (a) TEM image of the 20% AgI/AgVO3 composite and (b) HRTEM image of the designated square area in panel (a). | ||
The composition and surface area of the samples are also measured and summarized in Table 1. The pristine AgVO3 sample consists of Ag, V and O elements and the Ag/V atomic ratio is 1.0 on the basis of EDX analysis (Fig. S2, ESI†). Supported AgI particles can be obtained via anion exchange between AgVO3 and KI. The as-prepared AgI/AgVO3 composites contain Ag, V, O and I elements (Fig. S2, ESI†) and the atomic content of I increases with increasing KI concentration in the preparation process. This is in agreement with the XRD results and SEM images. Furthermore, based on the EDX results in Table 1, it can be concluded that the atomic ratio of Ag to the sum of V and I is approximately 1.0, suggesting than no Ag0 particles exist in the AgI/AgVO3 composites. Additionally, as indicated in Table 1, the specific BET areas of β-AgVO3 and AgI are limited and the effect of coupling with different quantities of AgI is inconspicuous.
| Catalyst | Atomic content (at%) | S BET (m2 g−1) | |||
|---|---|---|---|---|---|
| Ag | V | I | O | ||
| β-AgVO3 | 16.88 | 16.84 | 0 | 66.28 | 3.096 |
| 5% AgI/AgVO3 | 14.71 | 14.38 | 0.30 | 70.61 | 3.870 |
| 10% AgI/AgVO3 | 15.36 | 14.59 | 0.65 | 69.40 | 4.682 |
| 20% AgI/AgVO3 | 15.74 | 14.42 | 1.29 | 68.55 | 5.618 |
| 30% AgI/AgVO3 | 16.97 | 14.73 | 2.34 | 65.96 | 7.023 |
| 40% AgI/AgVO3 | 18.50 | 14.88 | 3.41 | 63.21 | 6.309 |
| AgI | 50.16 | 0 | 49.84 | 0 | 1.518 |
To investigate the optical absorption properties, UV-vis DRS of the AgI/AgVO3 samples, together with that of pure β-AgVO3 and AgI, are depicted in Fig. 4A. As indicated from Fig. 4A, AgI has a clear absorption edge at around 460 nm, whereas β-AgVO3 has a broader absorption band in the visible region with an absorption edge at about 610 nm. One thing to be noted is that the absorbance intensity displays a moderate enhancement with the increase of AgI content in the AgI/AgVO3 composites. The band gap of a semiconductor could be obtained according to the formula: αhν = A(hν − Eg)n/2, where α, hν, A and Eg are the absorption coefficient, photoenergy, a constant and the band gap, respectively. Among them, the value of n is dependent on the type of semiconductor. As AgI and β-AgVO3 are direct transition semiconductors,23,31 the value of n is 1. Based on the curves of (αhν)2versus hν indicated in Fig. 4B, the band gap Eg of AgI and β-AgVO3 has been deduced to be 2.76 eV and 2.15 eV, respectively. Moreover, the band structure of the as-prepared samples can be determined from the following formula: EVB = χ − Ee + 0.5Eg, in which EVB is the potential of the valence band edge, χ is the electronegativity of a semiconductor, and Ee is the energy of free electrons on the hydrogen scale with a value of about 4.5 eV. The χ values of β-AgVO3 and AgI are 5.88 and 5.48 eV. According to the above empirical equation, the EVB values of β-AgVO3 and AgI are estimated to be 2.46 and 2.36 eV vs. NHE. Based on the equation ECB = EVB − Eg, the corresponding ECB values are also calculated to be 0.31 and −0.40 eV, respectively.
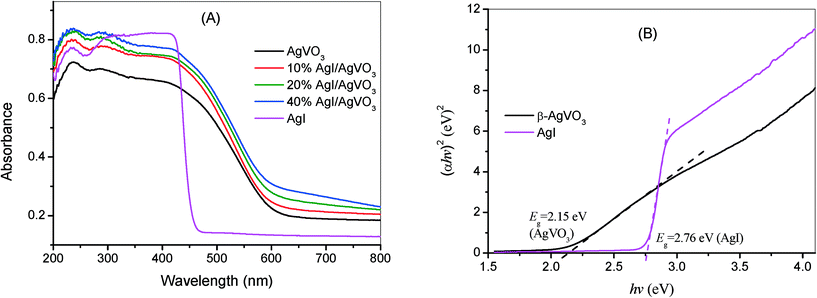 | ||
| Fig. 4 (A) UV-vis DRS of β-AgVO3 nanoribbons, 10% AgI/AgVO3, 20% AgI/AgVO3, 40% AgI/AgVO3 and AgI. (B) Plots of (αhν)2versus hν of pure β-AgVO3 and AgI. | ||
3.2 Photocatalytic redox activity of AgI/AgVO3 composites
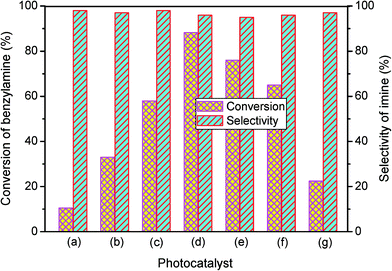
The photocatalytic performance of the as-obtained samples for the selective oxidation of benzylamine is depicted in Fig. 5. No reactant is converted in the absence of visible light illumination or photocatalysts, confirming that the oxidation of benzylamine proceeded through a photocatalytic mechanism. As indicated in Fig. 5, although pure β-AgVO3 or AgI can oxidize benzylamine to the target product imine, the conversion rate is low. β-AgVO3 and AgI exhibit limited conversion yields of 10.5% and 22.4% after 12 h of visible light illumination, respectively. In contrast, the AgI/AgVO3 composites prepared via an in situ growth approach possess significantly enhanced photocatalytic activities and the as-obtained photocatalysts display good selectivity (>95%) for the oxidation of benzylamine to the product imine. More importantly, it is found that the quantity of AgI plays a vital role in the oxidation properties of the as-prepared nanocomposites. The conversion rate of the reactant benzylamine increases gradually from bare β-AgVO3, 5% AgI/AgVO3, 10% AgI/AgVO3 to 20% AgI/AgVO3. However, as the amount of supported AgI on the β-AgVO3 nanoribbons increases further, the conversion rate of benzylamine declines, suggesting that excessive AgI is unfavorable for photocatalytic selective oxidation. The possible reason is that a high content of AgI particles with larger size might interfere with the light absorption of active sites. Therefore, the 20% AgI/AgVO3 sample exhibits the highest activity for benzylamine oxidation and gives a conversion rate of 88.2% after 12 h of irradiation with visible light.To expand the utilization range of as-prepared AgI/AgVO3, the photocatalytic oxidation of various substituted benzylamines with the optimal 20% AgI/AgVO3 sample was carried out and the results are summarized in Table 2. The structures of the products were confirmed by comparison of their retention times with those of standard samples and GC-MS analysis (Fig. S3, ESI†). The selective oxidation of benzylamines proceeded smoothly and formed the corresponding imines with high product selectivities for all the derivatives. For example, methyl o-, m- and p-substituted benzylamines can be selectively converted to the desired products with similar conversions and selectivities. Additionally, it can be found that the electronic effects associated with electron-donating groups (CH3– and CH3O–) and electron-withdrawing groups (F– and Cl–) on benzene rings have a slight influence on the product selectivity and conversion rate. The results demonstrate that the catalytic oxidation of benzylamine is insensitive to the type of substituent and thus has great tolerance for functional groups.
| Entry | Reactant | Product | Time (h) | Conv. (%) | Sel. (%) |
|---|---|---|---|---|---|
| a Reaction conditions: 20% AgI/AgVO3 (50 mg), benzylamine (0.25 mmol), acetonitrile (10 mL), in air. | |||||
| 1 |

|

|
12 | 88.2 | 96 |
| 2 |

|

|
10 | 86.5 | 97 |
| 3 |

|

|
10 | 77.3 | 96 |
| 4 |

|

|
10 | 85.0 | 95 |
| 5 |

|

|
7.5 | 91.8 | 95 |
| 6 |

|

|
13.5 | 87.0 | 94 |
| 7 |

|

|
12 | 85.6 | 93 |
Additionally, to further study the photocatalytic mechanism of benzylamine oxidation, various control experiments by choosing the reaction atmosphere or adding radical scavengers were conducted and the results are given in Fig. 6. Firstly, the elimination of air by bubbling with argon (Ar) results in a low conversion of benzylamine, suggesting that dioxygen plays an important role in the photocatalytic oxidation of benzylamine. Meanwhile, the conversion of benzylamine in O2 is 92.7%, which just slightly increases compared to that in air (88.2%), indicating that molecular oxygen in air is adequate for the selective oxidation of benzylamine over the 20% AgI/AgVO3 nanocomposite. When triethanolamine (TEA), a radical scavenger for holes, is added to the reaction system, the conversion of benzylamine decreases dramatically, implying that photoinduced holes (h+) are the primary reactive species for the photocatalytic conversion of benzylamine. The addition of tetrachloromethane (CCl4) for trapping electrons or benzoquinone (BQ) for superoxide radicals (O2˙−) leads to a moderate decrease in the conversion of the reactant (Fig. 6). Although photoinduced electrons cannot directly take part in the oxidation process, they have the ability to activate molecular oxygen and form O2˙− radicals, which then participate in the selective conversion of benzylamine. These experimental results indicate explicitly that the photocatalytic oxidation of benzylamine with the AgI/AgVO3 catalyst mainly occurs through the synergistic effect of photo-holes, electrons and O2˙−.
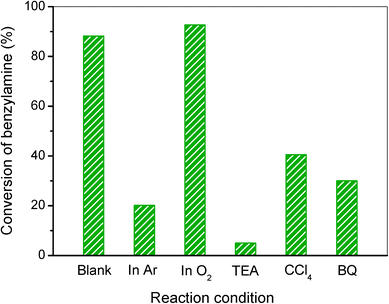 | ||
| Fig. 6 Control experiments using different radical scavengers or reaction atmospheres for the selective conversion of benzylamine to imine over the 20% AgI/AgVO3 photocatalyst. | ||
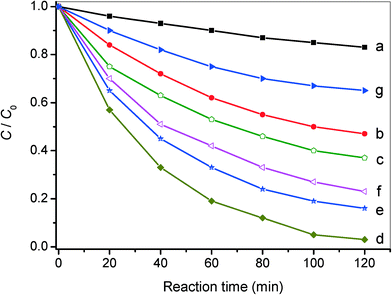
Except for the excellent photocatalytic performance toward the selective oxidation of benzylamine, the nanocomposites of AgI/AgVO3 also display improved photo-activity for reduction of toxic Cr(VI) in water, which is considered as an effective method to retard Cr(VI) pollution. Fig. 7 presents the results of photocatalytic Cr(VI) reduction over different AgI/AgVO3 nanocomposites, together with pure β-AgVO3 and AgI. In the absence of photocatalysts, no obvious change in Cr(VI) concentration is observed. As displayed in Fig. 7, the AgI/AgVO3 nanocomposites exhibit significantly improved photo-reduction activity in comparison with pure β-AgVO3 and bare AgI under visible light illumination for 120 min. Analogous to the results of selective benzylamine oxidation, the loading content of AgI in the as-obtained AgI/AgVO3 nanoribbons has an essential effect on the photo-activity for Cr(VI) reduction. Among these composites, the 20% AgI/AgVO3 sample displays the highest photo-reduction activity and gives rise to a removal rate of 96.5% after 120 min of visible light irradiation. The low photo-activity over the β-AgVO3 nanoribbons could be attributed to their positive conduction band potential and weak reductive properties. The bare AgI sample also shows low photo-reduction ability toward removal of Cr(VI), which might be ascribed to the inhomogenous size and obvious aggregation of AgI particles (Fig. S1, ESI†).
Additionally, a control experiment involving the addition of K2S2O8 (a trapping agent for photoinduced electrons, 0.1 mmol)33 to the present system is carried out and the corresponding result is presented in Fig. S4, ESI.† It can be clearly seen that photocatalytic Cr(VI) reduction over the typical 20% AgI/AgVO3 catalyst hardly occurs, which demonstrates that the photo-reduction of Cr(VI) is driven by photoinduced electrons under visible light illumination. The results of the redox reactions indicate that the AgI/AgVO3 nanocomposites prepared via an in situ growth approach can serve as potential visible light-driven photocatalysts. The 20% AgI/AgVO3 sample, which exhibits the optimal photo-activity toward selective oxidation of benzylamine and reduction of Cr(VI) ions, is selected for the following mechanism study.
3.3 Improved photocatalytic mechanism of AgI/AgVO3 nanocomposites
The results of the control experiments involving the addition of different trapping agents, shown in Fig. 6 and S4,† indicate that the selective oxidation of benzylamine is driven by photogenerated holes and the photo-reduction of toxic Cr(VI) is induced by photogenerated electrons over the as-prepared AgI/AgVO3 nanocomposites under visible light. The remarkably enhanced photocatalytic performance of the AgI/AgVO3 samples, compared with those of bare AgVO3 and AgI, could be ascribed to the efficient separation of photogenerated charge carriers via the formation of ribbon-like heterostructures between β-AgVO3 and AgI. In general, photoluminescence emission spectroscopy (PL) is considered as an effective technology to investigate the transfer and fate of photoinduced carriers.33,34 The higher PL intensity represents the lower separation capacity of photoinduced charge carriers and the lower photocatalytic activity in semiconductor-based systems. Fig. 8A depicts the PL spectra of β-AgVO3, 20% AgI/AgVO3 and AgI with an excitation wavelength of 400 nm. It can be observed that pure β-AgVO3 exhibits a strong emission peak at about 480 nm and a shoulder peak around 580 nm. The high intensity of the AgVO3 emission spectrum suggests that the electrons and holes over the β-AgVO3 nanoribbons can facilely recombine. Meanwhile, the emission spectrum of bare AgI also displays a relatively high intensity and is centered at 470 nm, corresponding to the intrinsic luminescence of AgI.30 However, for the 20% AgI/AgVO3 sample, the relatively low PL intensity implies that the photogenerated electrons and holes can migrate effectively between AgVO3 and AgI and thus inhibit the recombination of charge carriers.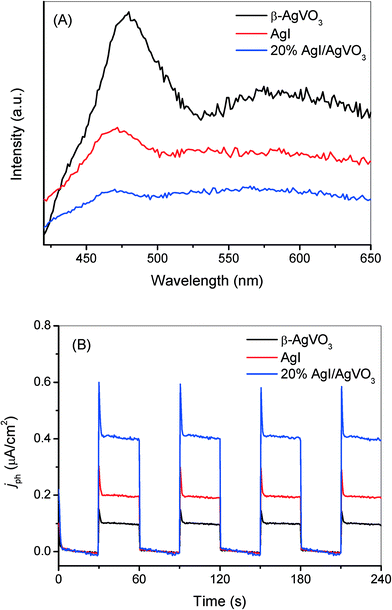 | ||
| Fig. 8 (A) Photoluminescence spectra with an excitation wavelength at 400 nm and (B) transient photocurrent response of bare β-AgVO3, 20% AgI/AgVO3 nanocomposite and pure AgI. | ||
Transient photocurrent measurements were also performed to evaluate the separation capacity of photoinduced carriers and the results are presented in Fig. 8B. The AgI/AgVO3 composites exhibit dramatically improved photocurrent responses in comparison with blank AgVO3 and AgI. As shown in Fig. 8B, the 20% AgI/AgVO3 sample shows a significantly improved photocurrent density of 0.41 μA cm−2, which is about 4 times that for β-AgVO3 and 2 times that for AgI. The results of the transient photocurrent measurements coincide with those of PL spectroscopy, which indicate more effective separation and migration of photoinduced electrons and holes over the AgI/AgVO3 nanocomposites.
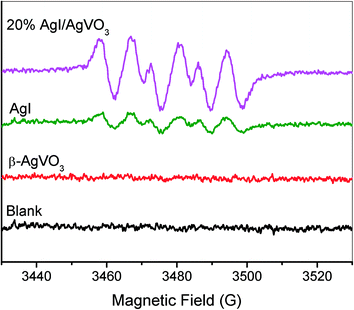
Most of the heterostructure nanocomposites have followed a bidirectional charge transfer mechanism.35–37 For example, Kumar et al. have reported that enrichment of the photoinduced electrons occurs on the conduction band of Ag3PO4 and that of the holes takes place on the valence band of g-C3N4, which are conducted by a double charge transfer process between Ag3PO4 and g-C3N4.35 As for the as-prepared AgI/AgVO3 nanocomposites, the following charge migration process should occur, supposing that the above-mentioned bidirectional charge transfer is the primary migration process. Photogenerated electrons can be transferred from the ECB of AgI into that of β-AgVO3 and at the same time photogenerated holes from the EVB of β-AgVO3 into that of AgI, based on the relative position of EVB or ECB of AgI and β-AgVO3 obtained from Fig. 4. As a result, enrichment of photo-electrons occurs on the ECB of AgVO3 and that of photo-holes on the EVB of AgI in the AgI/AgVO3 nanocomposites. The low ECB of AgVO3 (0.31 eV vs. NHE) demonstrates that the photo-electrons cannot reduce dioxygen to generate superoxide anionic radicals because the redox potential for O2/O2˙− is −0.16 V vs. NHE.38 However, it can be clearly observed from Fig. 9 that the characteristic signals for the adduct DMPO–O2˙− formed39,40 over the AgI/AgVO3 composites and bare AgI in methanol solution under irradiation of visible light, whereas no corresponding signals were obtained with pure β-AgVO3. This demonstrates that photo-electrons located on the ECB of AgI can reduce O2 to O2˙− while those on the ECB of β-AgVO3 cannot. On the other hand, the strong signals of DMPO–O2˙− obtained over the 20% AgI/AgVO3 nanocomposite explicitly indicate that the above-mentioned double charge transfer cannot be the main migration process of photoinduced carriers in the present AgI/AgVO3 composites.
To further clarify the improved charge transfer mechanism of AgI/AgVO3 hybrid photocatalysts, the used sample of 20% AgI/AgVO3 was analyzed by using XPS and the corresponding results are presented in Fig. 10. The survey XPS spectra indicate that the sample consists of Ag, I, O and V elements (Fig. 10A). The two peaks at 516.9 and 524.5 eV can be assigned to V 2p5/2 and V 2p3/2 of V5+ in β-AgVO3.20,41,42 The peaks at 619.9 and 631.4 eV should originate from I 3d of AgI.43 As shown in Fig. 10B, the Ag 3d peaks of used AgI/AgVO3 can be fitted and separated into two sets of XPS peaks by using XPSPEAK software. The strong peaks at 368.2 and 374.3 eV belong to Ag+ in β-AgVO3 and AgI,20,43 whereas the weak peaks at 368.5 and 374.6 eV are ascribed to Ag0 species.31
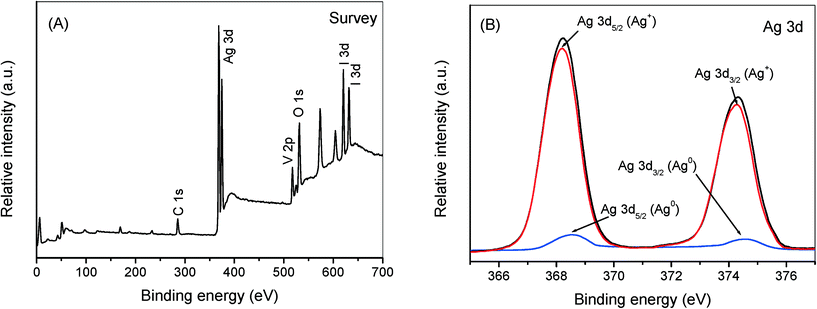 | ||
| Fig. 10 Survey XPS spectra (A) and high resolution XPS spectra of Ag 3d (B) over the 20% AgI/AgVO3 sample after being used for 1 recycling run. | ||
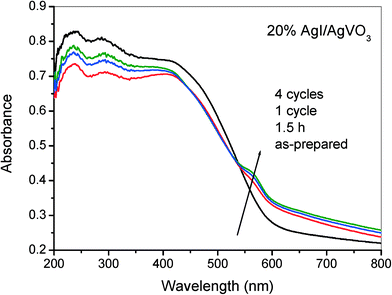
In general, silver halides (AgX) can facilely decompose into Ag0 under light irradiation due to their strong photosensitization properties, especially for AgCl and AgBr materials. However, studies have indicated that supported AgX possess higher photostability and photocatalytic performance toward pollutant degradation and disinfection.30,44,45 For the as-synthesized AgI/AgVO3 nanocomposites, a small amount of Ag0 is formed on the surface of the photocatalysts during the selective oxidation of benzylamine, which has been verified by XPS results (Fig. 10B). In addition, as depicted in Fig. 11, the presence of Ag0 has a slight influence on the light absorption properties of the 20% AgI/AgVO3 sample in the visible region, possibly because of the low content of Ag0 species. Furthermore, it could be found from Fig. 11 that the photocatalysts, after 1.5 h, 1 cycle and 4 cycles, display almost the same absorption spectra, which suggests that the formed Ag/AgI/AgVO3 in the initial stage of the photocatalytic reaction possesses excellent photostability. The EDX results of the 20% AgI/AgVO3 photocatalyst before and after 1.5 h, 1 cycle and 4 cycles are also summarized in Table S1, ESI.† The atomic content of the formed metallic Ag0 is calculated by subtracting the sum of the atomic content of V and I from that of Ag. The obtained contents of Ag0 do not have evident changes over the 20% AgI/AgVO3 catalyst used for different reaction times. Besides, as shown in Fig. S5 (ESI†), no obvious decline in the reactant conversion and product selectivity is observed after four cycling runs. These results clearly indicate that the present AgI/AgVO3 photocatalysts exhibit good stability and can be reused without regeneration.
In the Ag-based photocatalytic system, the roles of metallic Ag0 in enhancing the separation of photoinduced carriers and the photocatalytic performance are mainly surface plasmon resonance (SPR) and the Z-scheme bridge mechanism. SPR is the resonant photo-induced collective oscillation of surface electrons over Ag nanoparticles and this phenomenon can occur only when the samples exhibit strong light absorption in the SPR band.46,47 However, based on the results in Fig. 11, no evident enhancement in light absorption over the used AgI/AgVO3 photocatalyst is observed, compared with the as-synthesized sample, which implies that SPR absorption derived from Ag nanoparticles is weak. Therefore, the SPR effect might not be the main role of Ag0 in the selective redox reactions with AgI/AgVO3 heterostructure photocatalysts.
On the other hand, the formed Ag0 species in the photocatalytic reactions can connect with β-AgVO3 and AgI and serve as a charge migration bridge to drive the efficient separation of photoinduced carriers. Moreover, the above-referred improved photocatalytic redox capacities, the results of radical trapping experiments, and the formation of superoxide radicals can be explained reasonably using the proposed Z-scheme bridge mechanism. Scheme 1 displays the possible enhanced mechanism over the AgI/AgVO3 heterostructure catalysts for the photocatalytic redox reactions. Under visible light illumination, both β-AgVO3 and AgI are photo-excited and holes or electrons are generated on their corresponding valence and conduction bands. The electrons on the conduction band of β-AgVO3 facilely transfer into the Ag nanoparticles because the conduction band edge is more negative than the Fermi level of the formed Ag0. Meanwhile, the holes on the valence band of AgI easily shift into the metal Ag0 since the valence band of AgI is more positive than the Fermi level of metallic Ag. The synergistic charge transfer processes remarkably enhance the separation of photogenerated electrons/holes on the surface of individual AgVO3 and AgI. Therefore, enrichment of photo-electrons occurs on the conduction band of AgI with a more negative potential and that of holes takes place on the valence band of AgVO3 with a more positive potential, which finally result in the significantly improved photocatalytic performance for redox reactions.
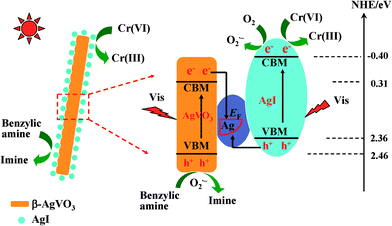 | ||
| Scheme 1 Photocatalytic mechanism of AgI/AgVO3 toward the selective oxidation of benzylic amine and reduction of Cr(VI) under visible light irradiation. | ||
4. Conclusions
In this study, AgI/AgVO3 nanoribbon composites have been successfully fabricated via facile in situ ion-exchange between KI and β-AgVO3. β-AgVO3 nanoribbons serve as not only Ag sources but also excellent supports to immobilize AgI nanoparticles. The as-synthesized AgI/AgVO3 nanocomposites possess significantly improved photocatalytic activity, in comparison with pure β-AgVO3 and AgI, toward the selective oxidation of benzylamine and reduction of Cr(VI) under visible light illumination. It is found that the amount of supported AgI plays an important role in the photocatalytic redox activity and the 20% AgI/AgVO3 sample displays the highest photocatalytic performance. Moreover, the formed Ag0 species in the initial stage of the photocatalytic reaction can serve as a charge migration bridge in the heterostructure catalysts. The superior photocatalytic redox performance is ascribed to the enhanced separation of photoinduced electrons/holes via the Z-scheme bridge mechanism of the formed Ag/AgI/AgVO3.Acknowledgements
This work was supported by the National Natural Science Foundation of China (21307027, 51074067) and the Foundation of Henan Educational Committee (2010B150009).Notes and references
- M. A. Fox and M. T. Dulay, Chem. Rev., 1993, 93, 341–357 CrossRef CAS.
- M. R. Hoffmann, S. T. Martin, W. Choi and D. W. Bahnemann, Chem. Rev., 1995, 95, 69–96 CrossRef CAS.
- A. Mills and S. Le Hunte, J. Photochem. Photobiol., A, 1997, 108, 1–35 CrossRef CAS.
- A. L. Linsebigler, G. Lu and J. T. Yates, Chem. Rev., 1995, 95, 735–758 CrossRef CAS.
- A. Fujishima, T. N. Rao and D. A. Tryk, J. Photochem. Photobiol., C, 2000, 1, 1–21 CrossRef CAS.
- R. Daghrir, P. Drogui and D. Robert, Ind. Eng. Chem. Res., 2013, 52, 3581–3599 CAS.
- Z. G. Yi, J. H. Ye, N. Kikugawa, T. Kako, S. X. Ouyang, H. Stuart-Williams, H. Yang, J. Y. Cao, W. J. Luo, Z. S. Li, Y. Liu and R. L. Withers, Nat. Mater., 2010, 9, 559–564 CrossRef CAS PubMed.
- Y. Bi, S. Ouyang, N. Umezawa, J. Cao and J. Ye, J. Am. Chem. Soc., 2011, 133, 6490–6492 CrossRef CAS PubMed.
- J. Wang, F. Teng, M. Chen, J. Xu, Y. Song and X. Zhou, CrystEngComm, 2013, 15, 39–42 RSC.
- P. Wang, B. B. Huang, X. Y. Qin, X. Y. Zhang, Y. Dai, J. Y. Wei and M. H. Whangbo, Angew. Chem., Int. Ed., 2008, 47, 7931–7933 CrossRef CAS PubMed.
- M. S. Zhu, P. L. Chen and M. H. Liu, ACS Nano, 2010, 5, 4529–4536 CrossRef PubMed.
- C. W. Xu, Y. Y. Liu, B. B. Huang, H. Li, X. Y. Qin, X. Y. Zhang and Y. Dai, Appl. Surf. Sci., 2011, 257, 8732–8736 CrossRef CAS.
- G. P. Dai, J. G. Yu and G. Liu, J. Phys. Chem. C, 2012, 116, 15519–15524 CAS.
- F. Y. Cheng and J. Chen, J. Mater. Chem., 2011, 21, 9841–9848 RSC.
- J. Ren, W. Z. Wang, M. Shang, S. M. Sun, L. Zhang and J. Chang, J. Hazard. Mater., 2010, 183, 950–953 CrossRef CAS PubMed.
- L. Q. Mai, L. Xu, Q. Gao, C. H. Han, B. Hu and Y. Q. Pi, Nano Lett., 2010, 10, 2604–2608 CrossRef CAS PubMed.
- H. Xu, H. M. Li, L. Xu, C. D. Wu, G. S. Sun, Y. G. Xu and J. Y. Chu, Ind. Eng. Chem. Res., 2009, 48, 10771–10778 CrossRef CAS.
- H. F. Shi, Z. S. Li, J. H. Kou, J. H. Ye and Z. G. Zou, J. Phys. Chem. C, 2011, 115, 145–151 Search PubMed.
- P. Ju, H. Fan, B. L. Zhang, K. Shang, T. Liu, S. Y. Ai and D. Zhang, Sep. Purif. Technol., 2013, 109, 107–110 CrossRef CAS.
- Y. Sang, L. Kuai, C. Y. Chen, Z. Fang and B. Y. Geng, ACS Appl. Mater. Interfaces, 2014, 6, 5061–5068 CAS.
- W. Zhao, Y. Guo, Y. Faiz, W. T. Yuan, C. Sun, S. M. Wang, Y. H. Deng, Y. Zhuang, Y. Li, X. M. Wang, H. He and S. G. Yang, Appl. Catal., B, 2015, 163, 288–297 CrossRef CAS.
- W. Zhao, F. Liang, Z. M. Jin, X. B. Shi, P. H. Yin, X. R. Wang, C. Sun, Z. Q. Gao and L. S. Liao, J. Mater. Chem. A, 2014, 2, 13226–13231 CAS.
- Y. M. Yang, Y. Y. Liu, B. B. Huang, R. Zhang, Y. Dai, X. Y. Qin and X. Y. Zhang, RSC Adv., 2014, 4, 20058–20061 RSC.
- C. Hu, T. W. Peng, X. X. Hu, Y. L. Nie, X. F. Zhou, J. H. Qu and H. He, J. Am. Chem. Soc., 2010, 132, 857–862 CrossRef CAS PubMed.
- J. L. Wang, Y. Yu and L. Z. Zhang, Appl. Catal., B, 2013, 136, 112–121 CrossRef.
- S. C. Yan, Z. S. Li and Z. G. Zou, Langmuir, 2010, 26, 3894–3901 CrossRef CAS PubMed.
- X. C. Wang, K. Maeda, A. Thomas, K. Takanabe, G. Xin, J. M. Carlsson, K. Domen and M. Antonietti, Nat. Mater., 2009, 8, 76–80 CrossRef CAS PubMed.
- J. E. Chateauneuf, J. Am. Chem. Soc., 1990, 112, 442–444 CrossRef CAS.
- J. Yang, X. H. Wang, Y. M. Chen, J. Dai and S. H. Sun, RSC Adv., 2015, 5, 9771–9782 RSC.
- H. F. Cheng, B. B. Huang, Y. Dai, X. Y. Qin and X. Y. Zhang, Langmuir, 2010, 26, 6618–6624 CrossRef CAS PubMed.
- Z. H. Chen, W. L. Wang, Z. G. Zhang and X. M. Fang, J. Phys. Chem. C, 2013, 117, 19346–19352 CAS.
- J. H. Yi, L. L. Huang, H. J. Wang, H. Yu and F. Peng, J. Hazard. Mater., 2015, 284, 207–214 CrossRef CAS PubMed.
- S. Q. Liu, M. Q. Yang, Z. R. Tang and Y. J. Xu, Nanoscale, 2014, 6, 7193–7198 RSC.
- N. Wu, J. Wang, D. N. Tafen, H. Wang, J.-G. Zheng, J. P. Lewis, X. Liu, S. S. Leonard and A. Manivannan, J. Am. Chem. Soc., 2010, 132, 6679–6685 CrossRef CAS PubMed.
- S. Kumar, T. Surendar, A. Baruah and V. Shanker, J. Mater. Chem. A, 2013, 1, 5333–5340 CAS.
- P. Xiong, J. W. Zhu and X. Wang, Ind. Eng. Chem. Res., 2013, 52, 17126–17133 CrossRef CAS.
- Y. M. Lin, D. Z. Li, J. H. Hu, G. C. Xiao, J. X. Wang, W. J. Li and X. Z. Fu, J. Phys. Chem. C, 2012, 116, 5764–5772 CAS.
- P. M. Wood, Biochem. J., 1988, 253, 287–289 CrossRef CAS PubMed.
- J. Yang, C. C. Chen, H. W. Ji and J. C. Zhao, J. Phys. Chem. B, 2005, 109, 21900–21907 CrossRef CAS PubMed.
- W. Zhao, C. C. Chen, X. Z. Li, J. C. Zhao, H. Hidaka and N. Serpone, J. Phys. Chem. B, 2002, 106, 5022–5028 CrossRef CAS.
- L. Z. Dong, Y. M. He, T. T. Li, J. Cai, W. D. Hu, S. S. Wang, H. J. Lin, M. F. Luo, X. D. Yi, L. H. Zhao, W. Z. Weng and H. L. Wan, Appl. Catal., A, 2014, 472, 143–151 CrossRef CAS.
- Q. Zhu, W. S. Wang, L. Lin, G. Q. Gao, H. L. Guo, H. Du and A. W. Xu, J. Phys. Chem. C, 2013, 117, 5894–5900 CAS.
- H. Xu, J. Yan, Y. G. Xu, Y. H. Song, H. M. Li, J. X. Xia, C. J. Huang and H. L. Wan, Appl. Catal., B, 2013, 129, 182–193 CrossRef.
- X. X. Hu, C. Hu, T. W. Peng, X. F. Zhou and J. H. Qu, Environ. Sci. Technol., 2010, 44, 7058–7062 CrossRef CAS PubMed.
- C. Hu, X. X. Hu, L. S. Wang, J. H. Qu and A. M. Wang, Environ. Sci. Technol., 2006, 40, 7903–7907 CrossRef CAS PubMed.
- R. Jin, Y. C. Cao, C. A. Mirkin, K. L. Kelly, G. C. Schatzand and J. G. Zheng, Science, 2001, 294, 1901–1903 CrossRef CAS PubMed.
- S. Link and M. A. El-Sayed, J. Phys. Chem. B, 1999, 103, 8410–8426 CrossRef.
Footnote |
| † Electronic supplementary information (ESI) available: SEM photograph of pure AgI, EDX patterns of β-AgVO3 and the 30% AgI/AgVO3 nanocomposite, GC and GC-MS data for the representative compounds in Table 2, control experiment of photo-reduction of Cr(VI) over the 20% AgI/AgVO3 catalyst, EDX results of used 20% AgI/AgVO3 and cycling experiments toward selective oxidation of benzylamine. See DOI: 10.1039/c5cy00787a |
| This journal is © The Royal Society of Chemistry 2016 |

