 Open Access Article
Simultaneous coking and dealumination of zeolite H-ZSM-5 during the transformation of chloromethane into olefins†
M.
Ibáñez
a,
M.
Gamero
a,
J.
Ruiz-Martínez
b,
B. M.
Weckhuysen
b,
A. T.
Aguayo
a,
J.
Bilbao
a and
P.
Castaño
 *a
*a
aDepartment of Chemical Engineering, University of the Basque Country (UPV/EHU), P.O. Box: 644, 48080, Bilbao, Spain. E-mail: pedro.castano@ehu.es
bInorganic Chemistry and Catalysis group, Debye Institute for Nanomaterials Science, Faculty of Science, Utrecht University, Universiteitsweg 99, 3584 CG Utrecht, The Netherlands
First published on 7th August 2015
Abstract
The deactivation pathways of a zeolite H-ZSM-5 catalyst containing bentonite and α-Al2O3 as binder material have been studied during the transformation of chloromethane into light olefins, which is considered as a possible step to valorize methane from natural gas. The reactions have been carried out in a fixed bed reactor, feeding pure chloromethane at 400, 425 and 450 °C, 1.5 bar and with a space-time of 5.4 (gcatalyst) h (molCH2)−1 for 255 min. The properties of the fresh and spent catalysts have been assessed by several techniques, such as N2 physisorption, adsorption/desorption of NH3, XPS and 29Si NMR. Additional measurements of the spent catalysts have been performed to study the nature of the deactivating coke species: TG-TPO analysis, SEM, and FT-IR and UV-vis spectroscopy. With the results in hand, two deactivation mechanisms were proposed: irreversible dealumination at temperatures higher than 450 °C by HCl and reversible coke fouling, while coke formation results from the condensation of polyalkylbenzenes, which are also intermediates in olefin production. The coke deposits grow in size with the addition of Cl to the carbonaceous structure.
1. Introduction
The increasing worldwide resources of natural gas from conventional sources and non-conventional sources, such as shale gas, are spurring efforts to develop commercial processes to obtain fuels and chemicals from methane. The estimated reserves on methane in 2013 are 2.7 trillion cubic meters.1 Additionally, methane can also be obtained in a sustainable manner from bacterial anaerobic digestion of waste streams (e.g. wastewater treatment plants).2 Currently, methane is predominantly converted to synthesis gas and/or hydrogen via catalytic steam reforming. One possible route to obtain fuels and chemicals from methane is the use of synthesis gas for methanol, ethanol, butanol, dimethyl ether or Fischer–Tropsch synthesis routes.Direct valorisation routes of methane in one-stage processes are less attractive for industrial implementation at large scale due to high pressure, high temperature, expensive catalyst or low selectivity and productivity with the current technology.3–6
Another conversion route, conceptually proposed by Mobil Oil,7,8 is the oxyhydrochlorination of methane to obtain chloromethane and the subsequent transformation of chloromethane to hydrocarbons at atmospheric pressure and moderate temperatures (<450 °C) on a H-ZSM-5 zeolite catalyst. This last route generates great interest in order to avoid the energy-demanding steam reforming step. The integration of these two stages in a process makes it more energetically efficient than methane gasification and the subsequent synthesis of methanol.
On the other hand, the second stage of chloromethane transformation involves reaction steps similar to those well known in the methanol-to-hydrocarbon (MTH) or methanol-to-olefin (MTO) processes.9,10 The lower reactivity of chloromethane with respect to methanol is related to its lower adsorption rate on Brønsted acid sites.11 The chloromethane-to-hydrocarbon mechanism has been analyzed by FT-IR spectroscopy12 and is believed to involve the following steps: (i) dissociation of chloromethane, (ii) formation of methoxy species on the acid sites, (iii) formation of polyalkylbenzenes as active intermediates, and (iv) olefin release, while parallel (v) hydrogen transfer and condensation reactions occur to form paraffins and aromatics. Other authors13,14 observed that steps (i) and (ii) are limiting the overall reaction and account for the longer induction period compared to the catalytic transformation of methanol in the MTH and MTO processes.
Several catalysts are active for the conversion of chloromethane into olefins. Among them, H-ZSM-5 and H-SAPO-34 are particularly promising. The rapid deactivation of H-SAPO-34 by coke limits the process lifetime, which is slightly attenuated by metal incorporation.15–17 H-ZSM-5 shows less catalyst deactivation due to the higher diffusion rate of coke precursors and metal doping can enhance the zeolite catalyst performance.18–22 The number of acid sites and the porous structure of zeolite H-ZSM-5 are the key parameters that influence the catalytic performance. The zeolite H-ZSM-5 catalyst is the most suitable one taking into account the right compromise between conversion, propylene selectivity and stability.23
Catalyst deactivation hampers the implementation of the chloromethane-to-olefin process; therefore gaining fundamental understanding on this process is key to finding solutions for the limited catalyst lifetime. This contribution aims to bring new understanding of the mechanisms of zeolite H-ZSM-5 catalyst deactivation during the transformation of chloromethane into olefins. Particularly, this work is focused on the study of coke deposition (i.e., reversible deactivation) and zeolite dealumination (i.e., irreversible deactivation), which are identified as the two main deactivation routes.11,13,23,24 For this purpose, we have studied coke formation using different analytical techniques, namely TG-TPO analysis, SEM, and FT-IR and UV-vis spectroscopy, while zeolite dealumination has been investigated by N2 adsorption–desorption, NH3-TPD, XPS and 29Si NMR. Anticipating the dealumination of the zeolite, we have included Al in the composition of the matrix (binder and filler) to reduce the impact of this deactivation on the acid sites of the zeolite. The regenerability of the catalyst material has been studied by applying a series of reaction–regeneration cycles in order to determine the reversibility conditions.
2. Experimental
2.1. Catalyst preparation
Commercial zeolite, supplied in its ammonium form by Zeolyst International (SiO2/Al2O3 = 80), was subjected to a calcination step (550 °C, 3 h) in order to remove ammonia and obtain the acid form. Natural bentonite supplied by Exaloid and exchanged with 1 M NH4NO3 (Panreac, 98%) was used as a binder (30 wt%) and α-alumina (Prolabo, calcined at 1000 °C) as an inert filler (45 wt%).The catalyst particles were obtained by wet extrusion, using a high-pressure hydraulic piston, through 0.8 mm diameter holes.25 The extrudate materials obtained were dried (i) at room temperature for 24 h and (ii) later in an oven at 110 °C for 24 h. Then the catalyst was sieved, selecting a particle size between 0.15 and 0.3 mm. Finally the catalyst was calcined at 575 °C for 3 h. This temperature was reached following a ramp of 5 °C min−1.
2.2. Reaction set-up and product analysis
The experiments were carried out by feeding chloromethane (AlphaGaz, 99.999%) into an isothermal fixed bed reactor under the following operating conditions: 400 , 425 and 450 °C; 1.5 atm; and space-time = 5.4 (gcatalyst) h (molCH2)−1. This low space-time was established to evaluate the deactivation more accurately, while the time on stream (TOS) = 255 min. For the analysis of coke, different samples were obtained at 450 °C while TOS of 5, 10, 15, 30, 45, 60, 75, 120 and 255 min.The fixed bed reactor can operate up to 100 bar and 700 °C with a catalyst load of up to 5 g. The bed consists of a mixture of a catalyst and an inert solid, carborundum (CSi, supplied by Prolabo), in order to ensure an isothermal bed. The HCl formed during the reaction was removed by using two fixed bed adsorption reactors in series, made up of a mixture of CaCO3 (95 wt%) and Laponite (5 wt%). These materials were calcined at 800 °C thereby increasing the surface area and adsorption capacity. The gases from these catalytic beds pass through a particle filter of 5 μm mesh diameter and subsequently are cooled down to 170 °C. A fraction of the product stream is diluted in a He stream and continuously analyzed in a Varian CP-4900 GC micro-chromatograph. The remaining reaction stream is partially condensed in a Peltier cell at 0 °C and the uncondensed gas flow is vented.
2.3. Fresh and deactivated catalyst characterization
The physical or structural properties of the catalyst (i.e., BET surface area, micropore volume, pore volume, pore size distribution and pore diameter average) were measured using a Micromeritics ASAP 2010 analyzer; these properties were determined by adsorption–desorption of N2 (micropore and mesopore formation).The acidic properties of the catalyst materials were determined by NH3 adsorption–desorption: the number of acid sites and average acid strength were obtained by monitoring the differential adsorption of NH3 simultaneously by calorimetry and thermogravimetry on a Setaram TG-DSC 111 instrument and the curve for temperature-programmed desorption of NH3 was obtained by connecting a Balzer Instruments mass spectrometer (Thermostar) on-line to a Setaram TG-DSC 111 instrument.26,27 Before the NH3 adsorption, the catalyst sample was pre-treated in He (160 mL min−1) following a temperature ramp up to 550 °C and kept in this temperature for 1 h. The saturation of the sample was carried out at 150 °C with 50 μL min−1 of ammonia. Then, the sample was kept in He flow to remove the physisorbed fraction of NH3 for 1 h. The TPD was performed by heating the sample up to 550 °C with a heating rate of 5 °C min−1 in He (20 mL min−1).
Scanning electron microscopy (SEM) images were obtained with a JEOL JSM-6400 W filament (3.5 nm resolution) equipped with a Pentafet (Oxford, UK) X-ray energy dispersive (EDX) analyzer up to 133 eV resolution.
Coupled polarized (CP) magic angle spinning (MAS) nuclear magnetic resonance (NMR) spectra of 29Si (29Si CP-MAS NMR) were obtained using a Bruker 400 WB Plus spectrometer. The spectra were collected by using a 4 mm probe spinning at 10 kHz. The spectra of solid samples were recorded for 12 h using the standard pulse sequence at 79.5 MHz, a spectral width of 55 kHz, a contact time of 2 ms and an interpulse delay of 5 s. As the samples contain an alumina binder it was not possible to obtain reasonable results with 27Al MAS NMR and therefore this approach was not followed.
X-ray photoelectron spectroscopy (XPS) analysis was carried out using a SPECS (Berlin, Germany) equipment with a Phoibos analyzer 150 1D-DLD and Al Kα (hν = 1486.6 eV) monochromatic radiation source. It was first done on a wide range of elements present in the sample (wide scan: step energy 1 eV, dwell time 0.1 s, pass energy 40 eV), while an exhaustive analysis of elements (detail scan: step energy 0.1 eV, dwell time 0.1 s, pass energy 20 eV) was performed with an exit angle of electrons equal to 90°. The 1 s carbon was established at 284.6 eV to correct for possible charging effects. The XPS spectrometer was previously calibrated with the peak of Ag 3d5/2 (368.28 eV). The XPS spectra were fitted using the software CasaXPS 2.3.16, which models the Gaussian–Lorentzian contributions after background subtraction (Shirley).
2.4. Coke characterization
The amount of coke deposited on the catalyst was measured by combustion of samples taken from the fixed bed reactor. After the reaction cycle, each sample was flushed in He within the reactor (30 mL min−1, for 2 h) to eliminate the volatiles trapped on the catalyst. The combustion experiments were performed with a TGA Q5000TA thermobalance (Thermo Scientific) using the following procedure: (1) scan of the sample with N2 stream to remove impurities; (2) combustion with air at 575 °C with a temperature ramp of 3 °C min−1 followed by isothermal conditions for 60 min (to ensure complete combustion of coke); (3) cooling of the sample with a ramp of 15 °C min−1 to 250 °C.The chemical nature of the coke species was determined by ex situ FT-IR spectroscopy by using a Nicolet 6700 spectrophotometer (Thermo). The deactivated catalyst sample (≈10 mg) was pressed into a self-supported pellet with KBr (150 mg, purity >99%) by applying a pressure equivalent to 10 t cm−2. The sample was degassed in a transmission cell at 100 °C for 1 h to desorb water and remove the impurities of the sample.
UV-vis absorption measurements were carried out using a high-temperature UV-vis probe provided by Avantes. The probe comprises one excitation and one collection optical fiber with a diameter of 400 μm and length of 1.5 m, which are placed in a stainless steel protection sleeve. The probe was connected to a deuterium–halogen light source and an AvaSpec 2048 UV-vis spectrometer. The probe was custom-made to operate at temperatures up to 873 K. The samples were placed on a Scientific Instrument Linkam cell and spectra were collected at different positions along individual catalyst particles and in different catalyst particles, so that the results are averages of these measurements. The spectra were saved every 20 s, with 100 accumulations of 140 ms exposure time each. The optical absorption microscopic measurements were performed in the spectral range of 400–700 nm.
3. Results
3.1. Catalyst characterization
Table 1 summarizes the textural properties and number of acid sites of the catalyst material with binder as well as the pure zeolite H-ZSM-5 material used. The agglomeration of the zeolite contributes to the increase in mesopore volume from 0.15 cm3 g−1 up to 0.47 cm3 g−1, and as a consequence, the pore diameter average increases up to 150 Å. On the other hand and also as a result of the agglomeration, the total number of acid sites (per gram of sample) decreases because the bentonite used to agglomerate has a low number of acid sites and the α-Al2O3 used as an inert binder material has insufficient acidity. The acid strength average decreases slightly with the agglomeration with a value of 116 kJ (mol)−1.| Property | Zeolite | Catalyst |
|---|---|---|
| BET surface area (m2 g−1) | 540 | 203 |
| Micropore area (m2 g−1) | 396 | 106 |
| Mesopore volume (cm3 g−1) | 0.15 | 0.47 |
| Number of acid sites (μmol g−1) | 427 | 172 |
| Average acid strength (kJ (mol)−1) | 125 | 116 |
3.2. Coke deactivation
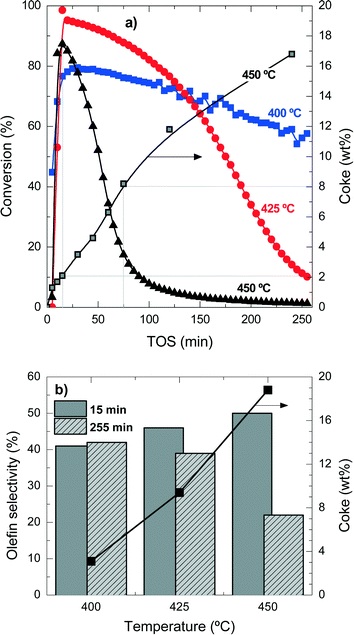
Table S1 in the ESI† summarizes the selectivity of products at the different temperature conditions studied here, at two times on stream for comparison. The explanation of the mentioned product distribution can also be found in the ESI.†Fig. 1b shows the olefin selectivities at 15 min and 255 min for the different reaction temperatures and the coke content after 255 min TOS. The initial (15 min) olefin selectivity increases with reaction temperature, but as the catalyst deactivates faster, the final (255 min) olefin selectivity decreases. These results also point out that the faster the formation of reaction intermediates (polyalkylbenzenes) the faster the formation of light olefins, but also the faster the condensation reactions form coke deposits. When the coke content is higher than 3–4 wt%, the olefin selectivity is drastically affected.
These results show that, in agreement with the methanol-to-olefin process, hydrocarbons trapped inside the porous structure of the catalyst material initially have a role as reaction intermediates and eventually condensate and block the acid sites and the micropores of the catalyst material. Accordingly, the deactivating coke is formed by the conversion of intermediate polyalkylbenzenes to progressively inactive and more condensed structures.31,32
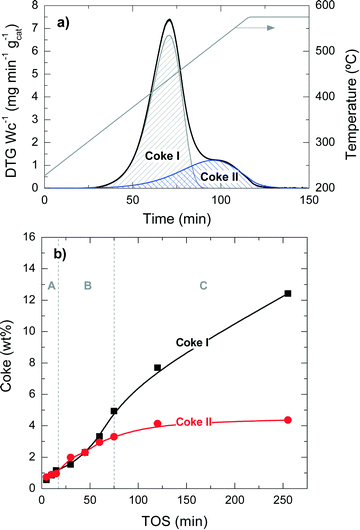
Fig. 2 presents the TPO profiles of coke combustion deposited on the catalyst material at a reaction temperature of 450 °C for different TOS values. These profiles show the existence of two combustion peaks associated with different compositions and locations of coke within the catalyst particles:33,34 (i) coke I burns approximately at 430 °C and has low condensation, poor graphitization and a relatively high H![[thin space (1/6-em)]](https://www.rsc.org/images/entities/char_2009.gif) :
:![[thin space (1/6-em)]](https://www.rsc.org/images/entities/char_2009.gif) C ratio; (ii) coke II burns at 510 °C and it has a more condensed, higher graphitization and lower H
C ratio; (ii) coke II burns at 510 °C and it has a more condensed, higher graphitization and lower H![[thin space (1/6-em)]](https://www.rsc.org/images/entities/char_2009.gif) :
:![[thin space (1/6-em)]](https://www.rsc.org/images/entities/char_2009.gif) C ratio compared with coke I. Thus, the difference in the combustion maxima of these two types of coke could be associated, in principle, with both location and composition. Our previous results in other hydrocarbon conversion processes33–36 suggest that the location and composition of the coke deposits are interconnected, as external coke has less steric hindrance to grow.37 Interestingly, Fig. 2 displays that the reaction temperatures at which the maximum combustion rate of coke I and II occurs shift to higher values at longer TOS values: (coke I) from 410 to 440 °C and (coke II) from 500 to 550 °C. This temperature shift indicates a higher degree of condensation of both types of coke with increasing TOS.
C ratio compared with coke I. Thus, the difference in the combustion maxima of these two types of coke could be associated, in principle, with both location and composition. Our previous results in other hydrocarbon conversion processes33–36 suggest that the location and composition of the coke deposits are interconnected, as external coke has less steric hindrance to grow.37 Interestingly, Fig. 2 displays that the reaction temperatures at which the maximum combustion rate of coke I and II occurs shift to higher values at longer TOS values: (coke I) from 410 to 440 °C and (coke II) from 500 to 550 °C. This temperature shift indicates a higher degree of condensation of both types of coke with increasing TOS.
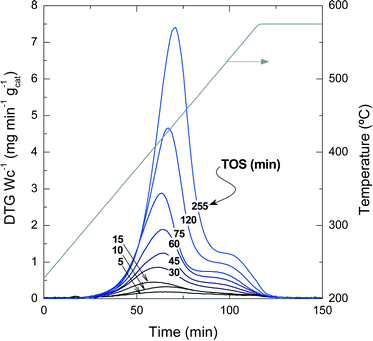 | ||
| Fig. 2 TPO profiles of the coke combustion deposited on the spent catalyst with different TOS at 450 °C. | ||
The quantification of the two different types of coke has been performed by deconvolution of the TPO curves, assuming two independent first-order kinetic models with respect to the partial pressure of O2 (PO2) and the fraction of coke content in the catalyst (CCi).38Fig. 3a shows an example of the described deconvolution of the deactivated catalyst at 450 °C and at a TOS of 255 min. The shape of the second peak does not have a symmetrical Gaussian shape due to the fact that part of the combustion peak is obtained during the temperature ramp and the rest in an isothermal step, as shown in Fig. 2 and 3a. Fig. 3b displays the evolution of each coke fraction deposited at 450 °C with increasing TOS. During the first 75 min of reaction, which correspond to the initiation (A) and reaction period (B), the amount of coke I and II increases linearly and simultaneously, until the total coke content value of about 8 wt% (Fig. 1) is reached, which corresponds to a coke I![[thin space (1/6-em)]](https://www.rsc.org/images/entities/char_2009.gif) :
:![[thin space (1/6-em)]](https://www.rsc.org/images/entities/char_2009.gif) II ratio of 1
II ratio of 1![[thin space (1/6-em)]](https://www.rsc.org/images/entities/char_2009.gif) :
:![[thin space (1/6-em)]](https://www.rsc.org/images/entities/char_2009.gif) 1. At TOS higher than 75 min, in the deactivation period (C), coke I experiences continuous growth, while coke II tends to an asymptotic value of around 4.4 wt%. This difference in the evolution of the two types of coke can be explained by their different location on the porous structure of the catalyst. Thus, coke II is deposited in the pores of the catalyst material so that the size of the zeolite H-ZSM-5 pores and/or those of the matrix limit its formation. Besides, coke II has a lower H
1. At TOS higher than 75 min, in the deactivation period (C), coke I experiences continuous growth, while coke II tends to an asymptotic value of around 4.4 wt%. This difference in the evolution of the two types of coke can be explained by their different location on the porous structure of the catalyst. Thus, coke II is deposited in the pores of the catalyst material so that the size of the zeolite H-ZSM-5 pores and/or those of the matrix limit its formation. Besides, coke II has a lower H![[thin space (1/6-em)]](https://www.rsc.org/images/entities/char_2009.gif) :
:![[thin space (1/6-em)]](https://www.rsc.org/images/entities/char_2009.gif) C ratio and is more condensed compared with coke I, the reasons behind the higher combustion temperature of the former. In this process, coke precursors are formed by the condensation of polyalkylbenzenes and the oligomerization of olefins.14 Zeolite H-ZSM-5 has an ideal pore system with high connectivity and without cages, enabling a fast circulation of coke precursors to the exterior of the zeolite material,35,36,39,40 where these species grow without spatial constraint, forming coke I.37 Given the negligible number of acid sites of bentonite and α-Al2O3, these binder materials have insignificant activity for these reactions of coke formation and thus coke is mainly formed inside or outside the zeolite domains. All the steps of coke formation are favoured at higher reaction temperatures and with higher number of acid sites of the zeolite H-ZSM-5 employed.
C ratio and is more condensed compared with coke I, the reasons behind the higher combustion temperature of the former. In this process, coke precursors are formed by the condensation of polyalkylbenzenes and the oligomerization of olefins.14 Zeolite H-ZSM-5 has an ideal pore system with high connectivity and without cages, enabling a fast circulation of coke precursors to the exterior of the zeolite material,35,36,39,40 where these species grow without spatial constraint, forming coke I.37 Given the negligible number of acid sites of bentonite and α-Al2O3, these binder materials have insignificant activity for these reactions of coke formation and thus coke is mainly formed inside or outside the zeolite domains. All the steps of coke formation are favoured at higher reaction temperatures and with higher number of acid sites of the zeolite H-ZSM-5 employed.
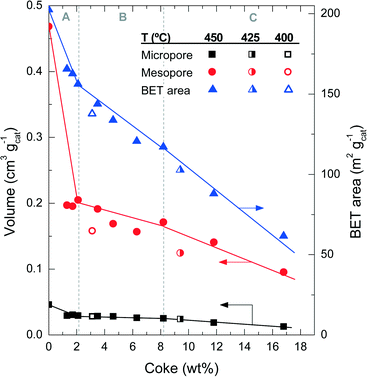 | ||
| Fig. 4 Evolution of coke content with the physical properties of the catalyst spent at different reaction temperatures. | ||
Fig. 5 shows the mesopore size distribution of the fresh and spent catalyst materials, which has been determined with the BJH method to be in the range of 3–100 nm. The results of Fig. 5a correspond to different reaction temperatures but for the same TOS (i.e., 255 min), while Fig. 5b corresponds to a reaction temperature of 450 °C but measured for different TOS values. It can be concluded that the fresh catalyst has a bimodal pore distribution with mesopores of 4 and 15 nm, presumably corresponding to the matrix of bentonite and α-Al2O3 and spaces between the zeolite H-ZSM-5 domains, which are formed during the agglomeration.41 Furthermore, it appears that the 4 nm pores are plugged by coke deposits, whereas the 15 nm mesopores are narrowed down to 6 nm. Pore blockage is faster with increasing reaction temperature and TOS.
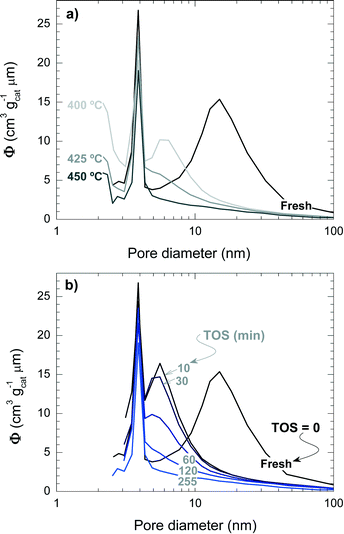 | ||
| Fig. 5 Effect of coke deposition on the pore size distribution of the spent catalyst at different temperatures (TOS = 255 min) (a) and during different TOS (450 °C) (b). | ||
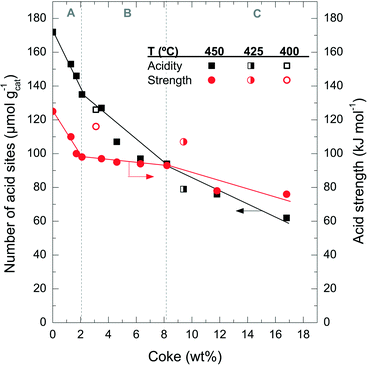
Fig. 6 shows the degradation of the catalyst acid properties (i.e. total number of acid sites and average acid strength) with coke content. These results also indicate a direct relationship between the remaining number of acid site features and the coke content deposited on the catalyst material. The fresh catalyst has a number of acid sites of 172 μmol gcat−1; this value decreases to 126 μmol gcat−1 after the A period, 79 μmol gcat−1 after the B period and 62 μmol gcat−1 after the C period. The rate of deterioration of the acid properties is much faster in the A period, but it reaccelerates in the C period. By comparing the drop in conversion (Fig. 1a) with the catalyst number of acid sites (Fig. 6) it can be concluded that the catalyst material has no activity in the conversion of chloromethane, but a certain residual number of acid sites remains (<80 μmol gcat−1) with poor acid strength (<80 kJ mol−1). This residual number of acid sites is not sufficient to activate chloromethane and to convert its reaction intermediates into olefins. At this stage, the catalyst is active only for the reaction of coke with chloromethane. In this way the coke content continues to increase with TOS in period C (Fig. 1), in particular coke I (Fig. 3b).
![[double bond, length as m-dash]](https://www.rsc.org/images/entities/char_e001.gif) C bonds in polyaromatic hydrocarbons (PAH) or in coke (dienes).43 The C–H stretching band at 2930 cm−1 is most likely due to aliphatic –CH2 and –CH groups, and the C–H stretching band at 2960 cm−1 to –CH3 aliphatic groups. The band at 1425 cm−1 has no unique assignment, but considering its higher intensity with respect to the same analysis used for the methanol-to-olefin process, part of it can be assigned to C–Cl bonds or chlorinated species in coke, whose intensity increases with TOS (Fig. 7). Fig. S1 in the ESI† shows an example of the FT-IR spectrum of a deactivated catalyst. The FT-IR results show that the IR bands of PAH, dienes and the one at 1425 cm−1 increase almost linearly during the A and B periods, whereas the IR bands of aliphatic groups and the one at 1425 cm−1 undergo a slight increase in the C period. These results indicate a growth of aromatic and olefinic species in coke and an increasing growth of chlorinated and aliphatic species in the C period. The relative ratio of the IR intensities of –CH3 and –CH2 groups is almost constant, indicating that there is no significant variation in the length of the aliphatic chains in coke with increasing TOS.
C bonds in polyaromatic hydrocarbons (PAH) or in coke (dienes).43 The C–H stretching band at 2930 cm−1 is most likely due to aliphatic –CH2 and –CH groups, and the C–H stretching band at 2960 cm−1 to –CH3 aliphatic groups. The band at 1425 cm−1 has no unique assignment, but considering its higher intensity with respect to the same analysis used for the methanol-to-olefin process, part of it can be assigned to C–Cl bonds or chlorinated species in coke, whose intensity increases with TOS (Fig. 7). Fig. S1 in the ESI† shows an example of the FT-IR spectrum of a deactivated catalyst. The FT-IR results show that the IR bands of PAH, dienes and the one at 1425 cm−1 increase almost linearly during the A and B periods, whereas the IR bands of aliphatic groups and the one at 1425 cm−1 undergo a slight increase in the C period. These results indicate a growth of aromatic and olefinic species in coke and an increasing growth of chlorinated and aliphatic species in the C period. The relative ratio of the IR intensities of –CH3 and –CH2 groups is almost constant, indicating that there is no significant variation in the length of the aliphatic chains in coke with increasing TOS.
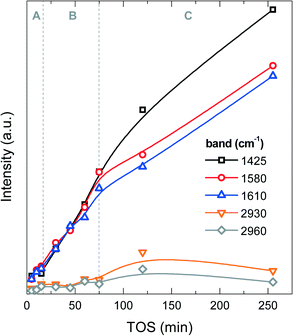 | ||
| Fig. 7 Evolution of the intensities of the FT-IR spectrum vibration bands with time on stream corresponding to functional groups of coke on the spent catalyst at 450 °C. | ||
UV-vis absorption spectroscopy is sensitive to the electronic transitions of different aromatic species and is a suitable technique for the analysis of the formation and growth of coke in different reactions, such as cracking of polyolefins,35 bio-oil cracking,34,44 aromatization of paraffins and olefins,45 and dehydrogenation of paraffins46,47 as well as the MTO reaction.48 The region of UV-vis absorption spectra between 300 and 410 nm has been assigned to π–π* transition originating from polyalkylbenzene carbocations (i.e., one-ring aromatics) forming the “hydrocarbon pool”.49 At 425–475 nm more condensed aromatic compounds are observed, such as two- and three-ring aromatic carbocations from naphthalene, anthracene and phenanthrene;45,50 more condensed species are observed at 565–635 nm, such as aromatic carbocation species with four and five rings;33 and above 675–680 nm, higher condensation PAH carbocation structures appear.33
Fig. 8 displays the changes in the intensities of the different absorption bands with increasing TOS obtained upon deconvolution of the UV-vis spectra (Fig. S2 of the ESI† shows these spectra) by using Gaussians. It is observed that the absorption bands at 380, 430, 480, 530 and 580 nm follow a first-order kinetic formation, with an average formation time of 2–3 min, with the intensity of these absorption bands tending to an asymptotic value. The more condensed coke species, with absorption bands at 630, 680 and 730 nm (more evident in the last one), have formation and growth stages similar to the ones observed in coke formation: (A period) in the range 0–30 min, with first-order kinetic formation, (B period) 30–75 min with steady formation of these species and (C period) with accelerated growth of these bands. It is important to mention that the formation kinetics in the A period are very similar among the UV-vis bands, however, and after this period, less condensed one- and two-ring aromatics seem to reach a plateau of formation due to the fact that this type of active/inactive species lie inside the micropores of the zeolite H-ZSM-5 (with pores of 0.5–0.6 nm). In the B period but particularly in the C period, there is an incremental growth rate of the most condensed structures with probable participation of the chloromethane reactant.
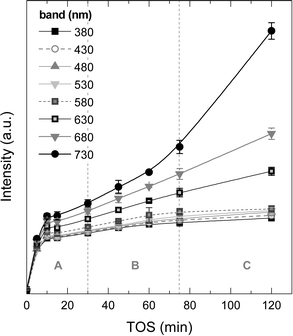 | ||
| Fig. 8 Evolution of the UV-vis vibration band intensities with time on stream corresponding to the aromatic species of coke on the used catalyst to 450 °C range. | ||
The results showed so far demonstrate that the mechanisms of coke formation and further growth on a zeolite H-ZSM-5 catalyst is very similar for both MTO and chloromethane-to-olefin processes.51 However, the rates of coke formation are considerably faster during the transformation of chloromethane into olefins. On the other hand, chloromethane is less reactive than methanol and the formation of polyalkylbenzenes (initiation period A) is slower. The presence of steam during the methanol transformation has been found to be effective in reducing the condensation of coke precursors and in facilitating desorption of the acid sites of zeolite H-ZSM-5 in obtaining olefins from methanol.51 and other oxygenated compounds.44,52 As steam is not created during chloromethane transformation this facilitation is not observed and, instead, HCl is present in the reaction medium, which certainly will affect the overall stability of the catalyst material.
3.3. Dealumination deactivation
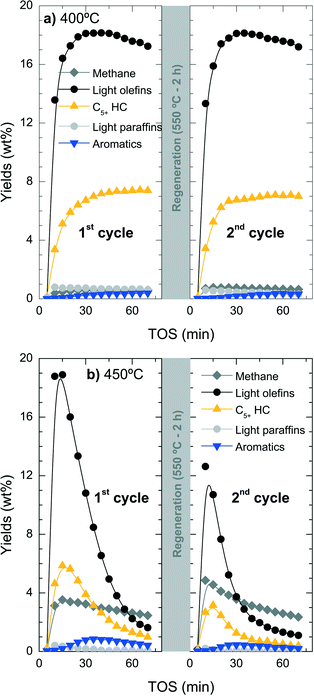
While catalyst deactivation by coke formation is a reversible process and the catalyst can be regenerated by (gentle) coke combustion, the possible dealumination by HCl is irreversible.53 To quantify the extent of this irreversible deactivation, the loss of catalyst activity has been studied in successive reaction–regeneration cycles using a space-time of 3.22 gcat h (molCH2)−1 for 70 min of reaction and at 400, 425 and 450 °C. The regeneration step was performed by coke combustion with air in the reactor at 550 °C for 120 min.Fig. 9 shows the evolution with increasing TOS in a cycle of reaction–regeneration–reaction of the different products: methane, C2–C4 light olefins, non-aromatic C5+ hydrocarbons (C5+ HC), C2–C4 light paraffins and BTX aromatics. During reaction at 400 °C (Fig. 9a), the regenerated catalyst completely recovers the initial catalytic performance so all the deactivation appears to be reversible. In contrast, when the reaction is performed at 450 °C (Fig. 9b), the conversion and product yields do not follow the same performance in both reaction cycles and a less active catalyst is obtained in the second cycle.
The results of Fig. 9b indicate the presence of irreversible deactivation in the reaction step that favours parallel reactions like the competitive thermal cracking of chloromethane into methane. The irreversible loss of catalyst activity is unlikely to be attributed to the regeneration step due to the fact that the catalyst tested at 400 °C does not show any significant irreversible deactivation. The irreversible dealumination of the catalyst was studied using different analytical techniques, namely SEM-EDX, XPS and 29Si NMR.
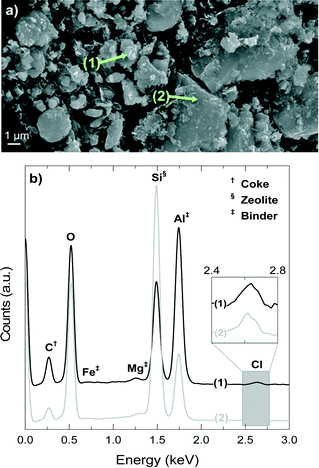
Fig. 10a shows a SEM image of the deactivated catalyst, which has been reacting at 450 °C for 4 h, whereas Fig. 10b shows the EDX spectra of spots 1 and 2 in Fig. 10a. The signals of Si, Al and O are present in the zeolite material and the matrix components, but a higher intensity of Si indicates the higher proportion of H-ZSM-5 zeolite in the spot due to its higher fraction of SiO2 (ca. 98 wt% accounting SiO2/Al2O3 = 80) compared with that of bentonite (<70 wt%).54,55 On the contrary, a higher proportion of Al indicates the higher proportion of the matrix material due to the fact that the filler is α-Al2O3. The signals of Mg and Fe univocally correspond to the bentonite matrix material.
The results of Fig. 10b demonstrate that position 1 has a higher proportion of matrix components (higher signals of Al, Fe and Mg), whereas position 2 corresponds to an area richer in H-ZSM-5 zeolite material (higher signal of Si). On the other hand, the results of Fig. 10b show that coke (C signal) is deposited mainly on the matrix material (point 1) in what we have referred to as external coke, although there is also a remarkable coke content on or inside the zeolite material. Fig. 10b shows that the signal of Cl is present in positions 1 and 2 (that has been zoomed in for better visualization), which means that the Cl is fixed in the catalyst in two ways: (i) with Al, AlCl3 is most probably formed, and (ii) in the organic phase of the deactivated catalyst, and therefore in the coke deposits, which is consistent with the presence of chlorinated groups aforementioned in the FT-IR spectra of the coke deposits. The mechanism of AlCl3 formation has been observed in different zeolite materials exposed to HCl.56–58 The high content of α-Al2O3 in the matrix suggests that this component protects (at least to some degree) the H-ZSM-5 zeolite material from dealumination.
Fig. 11 shows the 29Si NMR spectra of the fresh and spent catalyst materials treated at 400, 425 and 450 °C. The fresh catalyst shows a chemical shift at −118.18 ppm corresponding to several contributions (Q4 of Si-(OSi)4 to ca. −119 ppm, Q4 of Si-(OSi)3(OAl)1 to ca. −117.5 ppm and Q3 of Si-(OSi)3(OH)1 to ca. −116 ppm) in the zeolite material. In addition, other minor chemical shifts observed at −112 and −102 ppm are attributable to Q3 contributions in the bentonite.59,60 The displacement of the maximum of the NMR peak from −118.61 to −119.11 ppm as the reaction temperature increases in the range 400–450 °C indicates a decrease in the Si-(OSi)3(OAl)1 contribution with respect to that of the Si-(OSi)4. This result highlights the structural modification of the zeolite by dealumination. Indeed, this kind of dealumination of zeolite H-ZSM-5 has been observed in the transformation of different oxygenates (i.e., methanol, ethanol and bio-oil) to hydrocarbons, which is attributed to steaming at high reaction temperatures.61–63 Based on the results obtained in the catalytic performance and the characterization of the spent catalysts, we can conclude that there is a significant dealumination of zeolite H-ZSM-5 at 450 °C due to the presence of HCl in the reaction medium. This deactivation also leads to the formation of AlCl3, which is consistent with the presence of Cl on the catalyst surface, as determined by EDX spectroscopy (Fig. 10b).
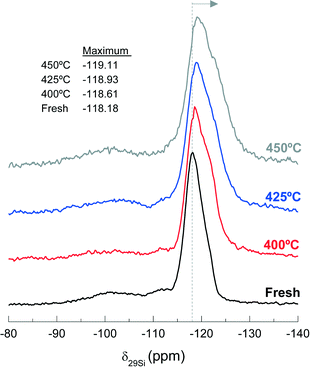 | ||
| Fig. 11 Effect of reaction temperature on the peak position of 29Si NMR spectra, −118.18 ppm, of the fresh and used catalysts during 255 min time on stream. | ||
To quantify the dealumination of the catalyst, the fresh and deactivated catalyst materials were evaluated by X-ray photoelectron spectroscopy (XPS). The Si/Al ratios are summarized in Table 2, using the bands of Si-2p (102.42 eV) and Al-2p (74.25 eV).64 Note that these Si/Al ratios correspond to the Si and Al present in both the zeolite and the catalyst matrix. The Si/Al ratio of the spent catalyst at 400 °C is similar (i.e., 1.02) to that of the fresh one (i.e., 1.04), while the value of the ratio increases notably for 425 °C (i.e., 1.23) but particularly at 450 °C (i.e., 1. 60). All the above indicates that there is a significant dealumination of the catalyst material taking place at 450 °C. Presumably, the presence of extra aluminium in the matrix is beneficial for quenching the irreversible dealumination of zeolite H-ZSM-5, diverting HCl into less harmful reactions (i.e., formation of AlCl3 by reacting with the aluminium). Clearly, 425 °C is the upper reaction temperature to avoid in irreversible catalyst deactivation by dealumination.
| Elements | BE (eV) | Area (%) | ||||
|---|---|---|---|---|---|---|
| Fresh | 400 °C | 425 °C | 450 °C | |||
| Si | Si 2p | 102.42 | 12.61 | 13.13 | 11.49 | 10.09 |
| Al | Al 2p | 74.25 | 12.1 | 12.88 | 9.32 | 6.31 |
| Si/Al | 1.04 | 1.02 | 1.23 | 1.60 | ||
Conclusions
In the catalytic transformation of chloromethane into olefins, the main causes of deactivation of H-ZSM-5 zeolite catalyst containing bentonite and α-Al2O3 as binder material are coke deposition (i.e., reversible deactivation) and dealumination (i.e., irreversible deactivation) of the catalyst mainly at temperatures higher than 425 °C.The mechanism of coke formation can be related to three successive stages: stage A, which is an initiation stage (until a coke content on the catalyst of about 2 wt% is reached), associated with the incipient formation of active polyalkylbenzenes in the micropores of the zeolite and simultaneous formation of inactive condensed aromatic structures in the mesopores and macropores (due to the deposition of the polyalkylbenzenes formed on the acid sites of the zeolite on the catalytic matrix); state B, which is a reaction period (up to a coke content of about 8 wt%) with the fastest formation of olefins and reaction period of condensed coke structures; and stage C, which corresponds to complete deactivation observed by the apparent shutdown of olefin production due to a remarkable blockage of the zeolite pores, deterioration of the number of its acid sites and growth of condensed PAH structures.
The TPO combustion profiles show the existence of two types of coke: coke I is more hydrogenated (burns at 430 °C), less condensed and grows almost linearly with TOS; coke II is less hydrogenated (burns at 510 °C), more condensed, has an asymptotic growth and reaches a saturation value. After 255 min of reaction at 450 °C, the amount of coke I is almost 3 times as much as that of coke II (Fig. 3). In this condition, the amount of coke deposited on the matrix material is higher than that on the zeolite material according to the EDX results (Fig. 10). Thus, and accounting our previous works in other processes using H-ZSM-5 zeolite,37,65 we inferred that coke I is mainly deposited on the matrix pores, outside the zeolite and with significantly less steric hindrance against its growth, whereas coke II is closer to the acid sites of the H-ZSM-5 zeolite material. The fact that the amount of coke I increases linearly even when the catalyst activity has shut down (e.g. after 255 min at 450 °C) indicates that the growth of this type of coke is due to the condensation with chloromethane, as the concentration of the rest of products is practically negligible.
Coke deactivation is reversible after carrying out the reaction at 400 °C and the catalyst material completely recovers its activity by combustion of coke with air at 550 °C for 2 h. However, when the reaction is performed at 425 °C or particularly at 450 °C, the catalyst is also deactivated irreversibly without completely recovering the activity after the combustion of coke. The results of the spectroscopic analysis have revealed that the dealumination of the zeolite material, which causes an increase in the relative abundance of Si-(OSi)4 species and an increase in the Si/Al ratio, can be attributed to the formation of AlCl3 by reaction of the HCl released during catalytic reaction. Consequently, it is necessary to perform the chloromethane-to-olefin reaction at a reaction temperature of 400 °C or lower in order to recover fully the activity of the material upon regeneration.
Acknowledgements
The financial support of this work was undertaken by the Ministry of Science and Education of the Spanish Government with some cofounding of FEDER founds (Projects CTQ2010-19188, CTQ2010-19623, CTQ2013-46172-P and CTQ2013-46173-R), by the Basque Government (Projects IT748-13 and UFI 11/39 UPV/EHU) and by the Dutch Government (CW-NWO; TOP and VENI grants). M. I. and M. G. are grateful for their pre-doctoral grants (BFI-2012-203 and BES-2008-005866, respectively).References
- M. Melikoglu, Renewable Sustainable Energy Rev., 2014, 37, 460–468 CrossRef.
- L. Yang, X. Ge, C. Wan, F. Yu and Y. Li, Renewable Sustainable Energy Rev., 2014, 40, 1133–1152 CrossRef CAS.
- J. H. Lunsford, Catal. Today, 2000, 63, 165–174 CrossRef CAS.
- J. S. Ahari, R. Ahmadi, H. Mikami, K. Inazu, S. Zarrinpashne, S. Suzuki and K. I. Aika, Catal. Today, 2009, 145, 45–54 CrossRef CAS.
- A. Holmen, Catal. Today, 2009, 142, 2–8 CrossRef CAS.
- A. G. Dedov, G. D. Nipan, A. S. Loktev, A. A. Tyunyaev, V. A. Ketsko, K. V. Parkhomenko and I. I. Moiseev, Appl. Catal., A, 2011, 406, 1–12 CrossRef CAS.
- C. D. Chang, in Studies in Surface Science and Catalysis, 1988, pp. 127–143 Search PubMed.
- C. E. Taylor, R. P. Noceti and R. R. Schehl, Stud. Surf. Sci. Catal., 1988, 483–489 CrossRef CAS.
- N. Rahimi and R. Karimzadeh, Appl. Catal., A, 2011, 398, 1–17 CrossRef CAS.
- Y. K. Park, C. W. Lee, N. Y. Kang, W. C. Choi, S. Choi, S. H. Oh and D. S. Park, Catal. Surv. Asia, 2010, 14, 75–84 CrossRef CAS.
- M. H. Nilsen, S. Svelle, S. Aravinthan and U. Olsbye, Appl. Catal., A, 2009, 367, 23–31 CrossRef CAS.
- T. Xu, Q. Zhang, H. Song and Y. Wang, J. Catal., 2012, 295, 232–241 CrossRef CAS.
- S. Svelle, S. Aravinthan, M. Bjørgen, K. P. Lillerud, S. Kolboe, I. M. Dahl and U. Olsbye, J. Catal., 2006, 241, 243–254 CrossRef CAS.
- U. Olsbye, O. V. Saure, N. B. Muddada, S. Bordiga, C. Lamberti, M. H. Nilsen, K. P. Lillerud and S. Svelle, Catal. Today, 2011, 171, 211–220 CrossRef CAS.
- Y. Wei, D. Zhang, L. Xu, Z. Liu and B. L. Su, Catal. Today, 2005, 106, 84–89 CrossRef CAS.
- Y. Wei, D. Zhang, Z. Liu and B. L. Su, J. Catal., 2006, 238, 46–57 CrossRef CAS.
- Y. Wei, Y. He, D. Zhang, L. Xu, S. Meng, Z. Liu and B. L. Su, Microporous Mesoporous Mater., 2006, 90, 188–197 CrossRef CAS.
- P. Lersch and F. Bandermann, Appl. Catal., 1991, 75, 133–152 CrossRef CAS.
- Y. Sun, S. M. Campbell, J. H. Lunsford, G. E. Lewis, D. Palke and L. M. Tau, J. Catal., 1993, 143, 32–44 CrossRef CAS.
- D. Jaumain and B. L. Su, Catal. Today, 2002, 73, 187–196 CrossRef CAS.
- D. Jaumain and B. L. Su, J. Mol. Catal. A: Chem., 2003, 197, 263–273 CrossRef CAS.
- L. A. Noronha, E. F. Souza-Aguiar and C. J. A. Mota, Catal. Today, 2005, 101, 9–13 CrossRef CAS.
- Y. Xu, J. Wang, Y. Suzuki and Z. G. Zhang, Catal. Today, 2012, 185, 41–46 CrossRef CAS.
- Y. Wei, D. Zhang, L. Xu, F. Chang, Y. He, S. Meng, B. L. Su and Z. Liu, Catal. Today, 2008, 131, 262–269 CrossRef CAS.
- P. L. Benito, A. T. Aguayo, A. G. Gayubo and J. Bilbao, Ind. Eng. Chem. Res., 1996, 35, 2177–2182 CrossRef CAS.
- A. G. Gayubo, A. T. Aguayo, M. Olazar, R. Vivanco and J. Bilbao, Chem. Eng. Sci., 2003, 58, 5239–5249 CrossRef CAS.
- A. T. Aguayo, A. G. Gayubo, R. Vivanco, M. Olazar and J. Bilbao, Appl. Catal., A, 2005, 283, 197–207 CrossRef CAS.
- A. T. Aguayo, A. G. Gayubo, R. Vivanco, A. Alonso and J. Bilbao, Ind. Eng. Chem. Res., 2005, 44, 7279–7286 CrossRef CAS.
- A. G. Gayubo, A. T. Aguayo, A. Alonso and J. Bilbao, Ind. Eng. Chem. Res., 2007, 46, 1981–1989 CrossRef.
- M. Bjørgen, S. Svelle, F. Joensen, J. Nerlov, S. Kolboe, F. Bonino, L. Palumbo, S. Bordiga and U. Olsbye, J. Catal., 2007, 249, 195–207 CrossRef.
- Y. Jiang, J. Huang, V. R. Reddy Marthala, Y. S. Ooi, J. Weitkamp and M. Hunger, Microporous Mesoporous Mater., 2007, 105, 132–139 CrossRef CAS.
- M. Guisnet and P. Magnoux, Appl. Catal., A, 2001, 212, 83–96 CrossRef CAS.
- P. Castaño, G. Elordi, M. Ibañez, M. Olazar and J. Bilbao, Catal. Sci. Technol., 2012, 2, 504–508 Search PubMed.
- M. Ibañez, B. Valle, J. Bilbao, A. G. Gayubo and P. Castaño, Catal. Today, 2012, 195, 106–113 CrossRef.
- P. Castaño, G. Elordi, M. Olazar, A. T. Aguayo, B. Pawelec and J. Bilbao, Appl. Catal., B, 2011, 104, 91–100 CrossRef.
- P. Castaño, A. Gutiérrez, B. Pawelec, J. L. G. Fierro, A. T. Aguayo and J. M. Arandes, Appl. Catal., A, 2007, 333, 161–171 CrossRef.
- E. Epelde, M. Ibañez, A. T. Aguayo, A. G. Gayubo, J. Bilbao and P. Castaño, Microporous Mesoporous Mater., 2014, 195, 284–293 CrossRef CAS.
- A. G. Gayubo, B. Valle, A. T. Aguayo, M. Olazar and J. Bilbao, Energy Fuels, 2009, 23, 4129–4136 CrossRef CAS.
- L. Pinard, S. Hamieh, C. Canaff, F. Ferreira Madeira, I. Batonneau-Gener, S. Maury, O. Delpoux, K. Ben Tayeb, Y. Pouilloux and H. Vezin, J. Catal., 2013, 299, 284–297 CrossRef CAS.
- M. Guisnet and P. Magnoux, Appl. Catal., 1989, 54, 1–27 CrossRef CAS.
- P. Castaño, J. Ruiz-Martinez, E. Epelde, A. G. Gayubo and B. M. Weckhuysen, ChemCatChem, 2013, 5, 2827–2831 CrossRef.
- P. B. E. Pretsch and M. Badertscher, Structure Determination of Organic Compounds, Springer, Berlin, 2009 Search PubMed.
- N. Arsenova, H. Bludau, W. O. Haag and H. G. Karge, Microporous Mesoporous Mater., 1998, 23, 1–10 CrossRef CAS.
- B. Valle, P. Castaño, M. Olazar, J. Bilbao and A. G. Gayubo, J. Catal., 2012, 285, 304–314 CrossRef CAS.
- Y. M. Chung, D. Mores and B. M. Weckhuysen, Appl. Catal., A, 2011, 404, 12–20 CrossRef CAS.
- A. Iglesias-Juez, A. M. Beale, K. Maaijen, T. C. Weng, P. Glatzel and B. M. Weckhuysen, J. Catal., 2010, 276, 268–279 CrossRef CAS.
- M. J. Wulfers, G. Tzolova-Muller, J. I. Villegas, D. Y. Murzin and F. C. Jentoft, J. Catal., 2012, 296, 132–142 CrossRef CAS.
- E. Borodina, F. Meirer, I. Lezcano-González, M. Mokhtar, A. M. Asiri, S. A. Al-Thabaiti, S. N. Basahel, J. Ruiz-Martinez and B. M. Weckhuysen, ACS Catal., 2015, 5, 992–1003 CrossRef CAS.
- D. Mores, J. Kornatowski, U. Olsbye and B. M. Weckhuysen, Chem. – Eur. J., 2011, 17, 2874–2884 CrossRef CAS PubMed.
- P. Castaño, A. Gutiérrez, I. Hita, J. M. Arandes, A. T. Aguayo and J. Bilbao, Energy Fuels, 2012, 26, 1509–1519 CrossRef.
- A. T. Aguayo, P. Castaño, D. Mier, A. G. Gayubo, M. Olazar and J. Bilbao, Ind. Eng. Chem. Res., 2011, 50, 9980–9988 CrossRef CAS.
- A. G. Gayubo, A. Alonso, B. Valle, A. T. Aguayo, M. Olazar and J. Bilbao, Fuel, 2010, 89, 3365–3372 CrossRef CAS.
- M. D. Argyle and C. H. Bartholomew, Catalysts, 2015, 5, 145–269 CrossRef CAS.
- S. Catarino, M. Madeira, F. Monteiro, F. Rocha, A. S. Curvelo-Garcia and R. B. de Sousa, J. Agric. Food Chem., 2008, 56, 158–165 CrossRef PubMed.
- R. Eriksson and T. Schatz, Appl. Clay Sci., 2015, 108, 12–18 CrossRef CAS.
- I. Batonneau-gener, A. Yonli, S. Hazael-pascal, J. Pedro Marques, J. Madeira Lopes, M. Guisnet, F. Ramoa Ribeiro and S. Mignard, Microporous Mesoporous Mater., 2008, 110, 480–487 CrossRef CAS.
- M. D. Gonzalez, Y. Cesteros and P. Salagre, Microporous Mesoporous Mater., 2011, 144, 162–170 CrossRef CAS.
- J. P. Marques, I. Gener, P. Ayrault, J. C. Bordado, J. M. Lopes, F. R. Ribeiro and M. Guisnet, Microporous Mesoporous Mater., 2003, 60, 251–262 CrossRef CAS.
- C. Breen, J. Madejová and P. Komadel, Appl. Clay Sci., 1995, 10, 219–230 CrossRef CAS.
- J. G. Thompson, Clay Miner., 1984, 19, 229–236 CAS.
- D. Ma, Y. Lu, L. Su, Z. Xu, Z. Tian, Y. Xu, L. Lin and X. Bao, J. Phys. Chem. B, 2002, 106, 8524–8530 CrossRef CAS.
- S. M. Maier, A. Jentys and J. A. Lercher, J. Phys. Chem. C, 2011, 115, 8005–8013 CAS.
- L. H. Ong, M. Dömök, R. Olindo, A. C. Van Veen and J. A. Lercher, Microporous Mesoporous Mater., 2012, 164, 9–20 CrossRef CAS.
- C. D. Wagner, W. M. Riggs, L. E. Davis and J. F. Moulder, Handbook of X-Ray Photoelectron Spectroscopy, Perkin-Elmer Corporation, Minnesota, 1979 Search PubMed.
- M. Ibáñez, M. Artetxe, G. Lopez, G. Elordi, J. Bilbao, M. Olazar and P. Castaño, Appl. Catal., B, 2014, 148–149, 436–445 CrossRef.
Footnote |
| † Electronic supplementary information (ESI) available. See DOI: 10.1039/c5cy00784d |
| This journal is © The Royal Society of Chemistry 2016 |

