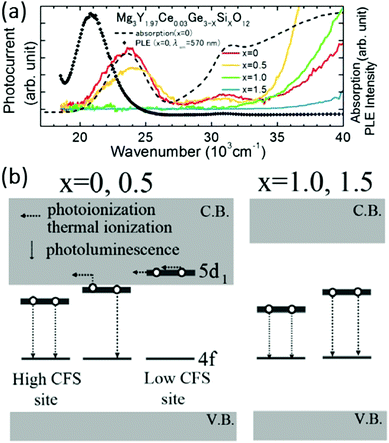
Ce3+-Doped garnet phosphors: composition modification, luminescence properties and applications
Zhiguo
Xia
*a and
Andries
Meijerink
*b
aThe Beijing Municipal Key Laboratory of New Energy Materials and Technologies, School of Materials Sciences and Engineering, University of Science and Technology Beijing, Beijing 100083, China. E-mail: xiazg@ustb.edu.cn; Fax: +86-10-8237-7955; Tel: +86-10-8237-7955
bCondensed Matter and Interfaces, Debye Institute for Nanomaterials Science, Utrecht University, Princetonplein 5, 3584 CC Utrecht, The Netherlands. E-mail: a.meijerink@uu.nl; Fax: +31-30-2532403; Tel: +31-30-2532202
First published on 11th November 2016
Abstract
Garnets have the general formula of A3B2C3O12 and form a wide range of inorganic compounds, occurring both naturally (gemstones) and synthetically. Their physical and chemical properties are closely related to the structure and composition. In particular, Ce3+-doped garnet phosphors have a long history and are widely applied, ranging from flying spot cameras, lasers and phosphors in fluorescent tubes to more recent applications in white light LEDs, as afterglow materials and scintillators for medical imaging. Garnet phosphors are unique in their tunability of the luminescence properties through variations in the {A}, [B] and (C) cation sublattice. The flexibility in phosphor composition and the tunable luminescence properties rely on design and synthesis strategies for new garnet compositions with tailor-made luminescence properties. It is the aim of this review to discuss the variation in luminescence properties of Ce3+-doped garnet materials in relation to the applications. This review will provide insight into the relation between crystal chemistry and luminescence for the important class of Ce3+-doped garnet phosphors. It will summarize previous research on the structural design and optical properties of garnet phosphors and also discuss future research opportunities in this field.
1. Introduction
1.1 Ce3+-Doped garnet phosphors: history and applications
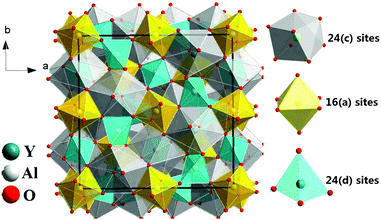
The yttrium aluminum garnet (Y3Al5O12 or YAG) and its compositional derivatives doped with Ce3+ form a class of highly efficient luminescent materials (phosphors) with a remarkably rich history of applications ranging from cathode ray phosphors and color correction phosphors in fluorescent tubes to their more recent application as scintillators, afterglow materials and as color converters in white light-emitting diodes (LEDs).1–8 YAG can be regarded as a typical example of the garnet structure possessing a cubic structure with Ia3d symmetry (Fig. 1). Even though the structure is cubic, the unit cell is not simple. The general formula for a perfect garnet is {A}3[B]2(C)3O12 where A, B and C are cations at different symmetry sites. The garnet structure can be described in terms of a 160 atom body-centered cubic unit cell. In this unit cell, depicted in Fig. 1, the A atoms occupy 24 (c) sites of 8-fold dodecahedral coordination, the B atoms are in 16 (a) sites with 6-fold octahedral coordination and C atoms occupy 24 (d) sites with 4-fold tetrahedral coordination.1,9 Each octahedron is connected to six tetrahedrons while each tetrahedron is connected to four [AlO6] octahedrons by sharing corners. It is the presence of the three different cation sites that give Ce3+-doped garnets their remarkable flexibility in tuning and optimization of luminescence properties for specific applications through cation substitution.The history of garnets dates back to the Bronze Age. Garnets have been used for thousands of years as abrasives, because of their hardness, and as gemstones, related to their high refractive index and beautiful coloring through incorporation of transition metal ions into the tetrahedral or octahedral sites. The English word Garnet originates from the Latin “Granatum”, which means many grains and is related to the pomegranate fruit, having many red seeds that resemble some of the dark red garnet gemstones in structure and color.
The scientific history of garnet-type compounds begins in 1928 when Menzer assigned the garnet structure to the space group Ia3d.10 In 1967, Blasse and Bril were the first to report Ce3+-doped YAG (YAG:Ce3+) as a new phosphor for flying-spot cathode ray tubes (CRTs).1 The observation of yellow emission from Ce3+ was remarkable as usually ultraviolet (UV) or blue emission is observed for Ce3+. The bright yellow emission for Ce3+ in the YAG was explained by a strong crystal field splitting but even today the reason for the low energy of the emitting 5d state of Ce3+ in garnets is not completely understood. The unique combination of a short lived (ns decay time) efficient yellow emission and a strong absorption in the blue spectral region has been the basis of the many applications of Ce3+-doped garnets. The strong absorption in the blue region gives YAG:Ce3+ its characteristic yellow body color. Following its application as a CRT phosphor and for fast electron detection in scanning electron microscopes, van Kemenade et al. described the application of YAG:Ce3+ in low-pressure mercury vapor discharge lamps for color conversion of blue emission from the mercury discharge to yellow light.11 In the 1990s, YAG:Ce3+ and LuAG:Ce3+ (Lu3Al5O12:Ce3+) were proposed as fast and efficient scintillator materials.12,13 Single crystalline disks of YAG:Ce3+ were used to monitor and control the dose of VUV radiation in wafer steppers. The biggest commercial application is more recent. The discovery of blue LEDs has revolutionized the lighting market as was recognized by awarding the 2014 Nobel Prize in physics for the development of blue LEDs.14 Solid-state lighting plays a vital role in the lighting and display industries and will continue to create value in the future.15,16 Following the discovery of the blue LEDs, the possibility for white LEDs (w-LEDs) was pioneered at the Nichia Chemical Company and the first w-LEDs became commercially available in 1997.17 For the conversion of the blue LED emission the yellow light emitting YAG:Ce3+ phosphor was selected in combination with 460 nm blue-emitting InGaN LED chips. Until now, YAG:Ce3+ has been the most widely used phosphor in w-LEDs.18–22
Garnets possess a cubic crystal structure but with a complex arrangement of different cations in the unit cell. Because of this the garnet phosphors are unique in their tunability of the luminescence properties through variations in the {A}, [B] and (C) cation sublattice. The dodecahedral A site can be occupied by rare earth ions, such as Y3+, Lu3+, Gd3+, Tb3+ or La3+ ions, or divalent cations, such as Ca2+; the octahedral B site can be occupied by Al3+, Ga3+, Sc3+, Sb3+, In3+, and even ions with a different charge such as Mg2+ or Mn2+ while the tetrahedral C site is typically occupied by Ga3+ or Al3+, but can also contain differently charged ions as Si4+, Ge4+ or Mn2+ while maintaining the garnet crystal structure, and many other substitutions are also possible.4,23 The very wide range of solid solution compositional variation enables the tuning and optimization of optical properties in relation to specific applications. The Ce3+ emission color can be tuned from the green to the orange-red spectral region through variation in the crystal field splitting and the nephelauxetic effect (see Section 1.2 for a detailed description of these effects). Therefore, Ce3+-doped garnet phosphors possess a long and rich history on structure modification and luminescence studies.
Ce3+ activated garnet-based phosphors have been used for a wide variety of applications in different fields.18–22 This makes the Ce3+-doped garnets unique. Fig. 2 presents some typical applications of Ce3+-doped garnet phosphors, including but not limited to indoor and outdoor lighting, backlights in displays, solid-state lasers, flying-spot scanning, traffic lights, automobile lights, plasma display panel devices, afterglow materials, dye industry, scintillators for medical imaging and homeland security, transparent ceramics, and so on. Table 1 summarizes some important Ce3+-doped garnet phosphors including their chemical composition, photoluminescence emission (PL) and excitation (PLE) wavelengths and their corresponding applications.24–54 More details on the garnet phosphors mentioned above, the background to understand the preparation method, variation in luminescence characteristics and their applications can be found in the following sections and the corresponding references.55–59
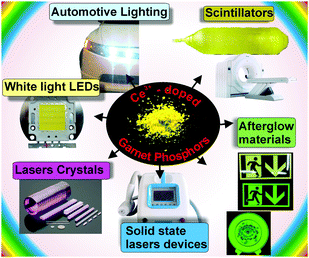 | ||
| Fig. 2 Some representative application fields of Ce3+-doped garnet phosphors including white light LEDs, scintillators, afterglow materials, laser crystals, and their corresponding applications. | ||
| Application | Chemical composition | λ ex (nm) | λ em (nm) | Ref. |
|---|---|---|---|---|
| w-LED phosphors | Y3Al5O12:Ce3+ | 470 | 532 | 1 |
| Lu3Al5O12:Ce3+ | 440 | 505 | 24 | |
| Ca3Sc2Si3O12:Ce3+ | 455 | 505 | 26 and 27 | |
| Tb3Al5O12:Ce3+ | 470 | 553, 620 | 28 and 29 | |
| Y3Al4GaO12:Ce3+ | 450 | 519 | 30 | |
| Y3Sb2Al3O12:Ce3+ | 465 | 528 | 31 | |
| Y3Al5−xSixO12−xNx:Ce3+ (x = 0.1) | 470 | 620–630 | 32 and 33 | |
| Y3Mg2AlSi2O12:Ce3+ | 440 | 600 | 34–36 | |
| CaLu2Mg2(Si,Ge)3O12:Ce3+ | 470 | 605 | 37 and 38 | |
| CaLu2Al4SiO12:Ce3+ | 450 | 510–530 | 39 | |
| Mg3Y2Ge3O12:Ce3+ | 466 | 555 | 4 and 40 | |
| MgY2Al4SiO12:Ce3+ | 452 | 566 | 41 | |
| Lu3(Al,Mg)2(Al,Si)3O12:Ce3+ | 450–462 | 542–571 | 42 | |
| Ca2GdZr2(AlO4)3:Ce3+ | 417 | 500 | 43 | |
| Ca2LaZr2Ga3O12:Ce3+ | 430 | 515 | 44 | |
| Ca3Hf2SiAl2O12:Ce3+ | 400 | 508 | 45 | |
| Scintillators | Lu3Al5O12:Ce3+ | 440 | 505 | 46 and 47 |
| Tb2.2Lu0.8Al5O12:Ce3+ | 459 | 565 | 48 | |
| (Lu,Gd)3(Ga,Al)5O12:Ce3+ | 345 | 530 | 49 | |
| Gd3(Al,Ga)5O12:Ce3+ | 445 | 540–565 | 50 | |
| Afterglow phosphors | Y3Sc2Ga3O12:Ce3+ | 440 | 500 | 51 |
| Y3Sc2Ga3−xAlxO12:Ce3+ | 414 | 503 | 52 | |
| Mg3Y2(Ge1–xSix)3O12:Ce3+ | 455 | 580–595 | 53 | |
In the various applications of the Ce3+-doped garnets shown in Fig. 2, different properties are important and require optimization. To be able to appreciate the following sections in which the tuning of the optical properties of Ce3+-doped garnets is reviewed in relation to their various applications, it is good to provide a brief description of the different applications of the phosphors and the requirements that are important in each of these.
In the first publication on YAG:Ce3+ in 1967 by Blasse the potential application in a flying spot camera was mentioned. A flying spot camera uses a monochrome CRT. The luminescent material applied in dots or bars (pixels) on the inside of the glass tube is excited by a high energy electron beam (20–50 keV electrons) that scans the inside of the glass CRT (see Fig. 3). The high energy of the electrons is converted into light (cathode luminescence) by the phosphor and a 2D image is obtained by a rapid scan of all phosphor pixels. In a flying spot camera a short luminescence decay time is required to allow for a high image capture rate. The short ns lifetime of the Ce3+ emission in YAG:Ce3+ is particularly advantageous for this application. In a conventional color television, a CRT with three different ∼100 μm sized bars or dots with a red, green and blue emitting phosphor is used for each pixel. The energy of the fast electrons is converted into blue, green or red light by the phosphors in each pixel and a color image is obtained. Operating parameters for CRT phosphors involve:
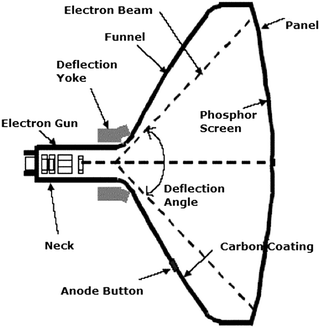 | ||
| Fig. 3 Schematic of a cathode ray tube. An electron gun emits electrons that are accelerated over 30–50 kV. The high energy electron beam is deflected by two sets of electromagnets for horizontal and vertical steering of the beam to scan every pixel with a phosphor (e.g. YAG:Ce3+) converting the energy of the high energy electrons to visible light. By varying the intensity of the exciting beam for every point on the screen an image is written that can be observed through the glass. (Reprinted with permission from ref. 62, copyright 2007, Elsevier.) | ||
• Efficient excitation by electron beams
• Stability under high energy electron excitation
• No afterglow to prevent ghost images
• Operating temperature below 50 °C
• Vacuum tube to protect against moisture
A challenge for the performance of YAG:Ce3+ in CRT applications was afterglow problems. Even though the radiative decay rate of the yellow Ce3+ d–f emission is short (60–70 ns) the presence of defects results in afterglow related to defects in the garnet host and extensive studies on defects and traps in YAG:Ce3+ have been conducted in the 1970s.60,61
The second commercial application of YAG:Ce3+ was as a color converter in compact fluorescent tubes (CFLs) and dates back to the 1980s.11 In a (compact) fluorescent tube a low pressure mercury discharge produces UV radiation, mainly at 254 nm, but also some vacuum ultraviolet (VUV) radiation (185 nm) and a small portion of blue (436 nm) light are emitted. Conversion of the UV radiation into blue, green and red light by a blend of three phosphors (typically BaMgAl10O17:Eu2+ for blue, LaPO4:Ce3+,Tb3+ for green and Y2O3:Eu3+ for red) coated on the inside of the glass tube produces white light. However, in CFLs the relative fraction of 436 nm blue light is higher than in linear tubes and too high to make warm white light. To solve this problem YAG:Ce3+ was added to the phosphor blend to absorb part of the 436 nm light and convert this to yellow. The red, green and blue phosphors in fluorescent tubes absorb UV radiation but not the blue 436 nm mercury line. Conditions for phosphors in fluorescent tubes are
• Efficient excitation by mercury lines (mainly 254 nm)
• Relatively low excitation density (large phosphor area)
• Operating temperatures typically around 50 °C
• Chemical stability against reaction with mercury gas
• Long-term stability (typical operating time 10![[thin space (1/6-em)]](https://www.rsc.org/images/entities/char_2009.gif) 000 h)
000 h)
• Sealed glass tube protects against moisture.
The application of YAG:Ce3+ as a color converter in specialty CFLs was a niche application and did serve to improve the color temperature of deluxe CFL lamps.
In the 1990s extensive research started on Ce3+-doped garnets for their application as scintillator materials. Medical X-ray imaging techniques like conventional X-ray imaging (with intensifying screens) and advanced techniques like CT (computed tomography) and PET (positron emission tomography) rely on luminescent materials that convert X-rays transmitted by the patient/object that is imaged into light for detection by photographic films, charge coupled devices or fast photodetectors. Requirements for X-ray phosphors depend on the specific imaging technique and include
• High density for efficient absorption of X-rays
• High conversion efficiency of X-ray photons into light
• No afterglow (to prevent ghost images)
• Operating temperature below 50 °C
• Short luminescence lifetime (especially for PET)
• Radiation stable
• Transparent (for PET, high energy physics)
In Fig. 4 medical imaging using a scintillator is illustrated. The short ns emission lifetime of the Ce3+ d–f emission is particularly suitable for PET which relies on the simultaneous detection of two 512 keV γ-rays that are emitted at a 180° angle following electron–positron annihilation. The shorter the response time of detection, the higher will be the accuracy with which the location of the positron emitter can be determined. The density of the YAG is 4.56 g cm−2, and its performance as a scintillator improves by increasing the density (and thus the stopping power for X-rays) to 6.73 g cm−2 for LuAG by replacing the lighter Y3+ with the heavier Lu3+.
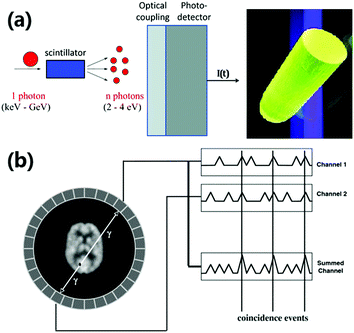 | ||
| Fig. 4 (a) Operating principle of a scintillator converting one high energy X-ray photon into a large number of lower energy visible photons that are detected by a photodetector (Reproduced with permission from ref. 63, copyright 2015, Wiley.), and a photograph of a LuAG:Ce3+ scintillator crystal showing green Ce3+ emission under UV-excitation (Reproduced with permission from ref. 64, copyright 2013, Elsevier.), (b) schematic of a PET scanner with a patient surrounded by a ring of scintillator crystals and photodetectors for coincident detection of two 512 keV photons emitted at a 180° angle in positron annihilation events (Reprinted with permission from ref. 65, copyright 2008, IOP Publishing). | ||
The cubic crystal structure of garnets is beneficial for making transparent scintillator crystals which are used in PET and also in X-ray and γ-ray detectors in high energy physics. Because of the isotropic refractive index for cubic materials, transparent ceramics can be formed by pressing micro- or nanocrystalline precursor materials.66–68 The transparent ceramics have lower cost and higher mechanical strength compared to single crystals.
The final and by far the biggest commercial application of YAG:Ce3+ is in white light LEDs. The field of w-LEDs started with the discovery of the blue (In,Ga)N LED in 1993.14 Before that only longer wavelength (IR, red, green) LEDs existed with a reasonable efficiency. With the discovery of blue (In,Ga)N LEDs, it became possible to generate white light with LEDs. Blue, green and red LEDs were combined which made it possible to generate LED based white light, but color stability and reproducibility were hard to realize. Next, researchers started considering making white light by placing luminescent materials directly on top of the blue LED. Partial conversion of blue light to red and green or yellow/orange yields white light (see Fig. 5). The operating conditions for LED phosphors are challenging. In addition to the efficient conversion of blue light from the LED chip into longer wavelength green and red or yellow/orange light, the LED-specific conditions include
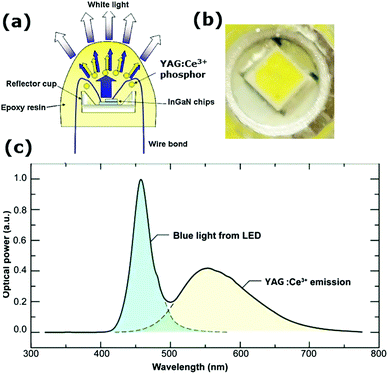 | ||
| Fig. 5 (a) Schematic of a w-LED. Blue emission from a (In,Ga)N LED is partially absorbed and converted to yellow emission by a thin layer of YAG:Ce3+ phosphor applied on top. (Reproduced with permission from ref. 8, copyright 2010, Elsevier). (b) The yellow phosphor can be observed in the close-up picture of a w-LED flashlight. (c) The emission spectrum showing the transmitted blue light and phosphor converted yellow light results in white light. (Reproduced with permission from ref. 69, copyright 2014, Wiley.) | ||
• Long-term stability under extreme excitation densities
• High temperature stability of the material and luminescence (phosphor temperature can reach 100–200 °C)
• Small thermal shift of the emission maximum
• Short emission lifetime to prevent saturation
• Chemical stability (against moisture at high T)
The small area of the blue (In,Ga)N chip (<1 mm2) results in very high excitation densities. For a 1 W LED the excitation density can exceed 105 W cm−2, which is 100–1000 times higher than that for other applications discussed while typical operating times are 30![[thin space (1/6-em)]](https://www.rsc.org/images/entities/char_2009.gif) 000 h or more. In 1996 YAG:Ce3+ was discovered as a w-LED phosphor, and a year later the first commercial YAG:Ce3+ based w-LEDs were introduced.17 Still, today YAG:Ce3+ is the most widely applied w-LED phosphor, and the yellow-colored YAG:Ce3+ powder can be observed in e.g. w-LEDs in mobile phone flashlights (see Fig. 2).
000 h or more. In 1996 YAG:Ce3+ was discovered as a w-LED phosphor, and a year later the first commercial YAG:Ce3+ based w-LEDs were introduced.17 Still, today YAG:Ce3+ is the most widely applied w-LED phosphor, and the yellow-colored YAG:Ce3+ powder can be observed in e.g. w-LEDs in mobile phone flashlights (see Fig. 2).
Combining the blue diode emission and yellow emission from YAG:Ce3+ gives rise to rather cold white light. To improve the color temperature and make a warmer white LED, orange or red emitting phosphor can be added. In Fig. 6 the black curve marks the color temperature as defined by the position of a black body radiator with a specific temperature. Red shifting the Ce3+ emission will result in a shift to the right on the black body locus (warmer white). In garnets, cation substitution is used to shift the emission spectrum and will be discussed in this review. In addition, a large variety of alternative (non-garnet) LED phosphors have been developed and are applied in w-LEDs, often in combination with YAG:Ce3+ to change the color temperature as well as to improve the color rendering. The color rendering index reflects how well colors are reproduced in comparison to colors perceived in sunlight. A broader emission spectrum, including the red spectral region, will give superior color rendering.
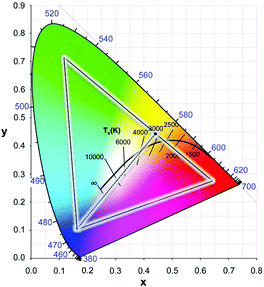 | ||
| Fig. 6 CIE chromaticity diagram which quantifies emission colors of light sources in x, y coordinates. The outside line marks saturated (monochromatic) colors in the visible region (380–700 nm). For any emission spectrum the color coordinates x and y can be calculated. The central black line shows the black body curve representing the x, y coordinates of a black body radiator with temperatures indicated. The line is situated in the central region of the diagram that corresponds to white light. Higher temperatures shift the spectrum to the blue (cool white). The triangle marks the color gamut required in color displays, which is obtained by using three phosphors with color coordinates at the corners of the triangle. The dotted line between the blue and yellow saturated colors demonstrates how white is obtained by mixing blue and yellow emission in the correct ratio. (Reproduced with permission from ref. 69, copyright 2014, Wiley.) | ||
1.2 Luminescence theory of Ce3+ in garnet phosphors
Luminescence is the phenomenon in which an ion, a molecule or an atom returns to the ground state by the spontaneous emission of photons after they are promoted into excited states by absorbing photons of appropriate energy. Only a limited number of elements have been used as optically active centers in luminescent materials (also known as phosphors). The largest group of luminescent centers applied in light emitting materials for technological applications is the rare earth ions, which comprises the group of lanthanides, yttrium and scandium.70–73 The series of lanthanides (Ln) is situated at the bottom of the periodic table, and it is the group of elements for which the inner 4f shell is filled with electrons. The most stable valence state is 3+ and the electron configuration of the Ln3+ ions is 4fn5s25p6, where n is the number of electrons in the 4f inner shell and can vary from 0 (empty 4f shell) to 14 (4f shell completely filled). The Ce3+ ion has the simplest electron configuration among the luminescent rare earth ions with one 4f electron: 4f1. The luminescence properties of Ce3+ result from optical transitions between the 4f1 ground state and the 5d1 excited state. The 4f1 ground-state configuration splits into two sublevels, 2F5/2 and 2F7/2, and these two sublevels are separated by about 2000 cm−1 as a result of spin–orbit coupling. This is the reason for the double structure usually observed in the Ce3+ emission band. The 5d1 excited state configuration is split into two to five components by the crystal field. The number of 5d levels depends on the crystal field symmetry.The crystal field splitting of the 5d levels of the Ce3+ ion in a different coordination has been extensively investigated,74–79 also based on the spectroscopic data for lanthanide activated garnets RE3Al5O12 (RE = Gd, Y, Lu).80 Ce3+-Doped compounds generally show 5d–4f emission in the near UV, but in the case of high crystal field splitting, such as in garnets, visible emission is sometimes observed. Since garnet structure compounds are stable from chemical and photochemical points of view, phosphors possessing a garnet crystal structure generally show high stability. Moreover, the garnet crystal structure generates a strong crystal field strength on the dodecahedral site where the Ce3+ ions are incorporated and therefore, the d–f emission is shifted to the green,26–29,81 yellow,1 or even orange-red37–39 spectral region depending on the lattice composition.
The most important effects on Ce3+ and the interaction with a host lattice are the crystal field splitting and the nephelauxetic effect. To understand these effects we consider the optically active dopant (cat)ion and its neighboring (an)ions, also called ligands. Fig. 7 gives a scheme of a luminescent center consisting of a dopant ion O coordinated to six ligand ions L. Typically as an example the octahedral six-coordinated center, OL6, is considered and this is also called the optically active center as the optical transitions are localized on the central ion O and the surrounding ligands L. For a given dopant ion, the absorption and emission properties are significantly affected by the host lattice. This is because the energy level structure of a free ion O is altered by the interaction with the nearest neighboring ions L in the lattice by the nature of chemical bonds between O and L (i.e., covalency, bond length, coordination number, symmetry, etc.).82,83 Here we will focus on the luminescent center Ce3+ in the 24 (c) sites of 8-fold coordination for the garnet structure but the same principles apply as for the OL6 center. The Ce3+ emission is strongly affected by the host lattice through interaction with the ligands. As was mentioned, the electronic energy levels of an activator ion in a crystal differ greatly from those of a free ion.84 For example, the difference in energy between the 5d and 4f levels of gaseous (free) Ce3+ ions is in the high energy UV region (∼200 nm, 50![[thin space (1/6-em)]](https://www.rsc.org/images/entities/char_2009.gif) 000 cm−1), whereas for Ce3+ ions in a crystal, this energy difference can range from UV to the lower energy visible region, depending on the host crystal.78
000 cm−1), whereas for Ce3+ ions in a crystal, this energy difference can range from UV to the lower energy visible region, depending on the host crystal.78
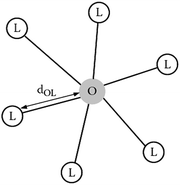 | ||
| Fig. 7 An optically active center, OL6, containing a doping ion O that is coordinated to six ligand ions L. (Reprinted with permission from ref. 82, copyright 2005, Wiley.) | ||
When an activator ion is placed in a host crystal, two major effects dictate the photoluminescence properties: the centroid shift (determined by the so-called nephelauxetic effect) and the crystal field splitting of the 5d orbital. Both effects will contribute to a decrease in the energy difference between the lowest 5d level and the 4f ground state, which is referred to as the redshift. The two effects mentioned above are illustrated for Ce3+ in Fig. 8a, with the total redshift being labeled D. Both the crystal field and nephelauxetic effect influence the energy for the electron in the 5d orbitals of the activator ion, whereas the well-shielded 4f states are not strongly affected. The position of the 5d levels can change by tens of thousands of wave numbers from one compound to another. The centroid shift is a decrease in the average energy of all the 5d levels of the activator ion and is caused by a decrease in the inter-electron repulsion. The centroid shift can be determined from the position of all 5d levels and is defined as the (degeneracy weighted) average energy of all 5d levels. This average energy is known as the bary center. The centroid shift increases with increasing covalency of the bond between the Ce3+ ion and the surrounding anions, i.e. with increasing polarizability and decreasing average anion electronegativity with as a general trend a decrease of the energy from F− to O2− to N3− or S2− ligand coordination of Ce3+. The series of anions in which the centroid shift increases is known as the nephelauxetic series. As the degree of covalency in bonding between the activator ion and surrounding anions increases, the energy for an electron in the 5d orbital is reduced due to stabilizing effects of the covalent bond. The name ‘nephelauxetic’ originates from the Greek for ‘cloud expanding,’ which refers to increased delocalization (expansion) of the dopant d orbital (‘electron cloud’) as a result of increased covalency.
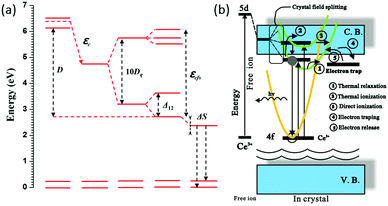 | ||
| Fig. 8 (a) Energy level structure of Ce3+ showing the depression D of the lowest 5d level with respect to the free ion energy levels of Ce3+. Covalency (nephelauxetic effect) gives rise to a centroid shift εc of the degeneracy weighted average 5d energy (known as the bary center). The crystal field splitting of the 5d state gives rise to a further red shift of the emitting lowest energy 5d state. In addition to the 10Dq splitting by the cubic crystal field there is an additional splitting Δ12 of the lower eg and also a splitting of the higher t2g state because of a tetragonal distortion for Ce3+ in garnets. Finally, there is a small additional red shift of the emission due to the Stokes' shift ΔS; (b) schematic model of two thermal quenching mechanisms of the Ce3+ emission by (1) cross-over to the ground state parabola or (2) electron transfer to the CB from 5d levels in or close to the CB. (Reprinted with permission from ref. 86, copyright 2013, Elsevier.) | ||
The second effect, crystal field splitting, is the difference in energy between the highest and lowest 5d levels and is again an effect of the host crystal. The magnitude of crystal field splitting depends on the bond lengths from the activator ion to the coordinating anions, the molecular orbital overlap or the degree of covalency between the activator ion and its ligands, the coordination environment, and the symmetry of the activator site. For a simple point charge model it has been derived that the crystal field splitting varies with the distance between the central cation and the ligands as80,85
 | (1) |
The luminescence of Ce3+ has been extensively studied in the garnet structure. Substitution of a constituent element of the host crystal by another element of different ionic radius will increase or decrease the lattice constants of the host crystal and change the ligand coordination parameters while differences in the chemical nature can affect the covalency of the bonds as well as the positions of the valence band (VB) and conduction band (CB) edges of the host. These changes will influence the crystal field splitting for the activator, will cause a spectral shift in the Ce3+ luminescence and can influence the thermal quenching behavior of the luminescence. Because of shielding by the outer 5s and 5p electrons, the energy level structure for the 4f ground state of Ce3+ is fairly insensitive to host and crystal field effects and is depicted as two levels separated by ∼2000 cm−1.
The Ce3+ emission usually varies from the ultraviolet to the blue spectral region in fluorides and oxides. In covalent and strong crystal field surroundings, the 5d orbital shifts to lower energies, resulting in yellow and even red emission colors of Ce3+ as has been observed for Ce3+ in sulfides and nitrides.86–89 Crystal field splitting generates two to five 5d components depending on the site symmetry of the site in the host lattice where Ce3+ is incorporated. In cubic symmetry the 5d state splits into two levels (eg and t2g) that will split further for deviations from cubic symmetry. The unique long wavelength emission (green-yellow-orange) for Ce3+ in garnets is, although not fully understood, ascribed to an additional splitting Δ12 of the eg crystal field component. The crystal field splitting for Ce3+ is schematically depicted in Fig. 8a. The additional splitting of the eg state results in a lower energy 5d1 level and a higher energy 5d2 level separated by ∼1 eV (8000 cm−1). It is because of this large splitting that the emission from the lowest energy 5d1 state is in the green-yellow-orange spectral region. The larger the distortion from cubic symmetry, the more the emission shifts to lower energies.
An important mechanism to tune the Ce3+ emission wavelength is through changes in Δ12 by varying the distortion of the cubic coordination. In this way, both the excitation and emission energies can be tuned through variations in the host crystal composition and structure. As mentioned above, the garnet host lattice offers great flexibility by the substitutions at the A, B or C cation sites for obtaining the perfect garnet structure of {A}3[B]2(C)3O12. Because these cation sites can be substituted by various types of ions, a wide range of garnet solid solutions can be formed with varying centroid-shifts and crystal field strengths for the Ce3+ ion.21,79 Mostly it is observed that the crystal field splitting decreases when the ionic radius increases for the host cation for which the optically active ion substitutes. A larger cation site comes with a larger cation–ligand distance, reducing Dq, as shown in (1). However, for Ce3+ in garnets it has been shown that when the radius of the host cation on the dodecahedral site increases, the crystal field splitting also increases and the emission of Ce3+ shifts to longer wavelengths. On the other hand, the increased radius of ions occupying tetrahedral and/or octahedral sites leads to emission shift towards shorter wavelengths. This is because of the large influence of the splitting Δ12 on the emission wavelength. The Δ12 splitting is not necessarily related to the ion–ligand distance but more affected by the distortion from cubic symmetry which explains the sometimes counterintuitive trends of host cation substitution at the 5d–4f emission wavelength. In the next section this will be extensively discussed with a large variety of cation substitutions. In the final section on modelling it will be shown that theoretical calculations point to a role of electronic effects in explaining the increase in crystal field splitting upon substitution with larger cations on the dodecahedral site.
We can see from Fig. 8a that the emission wavelength depends on both the overall 4f–5d separation and the crystal field splitting of the d-levels. The 4f–5d separation is approximately constant for some specified systems and the crystal field effect plays an important role in shifting the emission. The compositional substitution influences not only the crystal field strength but also the electronic band structure of the garnet host. Therefore, the relative energies of the 5d levels of Ce3+ and the conduction band will vary and this is important in the discussion of luminescence properties such as quenching behaviors and persistent luminescence. Extensive work by Ueda et al. has considered the behavior of excited electrons in the 5d levels of garnets in which the 5d levels are close to the conduction band, shown schematically in Fig. 8b.86 They have combined the energy levels of Ce3+, the positions of the VB and the CB, and the configuration coordinate diagram of Ce3+ in order to understand the luminescence processes of Ce3+ in garnet phosphors, especially the quenching process. There are three possible quenching processes: (1) thermal relaxation from the 5d potential curve (parabola) to the 4f ground potential curve through the crossing point based on the configurational coordinate model, (2) thermal ionization from the emitting 5d1 levels to the conduction band with some activation energy (thermally assisted photoionization of the Ce3+ ion) and (3) direct electron transfer from (higher) 5d levels to the conduction band with no activation energy (photoionization of the Ce3+ ion) prior to relaxation to the lowest 5d1 state. The electrons transferred to the conduction band can be (4) captured by electron traps and then (5) released from the traps through a thermally activated process which is the mechanism behind afterglow or thermally stimulated luminescence. In addition, energy transfer to defects or impurities, possibly via energy migration over multiple Ce3+ ions, can also contribute to quenching. These quenching processes are not intrinsic to the material and could be avoided by optimizing synthesis conditions. It is important to distinguish between intrinsic quenching, a material property related to the energy level structure of the Ce3+ ion and the host lattice, and extrinsic quenching processes related to the presence of energy transfer and migration to defects and impurities which occur especially at high Ce3+ concentrations and strongly depend on the synthesis procedure.
The optical properties of Ce3+ in different garnet compounds vary. Although the basic luminescence theory and luminescence mechanism are known, questions remain, such as: how can the compositional substitution and the corresponding modification influence the Ce3+ luminescence in different garnet compounds? How can we find new and efficient Ce3+-doped garnet phosphors? What determines the luminescence quenching at elevated temperatures and how can we reduce quenching processes? There are still many challenges in this field. We will summarize important results reported for Ce3+ luminescence in a variety of garnet phosphors and propose models to explain the luminescence behavior in relation to structure in the following section. The amount of research in this field is still expanding and it is not possible to review all findings.
2. Ln3(MIV,MVI)5O12-based garnet phosphors and their structural modification
2.1 Structural modification on Ln sites for LnAG:Ce3+ (Ln = Y, Lu, Gd and Tb) phosphors
In this section we will review the influence of substituting the trivalent ion on the largest cation site in the garnet host: the dodecahedral site. Trivalent cerium ion doped rare earth aluminum garnets with the general formula Ln3Al5O12:Ce3+ (Ln = Y, Lu, Gd and Tb) (LnAG:Ce3+) form a very important class of functional optical materials. They have found numerous different applications over the years.1–5 Presently, LnAG:Ce3+ phosphors are intensively studied for their application as LED-phosphors, and Ce3+-doped Y3Al5O12 is the most famous and first commercially applied phosphor in w-LEDs owing to its excellent optical, physical and chemical properties. As mentioned above, YAG:Ce3+ can be used to convert part of the blue emission from an (In,Ga)N LED into yellow emission, and together with the transmitted blue light this produces white light. In many white light LEDs, including those in mobile phone lights, the yellow powder can be clearly recognized by looking in the LED (when turned off).YAG:Ce3+ combines good chemical and thermal stability with high luminescence efficiency, although the thermal quenching of luminescence remains an issue. Blasse et al. made systematic spectroscopic investigations on YAG:Ce3+ in 1967.1 Owing to the strong crystal field splitting of the 5d energy level of Ce3+, excitation of YAG:Ce3+ from the 2F5/2 level to the lowest-energy 5d orbital (5d1) occurs in a broad spectral range in the blue spectral region with a maximum at ∼460 nm, and emission occurs at ∼540 nm from the transition of Ce3+ from the 5d1 orbital to the two 4f levels split by spin–orbit coupling into 2F5/2 and 2F7/2. Fig. 9 gives the photoluminescence excitation and emission spectra, and diffuse reflectance spectra of YAG:Ce3+ phosphors with different Ce3+ concentrations. The two main excitation bands at 340 and 460 nm are ascribed to the electronic transitions from the ground state (2F5/2) to different energy levels of the 5d excited state of Ce3+ (5d2 and 5d1, respectively), as also demonstrated by the diffuse reflectance spectra in Fig. 9(b). Although the 5d orbitals of Ce3+ can be split into a maximum of five energy levels, only the lowest two have been assigned with certainty. A third weak band in the 250–280 nm range has been assigned both to the Ce3+ 5d3 absorption and to the impurity/defect absorptions. Later work by Tanner indicated that this is a defect related band.90 Higher energy bands between 200 and 230 nm have been identified in several publications as higher energy t2g related bands. The tentative positions of the five 5d bands for YAG:Ce3+ are around 460, 340, 225, and 205 nm, respectively.90 The fifth band is between 225 and 205 nm, probably close to the 225 nm band, and is weak. The intense absorption peak around 460 nm matches very well with the blue emission of InGaN-based LEDs, indicating that the YAG:Ce3+ phosphor can absorb the blue light efficiently and convert it into visible light at a longer wavelength range. The emission spectrum of YAG:Ce3+ shows a very broad yellow band with the emission peak at near 532 nm for the lowest Ce3+ concentrations and a full width at half maximum (FWHM) of ∼120 nm, which can be assigned to the 5d1 → 4f electronic transitions.
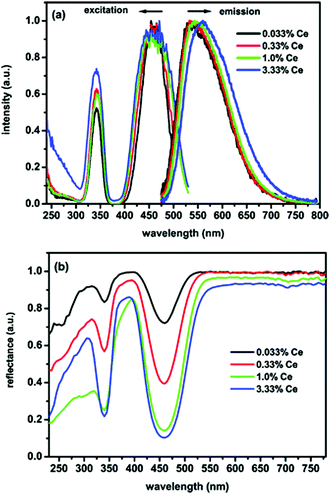 | ||
| Fig. 9 (a) Photoluminescence excitation (PLE) and emission (PL) spectra of YAG:x%Ce3+ (concentration in mole% relative to Y3+) for different Ce3+ concentrations (x), (b) diffuse reflectance spectra of the same YAG:Ce3+ samples. (Reproduced with permission from ref. 15, copyright 2009, American Chemical Society.) | ||
For the application of YAG:Ce3+ in w-LEDs the combination of blue and yellow results in cool white light and spectral shifting of the Ce3+ emission to the red spectral region is desired to create warmer white light, as discussed above. A simple way of red shifting the emission is increasing the Ce3+ concentration. In Fig. 9(a) it can be observed that the emission maximum of the 5d1 → 4f emission of Ce3+ shifts from ∼530 nm for 0.033% Ce3+ to ∼560 nm for 3.33% Ce3+. Two effects contribute to the spectral shift: reabsorption of the short wavelength Ce3+ emission and energy migration to slightly distorted Ce3+ ions. The red shift because of reabsorption occurs as there is an overlap between the short wavelength side of the Ce3+ emission and the long wavelength tail of the Ce3+ absorption. In Fig. 9 the spectral overlap in the 480–530 nm can be clearly observed. As a result, with increasing Ce3+ concentration, the probability for absorption of the short wavelength side of the Ce3+ emission band increases. After reabsorption, emission is distributed over the full width of the Ce3+ emission band resulting in an overall decrease of the short wavelength emission and a red shifted emission. The higher the number of reabsorption events, the larger the red shift. The second effect is caused by energy transfer between neighboring Ce3+ ions. For high Ce3+ concentrations this leads to energy migration of the excitation energy and the distorted Ce3+ ions, located close to a defect, can experience a larger crystal field splitting, shifting the lowest 5d state to a lower energy. Excitation energy is trapped at these distorted sites as a result of energy migration, and this effect also contributes to a red shift of the Ce3+ emission at elevated Ce3+ concentrations. The energy migration increases with temperature as the spectral overlap increases as a result of thermal broadening of the excitation and emission bands. Thermally activated energy migration to quenching sites is responsible for a lower thermal quenching temperature for highly doped YAG:Ce3+ phosphors as will be discussed below.
A second approach to shift the Ce3+ emission is through cation substitution. Empirically it was observed that the emission band of Ce3+ in garnets shifted towards the blue region when the dodecahedral site (Y3+) ions were substituted by smaller Lu3+ ions, and towards the red region when Y3+ ions were replaced by larger ions such as La3+, Gd3+ and Tb3+.91–93 Therefore, Ce-activated aluminum garnet phosphors can be prepared with Gd, Tb or Lu instead of Y in order to obtain color-tunable garnet phosphors with emission colors varying from green to orange. This approach is used to alter the emission color, for example a red shift is found for Gd3Al5O12:Ce3+ (GAG:Ce3+) compared with YAG:Ce3+, and has been applied to shift the spectrum of white LEDs to obtain warmer white light. Unfortunately, the red shifted emission of Ce3+ in these garnet compounds has worse thermal quenching behavior and lower quantum efficiency compared with YAG:Ce3+. The origin of the lower thermal quenching temperature for Ce3+ in the GAG will be discussed below. Consequently, the GAG is not as widely applied as a host as the YAG also because it is very difficult to synthesize by conventional methods.94,95 The substitution of ions at the dodecahedral site induces lattice expansion or contraction and changes the local crystal field interaction of Ce. An example is presented in Fig. 10(a), clearly showing the red shift of the Ce3+ emission band with the substitution of Gd3+ for Y3+. It can be seen that the emission peak wavelength of (Y2.94−xCe0.06Gdx)Al5O12 shifts from 532 nm to 568 nm upon increasing the Gd3+ concentration. Because the ionic radius of Gd3+ (0.105 nm) is larger than that of Y3+ (0.102 nm) in a dodecahedral coordination, one could expect the substitution of Gd ions to cause a Ce–O lengthening because of the larger size of the cation site for Ce3+ in the garnet host with Gd3+. The red shift of the emission and the increase in the energy separation between the 5d1 and 5d2 levels show an increase in crystal field splitting. This increase in crystal field splitting can be explained by a larger tetragonal distortion of the cuboctahedron around the Ce3+ ion. The larger distortion increases the 5d1–5d2 splitting and downshifts the lowest energy level of the Ce 5d state and consequently induces a red shift of the Ce3+ emission. Chiang et al. have also reported that substituting Gd3+ by Tb3+ in Tb3Al5O12:Ce3+ phosphors can induce a red shift and at the same time lower the thermal quenching temperature.95
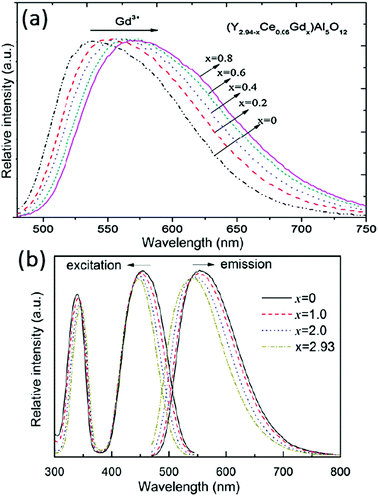 | ||
| Fig. 10 (a) Emission spectra (λex = 460 nm) of Y2.94−xGdxAl5O12:Ce0.06 phosphors for different Gd content (x values). (b) Emission and excitation spectra of Y2.93−xLuxAl5O12:Ce0.07 phosphors for increasing Lu-content (x values). (Reprinted with permission from ref. 91 and 92, copyright 2011 and 2012, Elsevier.) | ||
Next to the yellow-emitting YAG:Ce3+, the Lu analogue LuAG:Ce3+ is another important commercial LED phosphor with green emission. However, it has been investigated to a lesser extent.81 In fact, LuAG:Ce3+ has been mainly reported for use as a scintillator.46,47,96,97 Compared to the lower density YAG host lattice (ρYAG = 4.56 g cm−3), LuAG has a high density (ρLuAG = 6.73 g cm−3) and a high effective atomic number (Zeff = 60) and therefore high stopping power for ionizing radiation. Thus, LuAG:Ce3+ is regarded as a particularly promising scintillator due to its allowed electric dipole 5d–4f transition (short emission lifetime) and high theoretical light yield.98,99 The PLE spectra of a typical LuAG:Ce3+ phosphor contains two bands: a weak band with the maximum peak at near 345 nm (5d2) and a strong broadband in the spectral range from 400 to 490 nm with the maximum peak at near 455 nm (5d1). The PL spectra show broad emission spectra (spectral range between 480 and 600 nm), with the maximum peak intensity at 507 nm.100Fig. 10(b) presents the typical excitation and emission spectra of Y2.93−xLuxAl5O12:Ce0.07 phosphors with various x values (x = 0, 1.0, 2.0 and 2.93). The lattice parameters of Y2.93−xLuxAl5O12:Ce0.07 slightly decrease with increasing Lu3+ content due to the smaller ion radius of Lu3+ (0.098 nm) compared with Y3+ (0.102 nm). As seen in Fig. 10(b), the emission and excitation maxima shift linearly to shorter wavelengths with increasing Lu3+ content for the 5d1 level, while the 5d2 level shifts to slightly longer wavelengths, indicating that the 5d1–5d2 crystal field splitting decreases upon substitution of Y3+ by Lu3+. As discussed, these emission shifts have been correlated with the tetragonal distortion around Ce3+ ions by chemical substitution in garnet hosts.91
The Tb3Al5O12 (TAG) garnet doped with Ce3+ is a suitable optical material for w-LEDs and scintillators. Compared with LuAG:Ce3+ and YAG:Ce3+, the Ce3+ emission spectrum in TAG:Ce is significantly shifted to the red. In the TAG:Ce3+ garnet, the presence of an effective energy transfer from the matrix (Tb3+ cations) to the Ce3+ activator has been studied in detail.101–104 The 5D4 level of Tb and the 5d1 level of Ce3+ are very close in energy, and at room temperature energy transfer occurs in both directions (from Ce to Tb and back). The dynamics of energy transfer between Ce3+ and Tb3+ have been studied by the analysis of time-dependent luminescence decay curves.99,105 The long lived 5D4 level of Tb3+ can act as a reservoir for the excitation energy and give rise to slower decay dynamics of the emission, which is undesired in applications where a short decay is required (e.g. in scintillators for PET-scanners). The Ce3+-activated TAG was also a novel phosphor for warm white LED application as reported by Kummer.28 In Fig. 11 the typical excitation and emission spectra of TAG:Ce3+ are shown. The excitation spectrum of the TAG:Ce3+ contains 4f8–4f75d transition bands at around 276 nm (spin-allowed, ΔS = 0) and 325 nm (spin-forbidden, ΔS = 1), as well as the f–f transition lines of Tb3+ at longer wavelengths (377 nm for 7F6–5D3, etc.). The lowest-energy 5d1 excitation band of Ce3+ is at about 463 nm. The higher energy 5d2 band of Ce3+ overlaps with the spin-forbidden Tb3+ 4f–5d transition. Excitation in the characteristic f–d absorption band of Tb3+ at 276 nm gives rise to the Ce3+ 5d1 luminescence around 530–550 nm which confirms the energy transfer from Tb3+ to Ce3+. This can be favorable to enhance the Ce3+ emission. Strong and broad green-yellow emission is also found under 463 nm light excitation (Fig. 11).29 Recently, Ren et al. reported the crystal growth, structure, optical and scintillation properties of Ce3+-doped Tb2.2Lu0.8Al5O12 single crystals, and found that Ce3+-doped crystals showed not only f–d absorption bands but also the typical 4f–4f absorption of Tb3+. Under X-ray and UV excitation, strong emission peaks at 530 nm and 565 nm and the line emission traces of 4f–4f transitions featuring Tb3+ were both observed for the Ce3+-doped crystal.48,99,105
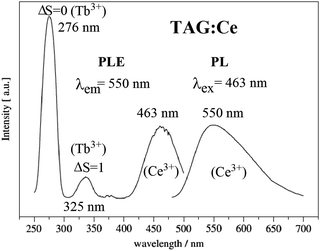 | ||
| Fig. 11 PLE and PL spectra of Tb2.97Al5O12:0.03Ce3+. (Reprinted with permission from ref. 102, copyright 2007, Elsevier.) | ||
In summary, the excitation and emission spectra of Ce3+ are similar in the LnAG:Ce3+ (Ln = Y, Lu, Gd and Tb) garnet series. When the dodecahedral Ln sites are occupied by a host cation with a smaller ionic radius, such as Lu3+, the crystal field splitting is reduced, shifting the lowest energy Ce3+ 5d level to higher energy while for substitution of Y3+ by the larger Gd3+ and Tb3+ ions a stronger crystal field shifts the 5d1 level of Ce3+ to lower energies. A schematic energy diagram for Ce3+ in garnet phosphors including the YAG, TAG, and GAG is presented in Fig. 12.94,106,107 Note that in this picture also the total crystal field splitting (position of the high energy t2g crystal field components) is drawn as increasing from YAG to TAG to GAG. However, it is not clear and also not expected that this is the case. Also the CB and VB are sketched as bands that do not change in energy between the YAG, TAG and GAG. A more realistic band diagram is presented in Fig. 25.
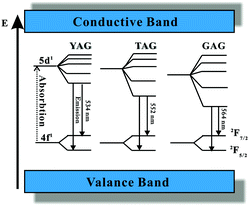 | ||
| Fig. 12 Schematic energy diagram of Ce3+ in YAG, TAG, and GAG and the emission process of Ce3+. Note that in this schematic picture the variation of the bandgap with composition is not taken into account. (Reprinted with permission from ref. 94, copyright 2007, The Electrochemistry Society.) | ||
The change in the 5d1–5d2 splitting is well documented and is explained by an increase in the tetragonal distortion of the lower eg state. As discussed above, the positions of the higher energy 5d3, 5d4 and 5d5 crystal field components are hard to determine experimentally, and even for YAG:Ce there is no consensus on the position of the 5d bands. Further research is needed to establish the total 5d crystal field splitting for Ce3+ in the TAG and GAG. Based on classic models for the crystal field splitting an opposite behavior to what is observed for the 5d1–5d2 splitting would be expected. For Ce3+ on the larger Gd or Tb site, the increase in the Ce–O ligand distance is expected to result in a smaller overall crystal field splitting.
The luminescence temperature-quenching behavior of Ce-doped garnet-type phosphors is very important for practical applications. In particular, in w-LEDs the phosphors applied directly on the blue emitting (InGa)N chips reach temperatures well above 100 °C, even close to 200 °C in the highest power LEDs. Meijerink et al. systematically studied the temperature dependence of the emission intensity for YAG with different Ce concentrations, as shown in Fig. 13(a).15 For low dopant concentrations (0.033%, mole% relative to Y3+ in line with the usual notation in luminescent materials where the dopant concentration is in mole% relative to the ion for which the dopant substitutes), the temperature induced variation of the emission intensity varies for different excitation wavelengths within the 460 nm band, while for the higher Ce3+ concentrations (3.33%) the quenching temperature is lower and the same for all excitation wavelengths. Furthermore, as an alternative method to probe luminescence quenching, measurement of the emission lifetime of Ce3+ was performed as a function of temperature with various Ce3+ contents, shown in Fig. 13(b). For higher Ce3+ concentrations the luminescence lifetime is slightly longer at room temperature. The emission lifetimes for the samples with high Ce3+ content show a strong decrease upon increasing the temperature above ∼100 °C while for low concentrations a much higher quenching temperature was observed. The difference was explained by thermally activated concentration quenching in samples with higher Ce-concentrations. Based on the analysis it was concluded that the actual (intrinsic) quenching temperature for the Ce3+ emission in YAG is reflected in the temperature dependent decay times for YAG with low Ce3+ concentrations and is very high (>600 K). For practical applications in high power LEDs, this implies that low Ce-concentrations (<1%) need to be used to prevent temperature quenching.
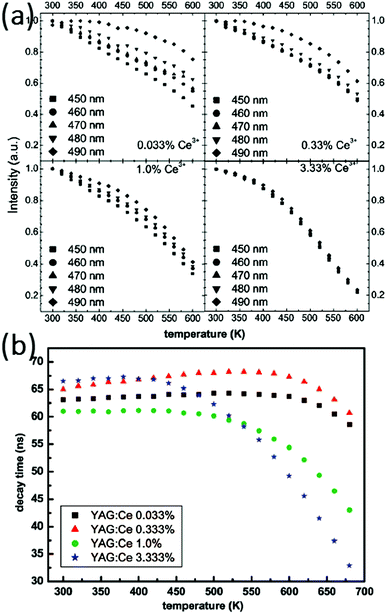 | ||
| Fig. 13 (a) Temperature dependence of the emission intensity for YAG with different Ce concentrations for different excitation wavelengths (indicated in the figure). (b) Decay times of YAG:Ce determined from single-exponential fits of the luminescence decay. (Reprinted with permission from ref. 15, copyright 2009, American Chemical Society.) | ||
Significant changes in the temperature-dependent characteristics of the Ce3+ emission can be observed as Y3+ ions are replaced by Gd3+ or Lu3+ ions. The incorporation of Gd3+ will lower the quenching temperature of YAG:Ce3+ emission while the introduction of Lu3+ has been reported to have the opposite effect.108 An example is presented in Fig. 14, showing the variations of the emission intensity for Y2.93−xLuxAl5O12:Ce0.07 phosphors (x = 0, 1.0, 2.0, 2.93) with increasing temperature.91 It can be found that with increasing Lu3+ substitution the thermal quenching temperature of the Ce3+ emission can be improved. It is important to note that the high Ce-concentrations used in these Lu substitution experiments give rise to thermally activated concentration quenching and does not reflect the influence on the quenching temperature of the intrinsic Ce3+ emission in LuAG vs. YAG. To investigate the influence of Y–Lu substitution on the intrinsic quenching temperature of the isolated Ce3+ centers, the thermal quenching of the Ce3+ in LuAG with low Ce3+ concentrations is required. Indeed, experiments on low doped (0.3%) LuAG:Ce3+ revealed an even higher intrinsic Ce3+ luminescence quenching temperature (>700 K) in comparison to YAG:Ce3+.109
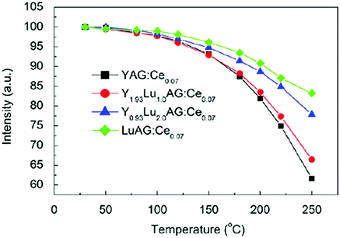 | ||
| Fig. 14 Temperature dependences of the integrated emission intensity of Y2.93−xLuxAl5O12:Ce0.07 phosphors excited by 460 nm light. (Reprinted with permission from ref. 91, copyright 2011, Elsevier). | ||
The results presented above reveal that the quenching temperature of the Ce3+ emission can be very high and well above the temperatures reached for on-chip phosphors even in high power LEDs which can be 150–200 °C. However, the quenching temperature strongly varies between garnets with different cations on the dodecahedral position. To explain the variation in the quenching temperature, initially it has been suggested that thermally activated cross-over from the 5d excited state to the 4f ground is responsible.95 The redshift of the emission on going from the YAG to the TAG to the GAG can explain a decrease in the activation barrier for cross-over as shown in Fig. 15. However, later experiments by Ueda et al. demonstrated that thermally activated photoionization is the mechanism responsible for the lowering of the quenching temperature upon substitution of Y by Tb or Gd.110,111 Herein, YAGG denotes the Y3(Al,Ga)5O12 phosphor, which will be discussed in the following section. The quenching temperature is the lowest for Ce3+ in the GAG where the energy difference between the 5d1 state and the conduction band edge is the smallest. The activation energy for ionization from the 5d1 state to the conduction band decreases in the order of ΔEYAG > ΔETAG > ΔEGAG.
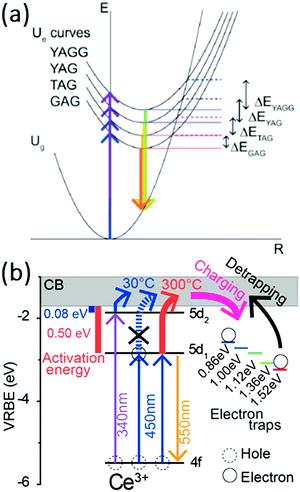 | ||
| Fig. 15 (a) Configuration coordinate diagram of Ce3+ in YAGG, YAG, TAG, and GAG hosts initially suggested to explain the variation in the quenching temperature. (Reprinted with permission from ref. 110, copyright 2011, AIP Publishing LLC) and (b) thermally activated photoionization mechanism responsible for the quenching of the Ce3+ emission in YAG as determined by thermoluminescence excitation spectroscopy. (Reprinted with permission from ref. 111, copyright 2015, American Chemical Society). | ||
2.2 Structural modification on M/M′ sites for Ln3(M,M′)5O12:Ce3+ phosphors
In the crystal structure of garnet-type Y3Al5O12, Al3+ ions occupy two different sites: two of the five aluminum cations occupy octahedral sites (six-coordinated [AlO6]) and three occupy tetrahedral sites (four-coordinated [AlO4]). This provides a second and even more versatile strategy of structural modification to tune the luminescence properties of Ce3+. Cation substitutions on the tetrahedral and octahedral M/M′ sites for garnet-type Ln3(M,M′)5O12 allow for different substitutions on both M and M′ sites: M = Al, Ga, Si, Ge…; M′ = Al, Ga, Sc, Sb… Substitutions on these sites influence the stability of the garnet phases and the band structure, and affect the luminescence properties of dopants as Ce3+. The parameter space is even wider than that for substitution at the Ln site. For example, Al3+ can be replaced by the larger Ga3+ or the even larger Sc3+. More complex aliovalent substitutions are also possible: two Al3+ ions can be replaced by one Mg2+ plus one Si4+ or Ge4+ while maintaining charge neutrality and the garnet crystal structure. Many other substitutions are also possible.34–36 Herein, we will discuss how to form stable garnet phases and their effect on the luminescence of Ce3+ will be reviewed and discussed.The color point of the YAG:Ce phosphor can be tailored by varying the crystal field through cation substitutions in the host lattice with the general rule that an increased diameter of the ion on the dodecahedral site results in an increased crystal field splitting for the 5d1 and 5d2 levels, shifting the emitting 5d1 state to lower energies (see Section 2.1). An increased diameter of the ion substituted on the octahedral site results in a decreased crystal field splitting. Ga3+ ion is one of the ions which substitute at both the tetrahedral and octahedral sites in the garnet lattice. Partial replacement of Al with Ga leads to a blue-shift of both the lowest energy Ce3+ 4f1 → 5d1 excitation and 5d1 → 4f1 emission bands. Yadav et al. reported the Y3Al3Ga2O12:Ce3+ and Y3Al4GaO12:Ce3+ phosphors. For Y3Al4GaO12:Ce3+ the emission band is around 519 nm and the 5d1 excitation band is at 450 nm. The emission spectrum of Y3Al3Ga2O12:Ce3+ shows a 511 nm Ce3+ d–f emission, which is a significant blue shift compared to the 532 nm of YAG:Ce.30
The optical properties of Gd3(Al,Ga)5O12:Ce3+ scintillators were also investigated as a function of the Ga/Al ratio by Ogiegło et al.50 The two lowest energy excitation bands of Ce3+ are located between 400–540 nm and 320–370 nm corresponding to 5d1 and 5d2 bands, respectively. When the Ga3+ content is increased, the crystal field splitting decreases. As a result, the higher 5d2 excitation band shifts toward lower energy and, at the same time, the lowest 5d1 excitation and emission bands move toward higher energies. Furthermore, if Ga3+ is substituted only in octahedral sites, the band gap was hardly affected; however, as soon as octahedral sites were fully occupied by Ga3+ and the ions started substituting in tetrahedral sites, and the band gap was observed to decrease in energy reflecting the tetrahedral aluminate groups being involved in the lower energy orbitals of the conduction band. It was also observed that Gd3Ga2Al3O12:Ce3+ with all octahedral sites occupied shows the highest emission intensity with great potential as a scintillator material in the fields of medical imaging and high energy and nuclear physics detectors.50,112–114
In Fig. 16, the excitation spectra at room temperature (RT) of Ce3+-doped Gd3(Ga,Al)5O12 samples are shown. For the pure gallate Gd3Ga5O12:Ce1%, strong quenching occurs and no emission is observed, not even at cryogenic temperatures.50 The spectra in Fig. 16 exhibit two excitation bands of Ce3+: a 5d1 band between 400 and 540 nm, and a 5d2 band between 320 and 370 nm. To investigate the shift of the 5d band maxima, normalized spectra are shown in the insets (a) and (b). Upon increasing the amount of Ga3+ the higher energy 5d2 band redshifts toward longer wavelengths, whereas a blue shift is recorded for the lowest 5d1 absorption band (inset b). Fig. 16(a) depicts the emission spectra of Gd3(Ga,Al)5O12:Ce1% samples measured for excitation at 445 nm at RT. The inset shows the normalized spectra which allow for the quantification of the shift in the 5d band positions. It is observed that the emission maxima for the samples with increasing Ga3+ content shift to shorter wavelengths, similar to that observed in Ga substituted YAG:Ce3+.50
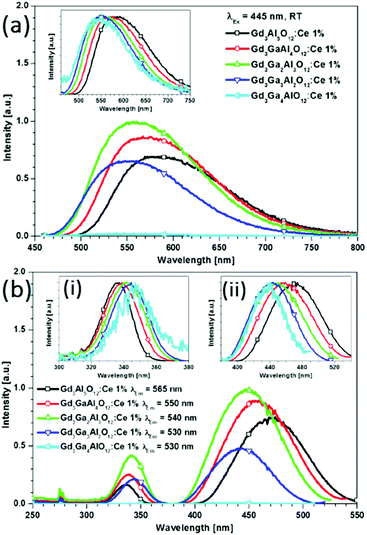 | ||
| Fig. 16 (a) Emission spectra for Gd3(Ga,Al)5O12:Ce1% measured for excitation at 445 nm at room temperature. The inset shows the normalized emission spectra. (b) Room temperature excitation spectra measured at the emission maxima of the Ce3+ emission. The shifts are clearly visible in insets (i) and (ii), which show the normalized excitation bands of the two lowest 5d states. (Reprinted with permission from ref. 50, copyright 2013, American Chemical Society). | ||
Ueda et al. did systematic research on Sc-doped garnet-type Y3Sc2Al3−xGaxO12:Ce3+ phosphors.51,86,110 Among them, Y3Sc2Ga3O12:Ce3+ (YSGG:Ce3+) shows a beautiful green long-lasting afterglow after blue excitation, not requiring UV excitation for efficient afterglow. This is a great advantage over the classical afterglow material SrAl2O4:Eu2+,Dy3+ that is most efficiently charged with UV-radiation. Afterglow luminescence of Ce3+-doped garnets is a rapidly expanding field, and here cation substitution also offers the possibility of tuning and optimizing the afterglow characteristics. Already in 1969 Holloway and Kestigian mentioned the observation of afterglow luminescence in Y3Al2Ga3O12:Ce3+ and Y3Al1.5Ga3.5O12:Ce3+ by UV excitation.54 Later, Kanai et al. reported the afterglow properties of Gd3+δ(Al,Ga)5−δO12:Ce3+ in the time range of ms after X-ray excitation.115Fig. 17 shows photographs of the as-made and O2-annealed YSGG:Ce3+ ceramics under ambient light, under UV excitation and after excitation. The green luminescence and afterglow luminescence were observed in both YSGG:Ce3+ ceramics during UV excitation and after excitation.51 The afterglow intensity is observed to be less intense for the material annealed in oxygen, which suggests a role of oxygen vacancies in the electron trapping process. Just as for the well-known afterglow material SrAl2O4:Eu2+,Dy3+ it is not easy to identify the nature of the traps involved in electron trapping.116
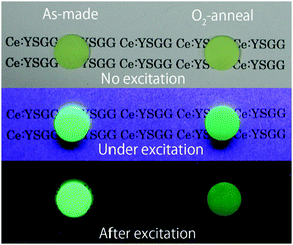 | ||
| Fig. 17 Images of the as-made and O2-annealed YSGG:Ce3+ ceramics in ambient light, under UV excitation, and in the dark after UV excitation. (Reprinted with permission from ref. 51, copyright 2011, IOP Publishing). | ||
A series of solid solutions of Ce3+-doped Y3Sc2(Al,Ga)3O12 phosphors have been discussed recently by Ueda et al.85,86 The Sc ion will substitute on the octahedral sites. Subsequently, part of the tetrahedral Al3+ was replaced by Ga3+. The PL spectra excited at 440 nm and the PLE spectra of the Ce luminescence from the samples are shown in Fig. 18a. The luminescence peak in Y3Sc2Al3O12:Ce (YSAG:Ce), Y3Sc2Al2GaO12 (YSA2G1G:Ce), Y3Sc2AlGa2O12 (YSA1G2G:Ce) and Y3Sc2Ga3O12 (YSGG:Ce) are located at 520, 510, 500 and 496 nm, respectively. The luminescence peak blue-shifts with increasing Ga content. In the PLE spectra, the two excitation bands observed at approximately 340 nm and 430 nm are attributed to transitions from the 4f ground level to the 5d1 and 5d2 levels. The transition energies of Ce3+ in the samples are shown as a function of the lattice constant in Fig. 18b. The 4f–5d2 excitation band shifts to lower energies and the 4f–5d1 excitation and emission peaks shift to higher energies with increasing lattice constant. The blue shift of the 5d1 level with increasing Ga content at the tetrahedral site is caused mainly by a decrease in 5d1–5d2 crystal field splitting (Δ12) and not by a centroid-shift.117
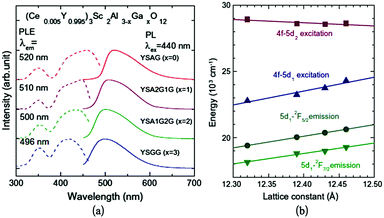 | ||
| Fig. 18 (a) PL and PLE spectra of the YSAGG:Ce3+ solid solutions; (b) lattice constant dependence of transition energies of the Ce3+ excitation bands in YSAGG:Ce3+ solid solutions. (Reprinted with permission from ref. 86, copyright 2013, Elsevier). | ||
Substitution of Sb3+ has been studied in a variety of LnAG (Ln = Y, Tb, Gd) hosts. Sb3+ will substitute at the octahedral sites in garnet phosphors.31Fig. 19 shows the emission spectra of Ce3+-doped Y3(SbAl)A13O12, Tb3(SbAl)A13O12, Gd3(SbAl)A13O12 and Gd3(SbGa)A13O12 under 465 nm excitation. Emission peak maxima are at 543, 553, 555 and 554 nm, respectively. The wavelengths for the emission maxima of Ce3+-doped Tb3(SbAl)A13O12 and Gd3(SbGa)A13O12 were longer than that for Ce3+-doped Y3Al5O12. It is also found that the substitution of Sb3+ ion at an octahedral site causes a blueshift as compared to the Ce3+ emission in the pure aluminates. In addition, an increase in the width of the emission band is observed in comparison to YAG:Ce3+.31 The blue shift can be explained by the larger ionic radius of Sb3+ compared to Al3+ and the effect is similar to that of replacing Al3+ by Ga3+. The broadening can result from disorder in the occupation of the octahedral sites by Al3+ and Sb3+ as only half of the octahedral sites are filled by Sb3+. This will result in Ce3+ with more or less Sb3+ in neighboring Oh sites and this will give rise to a variation of the energy of the 5d1 state causing inhomogeneous broadening.
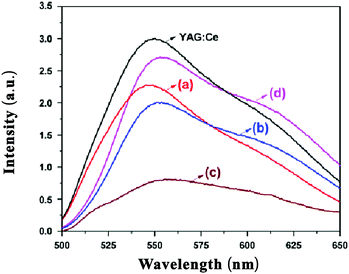 | ||
| Fig. 19 PL spectra of Ce3+-doped Y3(SbAl)A13O12 (a), Tb3(SbAl)A13O12 (b), and Gd3(SbAl)A13O12 (c), Gd3(SbGa)A13O12 (d) and YAG:Ce3+ phosphors. (Reprinted with permission from ref. 31, copyright 2011, Wiley). | ||
In addition to equivalent substitution at two different M/M′ sites by trivalent ions (Al, Ga, Sc or Sb), the substitution of two Al3+ ions by a Mg2+–Si4+ pair has also been explored and was shown to cause a red shift of the Ce3+ emission.118 Such a charge-balanced substitution with aliovalent cations allows for a stable single-phase structure of the doubly-substituted garnet and has been extensively reported by Katelnikovas, Setlur and Maniquiz.34–38,119,120
The coordination for the dodecahedral site for Ce3+ changes as a result of the substitution and it will induce color-tunable luminescence from Ce3+ in garnet phosphors. For example, [AlO4]5− and [AlO6]9− groups are replaced by [SiO4]4− and [MgO6]10−, respectively. The octahedron around Mg ions is characterized by an increased alkalinity of O2− anions leading to a more covalent character of the host lattice. Therefore, a double substitution of Mg2+–Si4+ for Al3+–Al3+ in the Al-based garnet results in a red shift of the Ce3+ emission band.121
As an example on the substitution of the Mg2+–Si4+ pair, the emission spectra of Y3Mg2AlSi2O12:Ce3+ (YMASG:Ce3+) are shown in Fig. 20, giving the normalized PL spectra of YMASG:Ce3+ phosphors with different Ce content and the PL spectrum of YAG:0.05Ce3+ for comparison. The striking feature of the YMASG:Ce3+ emission is a remarkably large red shift of the band by ∼50 nm compared to that of YAG:Ce3+. It is argued that the red shift of Ce3+ emission in YMASG is a combination of increased covalency and Stokes shift. As no excitation spectra are shown in this review, it is not clear if an increase in crystal field splitting between 5d1 and 5d2 also contributes to the red shift. Jüstel's group also reported the Y3−xLuxAl3MgSiO12:Ce3+ phosphors and proposed that the phosphors showing red-shifted emission in comparison with commercial YAG:Ce3+ phosphors enable warmer white LED light sources if combined with a blue emitting InGaN chip. However, quite strong concentration and thermal quenching were observed for the red-shifted emission. Luo et al. also reported the luminescence properties of Mg–Si co-doped Tb3Al5O12:Ce3+ showing a maximum emission intensity in the 554–575 nm range when exciting at 462 nm. The emission peak is redshifted to orange-yellow by increasing the concentration of Mg2+–Si4+ pairs. The redshift of the TAG:Ce3+ is explained by an increased crystal field splitting and changes in covalent character.122
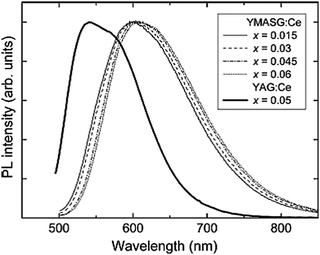 | ||
| Fig. 20 Normalized PL spectra of YMASG:Ce3+ phosphors with different Ce content together with the PL spectrum of YAG:0.05Ce3+ for comparison. (Reprinted with permission from ref. 34, copyright 2010, Elsevier). | ||
The shift in the Ce3+ emission wavelength is assigned to either crystal field splitting or covalency (nephelauxetic) effects with sometimes a small contribution of changes in the Stokes shift. The basis for explaining a red shift (or blue shift) with either of the effects is often lacking. It is not easy to distinguish between them. The proof for covalency effects requires an accurate determination of the energy for all 5d bands so that the barycenter (degeneracy weighted average energy of the 5d state) can be determined. A higher degree of covalency will shift the barycenter to lower energies. The effect of crystal field splitting on the 5d emission wavelength contains contributions from the 5d1–5d2 splitting as well as the overall eg–t2g splitting. Again, for an appropriate analysis the positions of the high energy 5d states is required. Since these have not been determined a definite assignment cannot be made. However, based on the observed large changes in the 5d1–5d2 splitting there is strong evidence that this splitting is largely responsible for the observed blue and red shifts. Further evidence that covalency effects are not dominant in the case of cation substitution are the results for the replacement of Al3+ by Ga3+. Gallates are more covalent than aluminates and this is also reflected by a decrease in bandgap upon Ga substitution. In spite of the higher covalency for the gallates, a blue shift is observed for the Ce3+ emission. The blue shift is consistent with the reduction in 5d1–5d2 splitting.
The focus on tuning the Ce3+ luminescence properties has been in the wide range of options offered by cation substitution. In the literature there are a few papers involving anion substitution and it is worthwhile to briefly mention this here. Both the covalent character and crystal field strength can be increased by partial double replacement of Al–O groups by Si–N, which yields nitride-aluminates.32,33,123 This substitution increases the nephelauxetic effect due to the partial nitrogen coordination of Ce3+, resulting in a red-shift of the emission band. At the same time, also the crystal field splitting is expected to increase. In 2008, Setlur et al. reported that the energy levels of Ce3+ were lowered with the incorporation of Si–N into the garnet lattice, which makes nitrido-YAG:Ce promising for creating warm white LEDs (with lower correlated color temperatures (CCTs), <4000 K and a good color rendering index (CRI), >80).32 Under 450 nm light excitation, this series of Y3Al5−xSixO12−xNx:Ce (x = 0.2–0.3) all produce strong and broadband emission peaking around 560 (x = 0), 586 (x = 0.1) and 591 nm (x = 0.2). A similar strategy of incorporating N3− into garnet-type phosphors has also been reported to modify the emission spectrum of the green phosphor Ca3Sc2Si3O12:Ce3+ by enhancing its red emission component, and this has been shown to yield an alternative for achieving a single white phosphor.124,125
2.3 Ce3+-Doped (Ln,Me)3(M,M′)5O12-based solid solution phosphors
In the sections above it has been discussed how the Ce3+ absorption and emission characteristics in garnets can be tuned by varying the crystal field strengths and covalent character through cation substitution at the dodecahedral site or at the octahedral/tetrahedral sites. It is known that garnets based on the lanthanide elements from Gd to Lu substituting for the dodecahedral site, and Sc3+ (3A group), Al3+, and Ga3+ (3B group) substituting for the octahedral site are stable. An even more complex cation substitution scheme to control the optical properties involves a combined substitution at dodecahedral and octahedral/tetrahedral sites by cations with different valencies. Garnet-type (Ln,Me)3(M,M′)5O12-based solid solution phosphors have been proposed where Me is a divalent cation and one of the trivalent M, M′ ions is replaced by a tetravalent ion. As an example, Y3Al5O12 and Ca3Sc2Si3O12 (CSS) are isostructural and involve the replacement of {Y3+}–[Al3+]–(Al3+) in Y3Al5O12 with {Ca2+}–[Sc3+]–(Si4+) in Ca3Sc2Si3O12.26,27Fig. 21 demonstrates the relationship between the crystal structures of Y3Al5O12 and Ca3Sc2Si3O12. They have the same structural character except for the different polyhedron substitution of [AlO6] by [ScO6], [AlO4] by [SiO4] and [YO8] by [CaO8].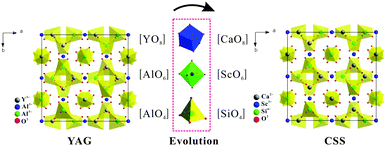 | ||
| Fig. 21 Evolution of the crystal structures of two garnet phases, the YAG (a) and CSS (b) projected from the (001) direction. | ||
Already in 1977, the silicate garnet CSS was reported to crystallize in a cubic crystal system with the space group Ia3d under ambient pressure.126 The Ce3+-Doped CSS phosphor was proposed by Shimomura in 2007.26 In this host, the Ce3+ ions replace Ca2+ on the eight-coordinated dodecahedral site despite the discrepancy of valencies between Ce3+ and Ca2+. Charge compensation for Ca2+ on the Ln3+ site is provided by substituting Si4+ on an Al3+ site. Fig. 22 shows the PL and PLE spectra of the CSS:Ce phosphor. The PL peak wavelength was 505 nm. CSS:Ce3+ was also reported to have a higher luminescence quenching temperature for the Ce3+ emission than YAG:Ce3+. However, a comparison was made with an (Y,Gd)AG:Ce3+ sample with unspecified Ce-concentration, showing quenching starting at temperatures as low as 50 °C. For an appropriate comparison of quenching temperatures, intrinsic quenching temperatures have to be compared for samples with low doping concentrations.
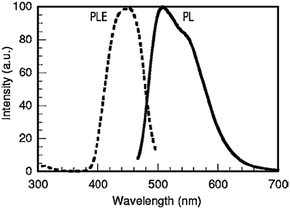 | ||
| Fig. 22 PL and PLE spectra of Ca3Sc2Si3O12:Ce3+. (Reprinted with permission from ref. 26, copyright 2007, The Electrochemistry Society.) | ||
For the class of garnets with divalent cations on the dodecahedral site, cation substitution has been used to further control and tune the luminescence properties. In this case, the Mg2+ substitutes for Sc3+ in the 6-coordinated site and provides charge compensation for replacing Ca2+ by Ce3+. Therefore, when Mg is introduced into the CSS host, the PL spectra of the CSS:Ce3+ phosphors induces a redshift of the Ce-emission with increasing Mg content.27 The presence of divalent cation sites allows for substituting divalent cations, including luminescent divalent cations. Mn2+ may substitute for Ca2+ to generate a yellow emission band (574 nm) but can also substitute for Sc3+ to generate a red emission band (680 nm). Considerable Mn2+ substitution on Sc3+ sites can be realized through balancing their charge difference by introducing trivalent rare earth ions, such as La3+ and Ce3+, to replace Ca2+. Energy transfer from Ce3+ to both Mn2+ centers has been observed, resulting in full color luminescence in CSS:Ce3+,Mn2+.127
In the garnet (Ln,Me)3(M,M′)5O12 host, a variety of solid solution phosphors exist with Ca2+–Si4+ and Mn2+–Si4+ substitution for Ln3+–Al3+. Ce3+-Doped garnet phosphors of this type have also been reported and received considerable attention in relation to the development of new LED phosphors. Note that this class of materials is different from the Mg2+–Si4+ substitution for Al3+–Al3+ in Al-based garnet phosphors described in Section 2.2.39,128–133 The Mg2+–Si4+ substitution involved the tetrahedral and octahedral sites, where the Ca2+–Si4+ and Mn2+–Si4+ substitution involves dodecahedral and tetrahedral sites in the garnet structure. This leads to the formation of solid–solution garnets and allows for a continuous variation of the local environment of Ce3+. The modification of YAG:Ce3+ or LuAG:Ce3+ with the Ca2+–Si4+ pair was inspired by naturally occurring mineral grossularite, Ca3Al2(SiO4)3.39,129 Kuru et al. were the first to investigate the solubility of Ca2+ and Si4+.128 Later, Katelnikovas reported CaY2Al4SiO12:Ce3+ and CaLu2Al4SiO12:Ce3+ with a blue-shifted Ce3+ emission in comparison to YAG:Ce and LuAG:Ce3+.39,129 Similarly, incorporation of Mn2+–Si4+ pairs into the aluminium garnets can be ascribed to the formation of solid solutions for the end members Lu3Al5O12 and Mn3Al2Si3O12, both possessing the garnet structure. The solid solutions have the chemical formula of Lu3−x−yMnxAl5−xSixO12:yCe3+.132 Furthermore, this strategy can enhance the relative intensity of the red Mn2+ component in the emission spectrum through Ce3+–Mn2+ energy transfer. The emission spectra show that the incorporation of Mn2+ in garnet-type Y3Al5O12 gives rise to broadband yellow-orange Mn2+ emission.130–133
Lu2CaMg2Si3O12 is another (Ln,Me)3(M,M′)5O12-based solid solution phosphors with a garnet structure.37–39 Lu3+/Ca2+ ions are randomly located in eightfold dodecahedral sites with occupancies of 2/3 and 1/3, respectively. The Mg2+ ion is in the octahedral sites while Si4+ exclusively occupies the tetrahedral site. For example, the (Lu0.94Ce0.06)2CaMg2Si3O12 phosphor shows a luminescence band at ∼605 nm when it is excited at 470 nm, an emission red shift of ∼1700 cm−1 compared to YAG:Ce3+. Setlur et al. reported a complete solid solution between the two silicate garnets Ca3Sc2Si3O12 and Lu2CaMg2Si3O12.37 The emission shifts to higher energies with increasing Sc3+/Ca2+ content. The Ce3+ emission color can be tuned over a surprisingly wide spectral range, from orange to blue-green emission by systematically replacing Sc3+ for Mg2+ and Ca2+ for Lu3+ in Lu1.91−yCe0.09Ca1+yMg2−yScySi3O12. The large blue shift when substituting Ca2+–Sc3+ into Lu2CaMg2Si3O12 is explained by a combination of a smaller Ce3+ 5d centroid shift and a smaller crystal field splitting because of the longer Ce3+–O2− bond length in the Ca-rich material. Note that the ionic radius of Ca2+ is much larger than that of Lu3+ (112 pm vs. 97.7 pm in VIII coordination).134
Furthermore, the observation of a blue shift when going from a smaller Lu3+ site to a larger Ca2+ site is different from the red shift observed in the LnAG garnets when the smaller Y3+ ion is replaced by a larger Tb3+ or Gd3+ ion. As discussed above, this is an unexpected shift that was explained by an increase in the 5d1–5d2 splitting as a result of a larger tetragonal distortion. The complex behavior of the Ce3+ emission in garnets induced by cation substitution indicates how different effects influence the emission color of Ce3+ by affecting the position of the lowest 5d state. Structural characterization in combination with qualitative models and sometimes handwaving arguments can explain the behavior, but for a better understanding more quantitative modelling is required as will be discussed in the next section.
The crystal structure of Mg3Y2(Ge,Si)3O12 ({Y2Mg}[Mg]2(Ge,Si)3O12, MYGSG) belongs to what is called inverse garnets, where {![[thin space (1/6-em)]](https://www.rsc.org/images/entities/char_2009.gif) }, [ ] and (
}, [ ] and (![[thin space (1/6-em)]](https://www.rsc.org/images/entities/char_2009.gif) ) represents dodecahedral, octahedral and tetrahedral sites. New possibilities for the structural design of the new (inverse) garnet-type phosphors arise by using these inverse garnets.4,40,135 The Ce3+ emission can be tuned by varying the composition and especially by varying the Si–Ge ratio. The efficiency was found to be low which was explained by Shimizu et al. by the presence of different types of Ce3+ ions (low crystal field and high crystal field) due to the disorder in the occupation of the dodecahedral cation site.135 As shown in Fig. 23a, their findings were based on a difference in the PLE spectrum and the photocurrent excitation spectrum (PCE). The PLE spectrum shows the 5d1 absorption band at lower energies than the PCE spectrum. This is explained by fast photoionization of Ce3+ ions on the low crystal field sites (CFSs). As shown in Fig. 23b, the small crystal field splitting places the 5d1 level at relative high energies, close to the conduction band leading to luminescence quenching by photoionization. For Ce3+ on a high CFS, the 5d1 level is pushed to lower energies and emission is observed. The quenching can be reduced by replacing Ge by Si. The bandgap for the silicate is higher than that for the germanate, and the higher energy of the conduction band reduces photoionization.
) represents dodecahedral, octahedral and tetrahedral sites. New possibilities for the structural design of the new (inverse) garnet-type phosphors arise by using these inverse garnets.4,40,135 The Ce3+ emission can be tuned by varying the composition and especially by varying the Si–Ge ratio. The efficiency was found to be low which was explained by Shimizu et al. by the presence of different types of Ce3+ ions (low crystal field and high crystal field) due to the disorder in the occupation of the dodecahedral cation site.135 As shown in Fig. 23a, their findings were based on a difference in the PLE spectrum and the photocurrent excitation spectrum (PCE). The PLE spectrum shows the 5d1 absorption band at lower energies than the PCE spectrum. This is explained by fast photoionization of Ce3+ ions on the low crystal field sites (CFSs). As shown in Fig. 23b, the small crystal field splitting places the 5d1 level at relative high energies, close to the conduction band leading to luminescence quenching by photoionization. For Ce3+ on a high CFS, the 5d1 level is pushed to lower energies and emission is observed. The quenching can be reduced by replacing Ge by Si. The bandgap for the silicate is higher than that for the germanate, and the higher energy of the conduction band reduces photoionization.
3. Modelling of luminescence in relation to the structure
There is an impressive amount of experimental data on the influence of cation substitution for the garnet host on the luminescence of Ce3+. In Section 2 of this review only a selection of the experiments and insights gained has been described. The qualitative models used to explain the observations are often non-conclusive. In particular when different effects have an opposite influence, the qualitative explanation assumes a stronger influence of the effect that can explain the observation versus the other, however without a quantitative justification. For example, both covalency/nephelauxetic effects and crystal field splitting result in a shift of the Ce3+ emission band. If cation substitution is expected to give rise to a reduction in covalency but a larger crystal field splitting, both a blue shift and a red shift can be explained by assuming that either covalency or crystal field effects dominate. Without a reliable quantitative estimate, these explanations provide limited insight. For a better and more quantitative understanding it is important to be able to quantify the energy of excited states and changes in the energies as a result of variations in the local surroundings of the Ce3+ ion. In this section, a variety of modelling approaches will be discussed. Both modelling of the energy level structure of Ce3+ as well as the positions of the energy levels relative to the valence and conduction bands of the host will be covered. In the past decade the field of modelling energy levels of lanthanide ions has seen impressive progress, enabled by the development of better models, increased computing power and a rather limited number of dedicated researchers trying to tackle this challenging problem.Energy level calculations of 4fn−15d states of rare earth ions traditionally use parameter models.136,137 These models include parameters for the average energy of the 5d state, crystal field splitting of both the 4f state and the 5d state, spin–orbit coupling and, for lanthanides with more than one 4f electron, also all the parameters for intraconfigurational 4f interactions in the 4fn−1 core138 as well as interactions between the 4fn−1 core electrons and the 5d electron. With the parameter models both the positions of the 4fn−15d states as well as the intensities of 4fn → 4fn−15d transitions have been determined and show a good agreement with experimental spectra.136–138
For Ce3+ with only one 4f electron the situation is relatively simple. As there are no 4f electrons in the 4fn−15d excited state, the parameters for 4f–4f and 4f–5d interactions do not play a role. The energy level structure arises from the splitting of the 5d state determined by crystal field parameters, covalency effects and spin–orbit coupling. Brik et al. have performed energy level calculations for the 4f1 ground state and the 5d excited state of Ce3+ in the YAG using a parameter model90,139 The parameters that are used in the fitting procedure include an average energy off-set related to the position of the bary center of the 5d state and thus covalency/nephelauxetic effects. The crystal field parameters were determined for D2 symmetry for Ce3+ on the dodecahedral site. The energy levels for the 5d states were modelled with the six relevant Bkq crystal field parameters for D2 symmetry. Parameters for spin–orbit coupling for the 5d state and for the 4f state are taken from the literature and fitting is done by adjusting the crystal field parameters. In Fig. 24 an example of fitting the experimentally observed bands to the crystal field model using different parameter sets (I, II and II)90 is shown. Based on the analysis, it is concluded that the peak observed at 260 nm is not from Ce3+ on the dodecahedral site but is related to a defect absorption, in line with the experimental observations of Tanner et al. Parameter set I in Fig. 24 gives the best agreement with the experimental observations, shown in the bottom part of the figure. The parameters used to obtain the fit are collected in Table 2.90
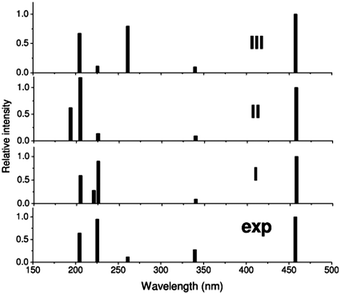 | ||
| Fig. 24 Calculated wavelengths (positions bars) and relative intensities (height of bars) for transitions from the 4f ground state to the 5d excited states of YAG:Ce3+. The experimental energies and intensities (lowest graph, exp) are obtained from the absorption spectra in ref. 141. The theoretically calculated positions and intensities were obtained from three different sets of fitting parameters shown in Table 2. (Reprinted with permission from ref. 90, copyright 2007, IOP Publishing). | ||
| 4f | 5d | ||||||
|---|---|---|---|---|---|---|---|
| Parameter | cm−1 | Parameter | cm−1 | Parameter | I (cm−1) | II (cm−1) | III (cm−1) |
| ζ (ff) | 647 | B 60 (ff) | 901 | ζ (dd) | 991 | 991 | 991 |
| B 20 (ff) | −465 | B 62 (ff) | 307 | B 20 (dd) | −6099 | −1644 | −8710 |
| B 22 (ff) | −96 | B 64 (ff) | 2136 | B 22 (dd) | −1259 | −339 | −1797 |
| B 40 (ff) | −3739 | B 66 (ff) | 246 | B 40 (dd) | −50![[thin space (1/6-em)]](https://www.rsc.org/images/entities/char_2009.gif) 042 042 |
−58![[thin space (1/6-em)]](https://www.rsc.org/images/entities/char_2009.gif) 960 960 |
−40![[thin space (1/6-em)]](https://www.rsc.org/images/entities/char_2009.gif) 309 309 |
| B 42 (ff) | −380 | Δ (fd) | 36![[thin space (1/6-em)]](https://www.rsc.org/images/entities/char_2009.gif) 218 218 |
B 42 (dd) | −5374 | −4197 | −12![[thin space (1/6-em)]](https://www.rsc.org/images/entities/char_2009.gif) 312 312 |
| B 44 (ff) | 1602 | B 44 (dd) | 19![[thin space (1/6-em)]](https://www.rsc.org/images/entities/char_2009.gif) 626 626 |
18![[thin space (1/6-em)]](https://www.rsc.org/images/entities/char_2009.gif) 569 569 |
18![[thin space (1/6-em)]](https://www.rsc.org/images/entities/char_2009.gif) 164 164 |
||
The theoretical validation of the energy level structure is an important step towards the quantitative understanding of spectral shifts upon cation substitution. A quantitative correlation between the crystal field parameters and the red shift induced by Gd substitution in YAG:Ce3+ was provided by Liu et al.142 Their analysis showed that in particular the change in the B44 crystal field parameter is responsible for the red shift induced by Gd substitution. Even though the parameter models provide quantitative insights, they are neither capable of explaining how excited state wavefunctions change and how the local geometry varies as a result of cation substitution, nor do they provide a potential energy surface for the ground state and the excited state. For gaining these important insights ab initio calculations are required (vide infra).
In addition to modelling the 5d excited state, also the splitting in the 4f1 ground configuration is important to explain features in the 5d–4f emission spectrum. Radiative decay to crystal field components of both the 2F5/2 and 2F7/2 multiplets is possible. Typically, for Ce3+ the 2F5/2 and 2F7/2 states are separated by ∼2000 cm−1 arising from spin–orbit coupling. The crystal field splitting is of the 2F5/2 and 2F7/2 states and is smaller than the spin–orbit splitting and as a result a typical double band structure is observed in emission. The two bands separated by ∼2000 cm−1 correspond to transitions to the two states arising from spin–orbit splitting. However, for Ce3+ in the YAG, crystal field splitting is large, not only for the 5d state but also for the 4f states. The large 5d crystal field splitting gives rise to the anomalously long wavelength 5d–4f emission (yellow) for Ce3+ in an oxide, but is also responsible for a high energy crystal field component of the 2F7/2 state. Experimental observations using IR spectroscopy in the 2000–4000 cm−1 region revealed a high energy (∼3600 cm−1) crystal field component of the 2F7/2 multiplet and theoretical calculations confirmed a ∼3500 cm−1 energy for the highest 2F7/2 component in Gd3Ga5O12 (GGG).140 In the YAG the highest crystal field component is calculated to be even above 4000 cm−1.
In addition to parameter models describing the positions of the Ce3+ energy levels, other parameter models have been developed to locate the ground state and excited states of Ce3+ in the host band diagram. These band diagrams provide information on the positions of the 5d bands relative to the host VB and CB. Extensive work by Dorenbos has resulted in a model that describes the energy levels of 4f ground states and 5d excited states of lanthanides relative to the energies of the band edges of the host material. Four parameters are used in this model. The first two parameters are the centroid shift εc of the 5d configuration (as discussed above, determined by covalency effects) and the depression D of the lowest 5d state (largely determined by the crystal field splitting). In addition to these parameters describing the Ce3+ energy level structure, the energy for the host bandgap is needed and is determined from the host exciton energy EX. The final parameter is the energy for the charge transfer (CT) transition from the valence band to the lanthanide dopant which is used to locate the energy of the 4f ground state relative to the valence band. With these four parameters the relative energy of the 4f ground state and the 5d excited state relative to the band edges can be determined. Information on the position of 4f and 5d states relative to the band edges of the host is especially important for understanding luminescence quenching processes based on thermally activated photoionization to the CB (electron) or the VB (hole). Once the parameters have been determined for one lanthanide ion in a specific host, the parameters and thus the energy positions for the other lanthanides in the same host can be predicted as there are well-established relations between these parameters for different lanthanides in the same host.
For example, Fig. 25 shows the Vacuum Referred Binding Energy (VBRE) diagrams for Ce3+ in a variety of garnet hosts.80 The hosts include variation in the dodecahedral site (Gd, Y, Lu) and substitution at the octahedral/tetrahedral sites (all integer compositions AlxGay from Al5Ga0 to Al0Ga5) for each of the three rare earth ions. In this diagram blue lines show the Ce-energy levels, the 4f ground state is labelled (E4f) and at higher energies the 5d1 and 5d2 states are shown. From vacuum UV excitation or absorption spectra the host excitation energy EX can be determined (red dots in Fig. 25) and a constant energy difference is assumed between EX and the conduction band edge (EC). The energy difference between the valence band edge and the 4f ground state is determined based on the energy of the charge transfer transition of Eu3+ in the various hosts. Note that the energy of the 4f ground state is constant in this diagram. This is rationalized by assuming that ionization of an electron from the inner 4f shell of the lanthanide ion to the vacuum level is constant and is not affected by the local surroundings as a result of the shielding of the 4f electrons by the filled outer 5s and 5p shells.
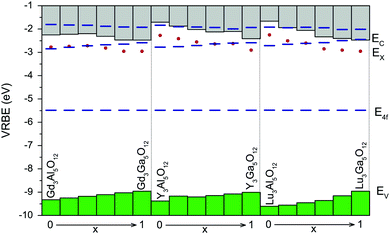 | ||
| Fig. 25 Vacuum Referred Energy Binding (VRBE) diagrams for Ce3+ in a variety of garnet hosts. EV and EC denote the valence band and conduction band edge, E4f (blue line) is the energy of the 4f ground state and EX is the host exciton energy (red dots). The two lowest 5d crystals field levels of Ce3+ are indicated by the blue lines above the 4f ground state. (Reprinted with permission from ref. 80, copyright 2013, Elsevier). | ||
The VRBE diagrams are very useful as they have predictive value and also can be used to explain luminescence properties. For example, substitution of Al by Ga causes a shift of the 5d1 level of Ce3+ to higher energies and a simultaneous downshift of EC. This explains the lowering of the luminescence quenching temperature as the activation barrier for thermal ionization from the 5d1 state to the conduction band is lowered. The higher quenching temperature for the 5d emission in YAG:Ce3+ compared to GAG:Ce3+ is also evident from the diagram as the gap between the 5d1 level and the CB edge is much larger for Ce3+ in YAG than for Ce3+ in GAG. The accuracy of the VRBE diagrams is typically 0.2–0.5 eV and strongly depends on the quality of the experimental data. The most accurate data for energies of excited states are obtained from low temperature spectra and samples with very low dopant concentrations.15,143 Shifts of emission and absorption bands as a result of saturation effects, reabsorption and temperature broadening make the determination of the energies less accurate and this affects the accuracy of the VRBE diagrams. It is also crucial that experimental spectra are corrected appropriately for the instrumental response to avoid errors in peak positions. It is clear that in the derivation of a VRBE diagram experimental data have to be critically evaluated.
Parameter models provide an understanding of the energy level structure but do not give information on the wavefunctions and geometries in the ground or excited states, the change in the equilibrium distance and the potential energy surface of the ground state and excited states. To truly understand the optical properties it is required to model the wavefunctions for the ground and excited states using first principles methods. This is an ambitious goal for lanthanide ions since a large number of orbitals need to be included in the calculations and both relativistic effects and spin–orbit coupling cannot be neglected. This makes the calculations computationally demanding and it requires dedicated expertise. In the past decade however, strong progress has been realized in understanding the optical properties of lanthanide ions using ab initio methods.144–149 Garnets have served as model systems and calculations have been done to understand their basic luminescence properties (model excitation and emission spectra, Stokes shift) as well as the observed spectral changes upon cation substitution.
One type of model that is successfully applied for ab initio calculations for YAG:Ce3+ uses complete-active-space self-consistent-field (CASSCF) and second-order many-body perturbation theory (CASPT2) methods including relativistic ab initio model potential (AIMP) embedded cluster Hamiltonians with spin–orbit coupling.150 Typically, the calculations involve a cluster of Ce3+ ions and the nearest oxygen ligands and possibly also the next nearest cations. The geometry of the cluster is obtained from crystallographic data and can be optimized using Density Functional Theory (DFT). An example of a cluster is shown in Fig. 26. The cluster is embedded in a potential that accounts for the effects of the host. A large basis set of wavefunctions of the ions in the cluster is used. Together with the geometry, this is the only input in the calculations. There are no fitting parameters. First calculations are done with a spin–orbit free Hamiltonian, taking into account bonding and static correlation effects. In the next step second-order perturbation theory calculations are performed including dynamic correlation effects of the 5s, 5p, 4f and 5d electrons of Ce and the 2s and 2p electrons of O. Typically, a program as MOLCAS is used. In the final phase the full Hamiltonian includes the spin–orbit coupling operator and spin–orbit configuration interaction. The calculations are very complex and only a few groups worldwide have the expertise to do these calculations.
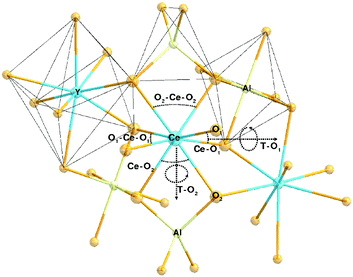 | ||
| Fig. 26 Cluster (CeO8)13− with the nearest neighbor cations and anions arranged in (AlO4) tetrahedra, (AlO6) octahedra and (YO8) dodecahedra. Bond angles and torsion angles have been optimized. (Reprinted with permission from ref. 150, copyright 2008, Elsevier.) | ||
The absorption and emission spectra that are predicted based on the ab initio calculations for YAG:Ce3+ are shown in Fig. 27.150 The crystal field splitting for both the 5d excited state and the 4f ground state is well reproduced by the calculation. A comparison with the experimentally measured positions (see for experimental data Fig. 24, bottom ‘exp’) shows that the absolute energies calculated for the 5d states are shifted by about 2000–3000 cm−1 to higher energies. For the 4f ground state the high energy crystal field component of the higher energy 2F7/2 level (around 4000 cm−1) is also well-reproduced. The transition from the 5d state to this crystal field component is visible as a weak shoulder around 19![[thin space (1/6-em)]](https://www.rsc.org/images/entities/char_2009.gif) 500 cm−1 in the 5d–4f emission spectrum (Fig. 27, bottom). Again, the absolute energy of the emission is overestimated, by about 4000 cm−1. The larger deviation in emission compared to absorption reflects that the Stokes shift is underestimated. The calculated Stokes shift is only 700 cm−1 whereas low temperature measurements on very dilute YAG:0.03%Ce3+ has provided an experimentally determined Stokes shift of just over 2000 cm−1. It is evident that the ab initio calculations do not take into account all effects and that probably the actual relaxation in the excited state is stronger than calculated. In spite of the differences with experimental results the discrepancy is getting smaller and the progress is encouraging. The overall spectral features (both intensities and spectral positions) are well reproduced without any fitting parameter. The calculations provide insight into the nature of excited states and geometry changes in the transition from the ground state to the excited state.
500 cm−1 in the 5d–4f emission spectrum (Fig. 27, bottom). Again, the absolute energy of the emission is overestimated, by about 4000 cm−1. The larger deviation in emission compared to absorption reflects that the Stokes shift is underestimated. The calculated Stokes shift is only 700 cm−1 whereas low temperature measurements on very dilute YAG:0.03%Ce3+ has provided an experimentally determined Stokes shift of just over 2000 cm−1. It is evident that the ab initio calculations do not take into account all effects and that probably the actual relaxation in the excited state is stronger than calculated. In spite of the differences with experimental results the discrepancy is getting smaller and the progress is encouraging. The overall spectral features (both intensities and spectral positions) are well reproduced without any fitting parameter. The calculations provide insight into the nature of excited states and geometry changes in the transition from the ground state to the excited state.
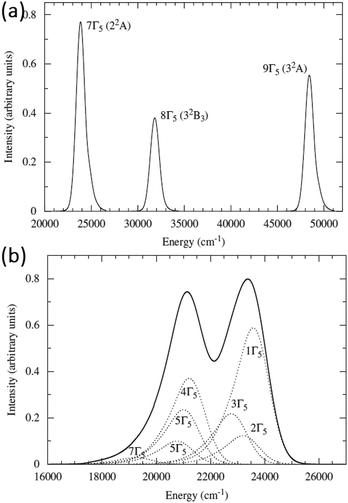 | ||
| Fig. 27 Theoretically calculated absorption (a) and emission (b) spectra for Ce3+ in YAG using ab initio calculations. For details, see the text and ref. 150. (Reprinted with permission from ref. 150, copyright 2008, Elsevier.) | ||
Using ab initio calculations it is also possible to model the shift in spectral properties induced by cation substitution. Both the effects of substitution of Y by La and substitution of Al by Ga have been modelled by the group of Seijo and Barandiaran.151,152 In Fig. 28 the Ce–La cluster is depicted. The ab initio calculations reproduce the experimental observations that upon replacing the smaller Y3+ with a larger La3+ ion, the Ce3+ emission from the 5d1 states shifts to lower energies (red shift) while the 5d2 state shifts to higher energies (blue shift). Not only do ab initio calculations reproduce these results, they also give insight into the origin of the shift. The substitution of La in neighboring sites leads to a local expansion of the Ce–O distances which gives rise to a small blue shift, in line with classical models for crystal field models. However, electronic effects give a larger contribution to an increase in crystal field splitting, which together with a smaller 4f–5d centroid difference explains the observed redshift.151 Similar calculations for Al–Ga substitution reproduce the experimentally observed blue shift.152 Again, the calculations provide insight into the origin for the shift that cannot be obtained from parameter models or handwaving arguments. One might expect a red shift based on an increased covalency as Al is replaced by the more covalent Ga. The calculations show that the blue shift is almost completely due to an expansion of the Ce3+ surroundings induced by the Ga substitutions that reduce the crystal field splitting. The 4f–5d centroid separation is not affected and there is no direct electronic effect of Ga. The closer proximity of La–Ce compared to Ga–Ce explains why an electronic effect is present for La substitution and not for Ga substitution.
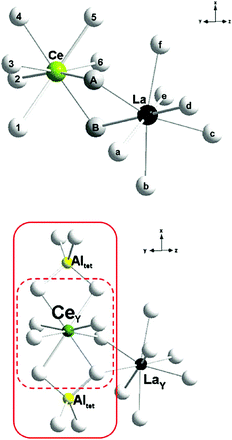 | ||
| Fig. 28 Geometry of the La–Ce cluster in YAG:Ce3+ with La substitution (see ref. 151 for details). (Reprinted with permission from ref. 151, copyright 2010, American Physical Society.) | ||
Band structure calculations have gained popularity in the past decade and especially DFT based methods are widely applied to calculate band energies and density of states for crystalline materials (insulators and semiconductors). For the garnets DFT calculations have been done to provide insight into the luminescence properties and to provide a quantitative validation of the band diagrams in the Dorenbos model. Similar to first principles ab initio calculations, DFT calculations provide insight into the nature of excited states and the origin of changes in the electronic structure that cannot be obtained from parameter models.
For example, Fig. 29 shows the band structure calculations for the YAG, YAG:Ce and (Y,Gd)AG. The electronic band structure (BS), density of states (DOS), partial density of states (PDOS), and charge deformation density (CDD) were calculated using DFT. As a starting point for the calculations the geometry was optimized using the generalized gradient approximation. The calculations show that the bandgap decreases from 6.505 eV for pure YAG to 6.358 eV for (Y2.94Ce0.06)Al5O12. Addition of Gd decreases the bandgap to 6.206 eV for (Y0.75Gd0.25)3Al5O12 and to 6.071 eV for (Y0.25Gd0.75)3Al5O12. This trend is consistent with the Dorenbos diagrams (see e.g.Fig. 25) and experimental results showing a decrease in the bandgap upon substitution of Y by Gd. The DFT calculations also provide insight into the origin of the change in the bandgap. Supported by structural characterization of Y–O and Gd–O distances as a function of Gd concentration, the calculations of the PDOS reveal a stronger hybridization for the O and Gd orbitals than for the O and Y orbitals. The stronger mixing of orbitals gives rise to a reduction in the bandgap. XRD and EXAFS data indicate that the Gd–O bond length hardly increases upon substitution of Y by Gd, in spite of the larger ionic radius of Gd3+. The resulting compressive stress is related to the increase in hybridization. The increase in hybridization upon raising the Gd concentration also causes an increase in crystal field splitting for Ce3+ substituted on the dodecahedral site. This explanation is consistent with the ab initio calculations discussed above that showed an increase in crystal field splitting upon La substitution through electronic effects.
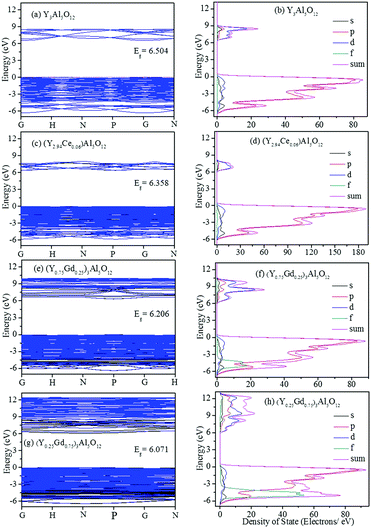 | ||
| Fig. 29 Band structure diagrams (left) and density of state, including partial density of states from DFT calculations for Y3Al5O12, (Y2.94Ce0.06)Al5O12, (Y0.75Gd0.25)3Al5O12 and (Y0.25Gd0.75)3Al5O12. For details see ref. 153. (Reprinted with permission from ref. 153, Copyright 2015, Nature Publishing group.) | ||
It is expected that further development of more accurate models will continue as the rapid increase in computing power allows for larger basis sets of orbitals and faster calculations. The fruitful interaction between experiment and theory will help to improve the models that are used for calculating the spectroscopic properties of ions in solids. It is evident that the garnet host is a model system for testing theoretical models as it has high symmetry (helpful in reducing computation time) and offers great flexibility in changing host properties through cation substitution on three different sites. At present, theoretical models are increasingly capable of providing insight into excited state configurations and effects that are responsible for changes in luminescence properties such as excitation and emission wavelengths and thermal quenching temperature. The results presented here for YAG:Ce3+ are illustrative for the capability and usefulness of the presently existing models. In the future more accurate calculations of excitation and emission bands and Stokes shifts of emission will be realized. The final goal, reliable calculations predicting all of the optical properties before a luminescent material is made, is still far away but may be reached one day.
4. Conclusion and outlook
Understanding the “Structure–Property Relationship” plays an important role in the development of new functional materials and providing new physical insights. Crystal chemistry strategies are the basis for the tuning and understanding of material properties, as well as the discovery and structural design of new phosphor materials for emerging applications.154 Garnets are an important class of inorganic minerals, with a simple cubic crystal structure and yet a complex chemical composition. Garnets doped with Ce3+ have been demonstrated in the past to form an unusually flexible class of luminescent materials. Cation substitution on three different cation sites (dodecahedral, octahedral or tetrahedral) allows for tuning the optical properties. This makes Ce3+-doped garnets the luminescent materials that have been (and still are) applied in the largest variety of applications, including cathode ray tubes, fluorescent lamps, dosimeters, afterglow materials, scintillators and, most prominently, in white light LEDs.In this review we have analyzed how the variation in the structure and chemical composition relates to the luminescence properties of Ce3+-doped garnets. Since the surprising discovery of yellow emission from Ce3+ in an oxide, YAG, Ce3+-doped garnets serve as model systems enabling the design of new inorganic functional materials that can be tailored for a specific application. In the past few decades, many Ce3+-doped garnets have been studied in detail in order to improve e.g. the color rendering index, structural stability, X-ray absorption, thermal quenching of luminescence, afterglow characteristics and so on.
Several rules relating to crystal chemistry strategies for the modification of optical properties have been demonstrated and are discussed in relation to theoretical models (both parameter based models and true ab initio calculations) for the optical properties of Ce3+. A red-shifted Ce3+ emission (compared to YAG:Ce3+) can be observed when the radius of the ions substituted on the dodecahedral site is larger than Y3+ while a blue-shift occurs with the increasing radius of ions substituted on the M and M′ sites. Both effects can be explained by theoretical calculations. The changes in the alignment of the 5d levels of Ce3+ relative to the host band edges can be used to understand thermal quenching and afterglow behavior. The progress in the insight into the relationship between the chemical composition and luminescence properties of Ce3+ in garnets will guide future research on new Ce3+-doped garnets and more in general it will help the development of new luminescent materials with tailored optical properties.
Acknowledgements
The present work was supported by the National Natural Science Foundation of China (Grant No. 51572023 and 51272242), the Program for New Century Excellent Talents in the University of Ministry of Education of China (NCET-12-0950), the Funds of the State Key Laboratory of Rare Earth Resource Utilization, Changchun Institute of Applied Chemistry, CAS (RERU2015022), the Funds of the State Key Laboratory of New Ceramics and Fine Processing, Tsinghua University (KF201306), and the Fundamental Research Funds for the Central Universities (FRF-TP-15-003A2).References
- G. Blasse and A. Bril, Appl. Phys. Lett., 1967, 11, 53–55 CrossRef CAS
.
- J. Geusic, H. Marcos and L. Van Uitert, Appl. Phys. Lett., 1964, 4, 182–184 CrossRef CAS
.
- T. Yanagida, H. Takahashi, T. Ito, D. Kasama, T. Enoto, M. Sato, S. Hirakuri, M. Kokubun, K. Makishima and T. Yanagitani, IEEE Trans. Nucl. Sci., 2005, 52, 1836–1841 CrossRef CAS
.
- J. L. Wu, G. Gundiah and A. Cheetham, Chem. Phys. Lett., 2007, 441, 250–254 CrossRef CAS
.
- M. Nikl, A. Yoshikawa, K. Kamada, K. Nejezchleb, C. Stanek, J. Mares and K. Blazek, Prog. Cryst. Growth Charact. Mater., 2013, 59, 47–72 CrossRef CAS
.
- Z. Xia, Z. Xu, M. Chen and Q. Liu, Dalton Trans., 2016, 45, 11214–11232 RSC
.
- G. Li, Y. Tian, Y. Zhao and J. Lin, Chem. Soc. Rev., 2015, 44, 8688–8713 RSC
.
- S. Ye, F. Xiao, Y. X. Pan, Y. Y. Ma and Q. Y. Zhang, Mater. Sci. Eng., R, 2010, 71, 1–34 CrossRef
.
- A. Nakatsuka, A. Yoshiasa and T. Yamanaka, Acta Crystallogr., Sect. B: Struct. Sci., 1999, 55, 266–272 Search PubMed
.
- G. Menzer, Z. Kristallogr. - Cryst. Mater., 1929, 69, 300–396 Search PubMed
.
-
J. T. C. van Kemenade, G. H. M. Siebers, J. J. Heuvelmans, J. T. W. deHair, and J. W. Vrugt, US Pat., 4727283, 1988 Search PubMed
.
- E. Zych, C. Brecher, A. Wojtowicz and H. Lingertat, J. Lumin., 1997, 75, 193–203 CrossRef CAS
.
-
C. R. Ronda, Luminescence: from theory to applications, John Wiley & Sons, 2007 Search PubMed
.
- P. Von Dollen, S. Pimputkar and J. S. Speck, Angew. Chem., Int. Ed., 2014, 53, 13978–13980 CrossRef CAS PubMed
.
- V. Bachmann, C. Ronda and A. Meijerink, Chem. Mater., 2009, 21, 2077–2084 CrossRef CAS
.
- M. R. Krames, O. B. Shchekin, R. Mueller-Mach, G. O. Mueller, L. Zhou, G. Harbers and M. G. Craford, J. Disp. Techn., 2007, 2, 160–175 CrossRef
.
- S. Nakamura, Proc. SPIE, 1997, 3002, 26–35 CrossRef CAS
.
- R. Mueller-Mach, G. Mueller, M. R. Krames, H. A. Höppe, F. Stadler, W. Schnick, T. Juestel and P. Schmidt, Phys. Status Solidi A, 2005, 202, 1727–1732 CrossRef CAS
.
- N. C. George, K. A. Denault and R. Seshadri, Annu. Rev. Mater. Res., 2013, 43, 481–501 CrossRef CAS
.
- N. J. Cherepy, J. D. Kuntz, T. M. Tillotson, D. T. Speaks, S. A. Payne, B. Chai, Y. Porter-Chapman and S. E. Derenzo, Nucl. Instrum. Methods Phys. Res., Sect. A, 2007, 579, 38–41 CrossRef CAS
.
- X. Liu, X. Wang and W. Shun, Phys. Status Solidi A, 1987, 101, K161–K165 CrossRef CAS
.
- S. Zhang, L. Chengyu, P. Ran, L. Jiang, S. Lili and S. Qiang, J. Rare Earths, 2011, 29, 426–430 CrossRef CAS
.
- D. Mateika, E. Völkel and J. Haisma, J. Cryst. Growth, 1990, 102, 994–1013 CrossRef CAS
.
- L. Chen, C. C. Lin, C. W. Yeh and R. S. Liu, Materials, 2010, 3, 2172–2195 CrossRef CAS
.
- C. H. Huang and T. M. Chen, Opt. Express, 2010, 18, 5089–5099 CrossRef CAS PubMed
.
- Y. Shimomura, T. Honma, M. Shigeiwa, T. Akai, K. Okamoto and N. Kijima, J. Electrochem. Soc., 2007, 154, J35–J38 CrossRef CAS
.
- Y. Shimomura, T. Kurushima, M. Shigeiwa and N. Kijima, J. Electrochem. Soc., 2008, 155, J45–J49 CrossRef CAS
.
-
F. Kummer, F. Zwaschka, A. Ellens, A. Debray and G. Waitl, US Pat., 6669866, 2001
.
- Y. Chen, J. Wang, M. Gong and Q. Su, J. Solid State Chem., 2007, 180, 1165–1170 CrossRef CAS
.
- P. Yadav, C. Joshi and S. Moharil, J. Lumin., 2013, 136, 1–4 CrossRef CAS
.
- H. C. Jung, J. Y. Park, G. Raju, B. C. Choi, J. H. Jeong and B. K. Moon, J. Am. Ceram. Soc., 2011, 94, 551–555 CrossRef CAS
.
- A. A. Setlur, W. J. Heward, M. E. Hannah and U. Happek, Chem. Mater., 2008, 20, 6277–6283 CrossRef CAS
.
- X. Wang, G. Zhou, H. Zhang, H. Li, Z. Zhang and Z. Sun, J. Alloys Compd., 2012, 519, 149–155 CrossRef CAS
.
- A. Katelnikovas, T. Bareika, P. Vitta, T. Jüstel, H. Winkler, A. Kareiva, A. Žukauskas and G. Tamulaitis, Opt. Mater., 2010, 32, 1261–1265 CrossRef CAS
.
- A. Katelnikovas, H. Winkler, A. Kareiva and T. Jüstel, Opt. Mater., 2011, 33, 992–995 CrossRef CAS
.
- A. Katelnikovas, J. Jurkevičius, K. Kazlauskas, P. Vitta, T. Jüstel, A. Kareiva, A. Žukauskas and G. Tamulaitis, J. Alloys Compd., 2011, 509, 6247–6251 CrossRef CAS
.
- A. A. Setlur, W. J. Heward, Y. Gao, A. M. Srivastava, R. G. Chandran and M. V. Shankar, Chem. Mater., 2006, 18, 3314–3322 CrossRef CAS
.
- M. S. Kishore, N. P. Kumar, R. G. Chandran and A. Setlur, Electrochem. Solid-State Lett., 2010, 13, J77–J80 CrossRef CAS
.
- A. Katelnikovas, J. Plewa, D. Dutczak, S. Möller, D. Enseling, H. Winkler, A. Kareiva and T. Jüstel, Opt. Mater., 2012, 34, 1195–1201 CrossRef CAS
.
- Z. Jiang, Y. Wang and L. Wang, J. Electrochem. Soc., 2010, 157, J155–J158 CrossRef CAS
.
- Z. Pan, W. Li, Y. Xu, Q. Hu and Y. Zheng, RSC Adv., 2016, 6, 20458–20466 RSC
.
- H. Ji, L. Wang, M. S. Molokeev, N. Hirosaki, R. Xie, Z. Huang, Z. Xia, O. M. ten Kate, L. Liu and V. V. Atuchin, J. Mater. Chem. C, 2016, 4, 6855–6863 RSC
.
- X. Gong, J. Huang, Y. Chen, Y. Lin, Z. Luo and Y. Huang, Inorg. Chem., 2014, 53, 6607–6614 CrossRef CAS PubMed
.
- J. Zhong, W. Zhuang, X. Xing, R. Liu, Y. Li, Y. Liu and Y. Hu, J. Phys. Chem. C, 2015, 119, 5562–5569 CAS
.
- X. Ding, G. Zhu, W. Geng, Q. Wang and Y. Wang, CrystEngComm, 2015, 17, 3235–3242 RSC
.
- M. Nikl, J. Mares, N. Solovieva, J. Hybler, A. Voloshinovskii, K. Nejezchleb and K. Blazek, Phys. Status Solidi A, 2004, 201, R41–R44 CrossRef CAS
.
- M. Nikl, A. Yoshikawa, A. Vedda and T. Fukuda, J. Cryst. Growth, 2006, 292, 416–421 CrossRef CAS
.
- Y. Wu and G. Ren, CrystEngComm, 2013, 15, 4153–4161 RSC
.
- K. Kamada, T. Endo, K. Tsutumi, T. Yanagida, Y. Fujimoto, A. Fukabori, A. Yoshikawa, J. Pejchal and M. Nikl, Cryst. Growth Des., 2011, 11, 4484–4490 CAS
.
- J. M. Ogiegło, A. Katelnikovas, A. Zych, T. Jüstel, A. Meijerink and C. R. Ronda, J. Phys. Chem. A, 2013, 117, 2479–2484 CrossRef PubMed
.
- J. Ueda, K. Aishima, S. Nishiura and S. Tanabe, Appl. Phys. Express, 2011, 4, 042602 CrossRef
.
- Y. Luo and Z. Xia, J. Phys. Chem. C, 2014, 118, 23297–23305 CAS
.
- H. Lin, J. Xu, Q. Huang, B. Wang, H. Chen, Z. Lin and Y. Wang, ACS Appl. Mater. Interfaces, 2015, 7, 21835–21843 CAS
.
- W. Holloway and M. Kestigian, J. Opt. Soc. Am., 1969, 59, 60–63 CrossRef CAS
.
- S.-J. Liu, T.-J. Peng, Z. Song, L. Bian, G.-B. Song and Q.-L. Liu, Chin. Phys. B, 2014, 23, 048106 CrossRef
.
- Z. Song, R. Zu, X. Liu, L. He and Q. Liu, Cryst. Res. Technol., 2016, 51, 239–242 CrossRef CAS
.
- Y.-B. Chen, Z.-B. Tang, X.-S. Xu, D.-H. Feng, Z.-Z. Wang and Z.-Q. Liu, RSC Adv., 2016, 6, 43916–43923 RSC
.
- J. Zhong, W. Zhuang, X. Xing, R. Liu, Y. Li, Y. Zheng, Y. Hu and H. Xu, RSC Adv., 2016, 6, 2155–2161 RSC
.
- H. Ji, L. Wang, M. S. Molokeev, N. Hirosaki, Z. Huang, Z. Xia, M. Otmar, L. Liu and R. Xie, J. Mater. Chem. C, 2016, 4, 2359–2366 RSC
.
- D. J. Robbins, B. Cockayne, J. L. Glasper and B. Lent, J. Electrochem. Soc., 1979, 126, 1213–1220 CrossRef CAS
.
- D. J. Robbins, B. Cockayne, B. Lent, C. N. Duckworth and J. L. Glasper, Phys. Rev. B: Condens. Matter Mater. Phys., 1979, 19, 1254–1269 CrossRef CAS
.
- F. Andreola, L. Barbieri, A. Corradi and I. Lancellotti, J. Eur. Ceram. Soc., 2007, 27, 1623–1629 CrossRef CAS
.
- M. Nikl and A. Yoshikawa, Adv. Opt. Mater., 2015, 3, 463–481 CrossRef CAS
.
- M. Nikl, A. Yoshikawa, K. Kamada, K. Nejezchleb, C. R. Stanek, J. A. Mares and K. Blazek, Prog. Cryst. Growth Charact. Mater., 2013, 59, 47–72 CrossRef CAS
.
- K. L. Tom, Phys. Med. Biol., 2008, 53, R287 CrossRef PubMed
.
- A. Ikesue, T. Kinoshita, K. Kamata and K. Yoshida, J. Am. Ceram. Soc., 1995, 78, 1033–1040 CrossRef CAS
.
- E. Zych, C. Brecher, A. J. Wojtowicz and H. Lingertat, J. Lumin., 1997, 75, 193–203 CrossRef CAS
.
- A. Ikesue and Y. L. Aung, Nat. Photonics, 2008, 2, 721–727 CrossRef CAS
.
- J. McKittrick and L. E. Shea-Rohwer, J. Am. Ceram. Soc., 2014, 97, 1327–1352 CrossRef CAS
.
- T. Tomiki, H. Akamine, M. Gushiken, Y. Kinjoh, M. Miyazato, T. Miyazato, N. Toyokawa, M. Hiraoka, N. Hirata and Y. Ganaha, J. Phys. Soc. Jpn., 1991, 60, 2437–2445 CrossRef CAS
.
- P. Dorenbos, J. Lumin., 2000, 91, 91–106 CrossRef CAS
.
- P. Dorenbos, J. Lumin., 2000, 91, 155–176 CrossRef CAS
.
- D. Robbins, J. Electrochem. Soc., 1979, 126, 1550–1555 CrossRef CAS
.
- P. Dorenbos, Phys. Rev. B: Condens. Matter Mater. Phys., 2000, 62, 15640 CrossRef CAS
.
- P. Dorenbos, Phys. Rev. B: Condens. Matter Mater. Phys., 2000, 62, 15650 CrossRef CAS
.
- P. Dorenbos, Phys. Rev. B: Condens. Matter Mater. Phys., 2001, 64, 125117 CrossRef
.
- P. Dorenbos, Phys. Rev. B: Condens. Matter Mater. Phys., 2002, 65, 235110 CrossRef
.
- P. Dorenbos, J. Alloys Compd., 2002, 341, 156–159 CrossRef CAS
.
- P. Dorenbos, J. Lumin., 2002, 99, 283–299 CrossRef CAS
.
- P. Dorenbos, J. Lumin., 2013, 134, 310–318 CrossRef CAS
.
- L. Chen, C.-C. Lin, C.-W. Yeh and R.-S. Liu, Materials, 2010, 3, 2172–2195 CrossRef CAS
.
-
J. Solé, L. Bausa and D. Jaque, An introduction to the optical spectroscopy of inorganic solids, John Wiley & Sons, 2005 Search PubMed
.
-
R.-J. Xie, Y. Q. Li, N. Hirosaki and H. Yamamoto, Nitride phosphors and solid-state lighting, CRC Press, 2016 Search PubMed
.
- P. Dorenbos, J. Andriessen and C. Van Eijk, J. Solid State Chem., 2003, 171, 133–136 CrossRef CAS
.
- P. D. Rack and P. H. Holloway, Mater. Sci. Eng., R, 1998, 21, 171–219 CrossRef
.
- J. Ueda, K. Aishima and S. Tanabe, Opt. Mater., 2013, 35, 1952–1957 CrossRef CAS
.
- A. Setlur and A. Srivastava, Opt. Mater., 2007, 29, 1647–1652 CrossRef CAS
.
- L. Zhang, J. Zhang, X. Zhang, Z. Hao, H. Zhao and Y. Luo, ACS Appl. Mater. Interfaces, 2013, 5, 12839–12846 CAS
.
- Y. C. Wu, D. Y. Wang, T. M. Chen, C. S. Lee, K. J. Chen and H. C. Kuo, ACS Appl. Mater. Interfaces, 2011, 3, 3195–3199 CAS
.
- P. A. Tanner, L. Fu, L. Ning, B.-M. Cheng and M. G. Brik, J. Phys.: Condens. Matter, 2007, 19, 216213 CrossRef
.
- Q. Shao, Y. Dong, J. Jiang, C. Liang and J. He, J. Lumin., 2011, 131, 1013–1015 CrossRef CAS
.
- K. Li and C. Shen, Optik, 2012, 123, 621–623 CrossRef CAS
.
- R. Hansel, S. Allison and G. Walker, J. Mater. Sci., 2010, 45, 146–150 CrossRef CAS
.
- C.-C. Chiang, M.-S. Tsai and M.-H. Hon, J. Electrochem. Soc., 2007, 154, J326–J329 CrossRef CAS
.
- C.-C. Chiang, M.-S. Tsai and M.-H. Hon, J. Electrochem. Soc., 2008, 155, B517–B520 CrossRef CAS
.
- Y. Zorenko, V. Gorbenko, I. Konstankevych, B. Grinev and M. Globus, Nucl. Instrum. Methods Phys. Res., Sect. A, 2002, 486, 309–314 CrossRef CAS
.
- K. Kamada, T. Yanagida, T. Endo, K. Tsutumi, M. Yoshino, J. Kataoka, Y. Usuki, Y. Fujimoto, A. Fukabori and A. Yoshikawa, J. Cryst. Growth, 2012, 352, 91–94 CrossRef CAS
.
- V. Babin, V. Gorbenko, A. Krasnikov, A. Makhov, M. Nikl, S. Zazubovich and Y. Zorenko, Radiat. Meas., 2010, 45, 415–418 CrossRef CAS
.
- J. M. Ogiegło, A. Zych, K. V. Ivanovskikh, T. Jüstel, C. R. Ronda and A. Meijerink, J. Phys. Chem. A, 2012, 116, 8464–8474 CrossRef PubMed
.
- H. T. Kim, J. H. Kim, J.-K. Lee and Y. C. Kang, Mater. Res. Bull., 2012, 47, 1428–1431 CrossRef CAS
.
- M. Batentschuk, A. Osvet, G. Schierning, A. Klier, J. Schneider and A. Winnacker, Radiat. Meas., 2004, 38, 539–543 CrossRef CAS
.
- Y. Zorenko, T. Voznyak, V. Vistovsky, T. Zorenko, S. Nedilko, M. Batentschuk, A. Osvet, A. Winnacker, G. Zimmerer and V. Kolobanov, Radiat. Meas., 2007, 42, 648–651 CrossRef CAS
.
- M.-S. Tsai, G.-M. Liu and S.-L. Chung, Mater. Res. Bull., 2008, 43, 1218–1222 CrossRef CAS
.
- M. Nazarov, J. Sohn and C. Yoon, Opt. Mater., 2008, 30, 1387–1392 CrossRef CAS
.
- A. Setlur, J. Shiang and C. Vess, J. Phys. Chem. C, 2011, 115, 3475–3480 CAS
.
- C. Chiang, M. Tsai and M.-H. Hon, J. Alloys Compd., 2007, 431, 298–302 CrossRef CAS
.
- J. Li, J. G. Li, Z. Zhang, X. Wu, S. Liu, X. Li, X. Sun and Y. Sakka, J. Am. Ceram. Soc., 2012, 95, 931–936 CAS
.
- Q. Y. Shao, Y. Dong, J. Q. Jiang, C. Liang and J. H. He, J. Lumin., 2011, 131, 1013–1015 CrossRef CAS
.
- K. V. Ivanovskikh, J. M. Ogiegło, A. Zych, C. R. Ronda and A. Meijerink, ECS J. Solid State Sci. Technol., 2013, 2, R3148–R3152 CrossRef CAS
.
- J. Ueda, S. Tanabe and T. Nakanishi, J. Appl. Phys., 2011, 110, 053102 CrossRef PubMed
.
- J. Ueda, P. Dorenbos, A. J. Bos, A. Meijerink and S. Tanabe, J. Phys. Chem. C, 2015, 119, 25003–25008 CAS
.
- K. Kamada, T. Yanagida, T. Endo, K. Tsutumi, Y. Usuki, M. Nikl, Y. Fujimoto, A. Fukabori and A. Yoshikawa, J. Cryst. Growth, 2012, 352, 88–90 CrossRef CAS
.
- M. Tyagi, F. Meng, M. Koschan, S. B. Donnald, H. Rothfuss and C. L. Melcher, J. Phys. D: Appl. Phys., 2013, 46, 475302 CrossRef
.
- Y. Wu, M. Nikl, V. Jary and G. Ren, Chem. Phys. Lett., 2013, 574, 56–60 CrossRef CAS
.
- T. Kanai, M. Satoh and I. Miura, J. Am. Ceram. Soc., 2008, 91, 456–462 CrossRef CAS
.
- K. Van den Eeckhout, P. F. Smet and D. Poelman, Materials, 2010, 3, 2536–2566 CrossRef CAS
.
- T. Tien, E. Gibbons, R. DeLosh, P. Zacmanidis, D. Smith and H. Stadler, J. Electrochem. Soc., 1973, 120, 278–281 CrossRef CAS
.
- J. Robertson, M. Van Tol, W. Smits and J. Heynen, Philips J. Res., 1981, 36, 15–30 CAS
.
- M. C. Maniquiz, K. Y. Jung and S. M. Jeong, J. Electrochem. Soc., 2011, 158, H697–H703 CrossRef CAS
.
- A. Katelnikovas, H. Bettentrup, D. Uhlich, S. Sakirzanovas, T. Jüstel and A. Kareiva, J. Lumin., 2009, 129, 1356–1361 CrossRef CAS
.
- Y. Jia, Y. Huang, N. Guo, H. Qiao, Y. Zheng, W. Lv, Q. Zhao and H. You, RSC Adv., 2012, 2, 2678–2681 RSC
.
- H. Luo, J. Liu, X. Zheng, B. Xu, Y. Lu, L. Han, K. Ren and X. Yu, J. Am. Ceram. Soc., 2012, 95, 3582–3587 CrossRef CAS
.
- M. Sopicka-Lizer, D. Michalik, J. Plewa, T. Juestel, H. Winkler and T. Pawlik, J. Eur. Ceram. Soc., 2012, 32, 1383–1387 CrossRef CAS
.
- Y. Liu, X. Zhang, Z. Hao, X. Wang and J. Zhang, J. Mater. Chem., 2011, 21, 6354–6358 RSC
.
- J. Qiao, J. Zhang, X. Zhang, Z. Hao, W. Deng, Y. Liu, L. Zhang, L. Zhang, H. Zhao and J. Lin, Opt. Lett., 2013, 38, 884–886 CrossRef CAS PubMed
.
- B. Mill, E. Belokoneva, M. Simonov and N. Belov, J. Struct. Chem., 1977, 18, 321–323 CrossRef
.
- Y. Liu, X. Zhang, Z. Hao, Y. Luo, X. Wang and J. Zhang, J. Mater. Chem., 2011, 21, 16379–16384 RSC
.
- Y. Kuru, E. Onur Savasir, S. Zeynep Nergiz, C. Oncel and M. Ali Gulgun, Phys. Status Solidi C, 2008, 5, 3383–3386 CrossRef CAS
.
- A. Katelnikovas, S. Sakirzanovas, D. Dutczak, J. Plewa, D. Enseling, H. Winkler, A. Kareiva and T. Jüstel, J. Lumin., 2013, 136, 17–25 CrossRef CAS
.
- Z. Mu, Y. Hu, Y. Wang, H. Wu, C. Fu and F. Kang, J. Lumin., 2011, 131, 676–681 CrossRef CAS
.
- Z. Mu, Y. Hu, H. Wu, C. Fu and F. Kang, Physica B, 2011, 406, 864–868 CrossRef CAS
.
- Y. Jia, Y. Huang, Y. Zheng, N. Guo, H. Qiao, Q. Zhao, W. Lv and H. You, J. Mater. Chem., 2012, 22, 15146–15152 RSC
.
- Y. Jia, N. Guo, Y. Zheng, H. Qiao, W. Lv, Q. Zhao and H. You, ChemPhysChem, 2012, 13, 3383–3387 CrossRef CAS PubMed
.
- R. T. Shannon, Acta Crystallogr., Sect. A: Cryst. Phys., Diffr., Theor. Gen. Crystallogr., 1976, 32, 751–767 CrossRef
.
- T. Shimizu, J. Ueda and S. Tanabe, Phys. Status Solidi C, 2012, 9, 2296–2299 CrossRef CAS
.
- M. Reid, L. Van Pieterson, R. Wegh and A. Meijerink, Phys. Rev. B: Condens. Matter Mater. Phys., 2000, 62, 14744 CrossRef CAS
.
- P. Peijzel, P. Vergeer, A. Meijerink, M. Reid, L. Boatner and G. W. Burdick, Phys. Rev. B: Condens. Matter Mater. Phys., 2005, 71, 045116 CrossRef
.
- L. Van Pieterson, M. Reid, R. Wegh, S. Soverna and A. Meijerink, Phys. Rev. B: Condens. Matter Mater. Phys., 2002, 65, 045113 CrossRef
.
- H. Przybylińska, C.-G. Ma, M. Brik, A. Kamińska, P. Sybilski, A. Wittlin, M. Berkowski, Y. Zorenko, V. Gorbenko and H. Wrzesinski, Appl. Phys. Lett., 2013, 102, 241112 CrossRef
.
- H. Przybylińska, C.-G. Ma, M. Brik, A. Kamińska, J. Szczepkowski, P. Sybilski, A. Wittlin, M. Berkowski, W. Jastrzebski and A. Suchocki, Phys. Rev. B: Condens. Matter Mater. Phys., 2013, 87, 045114 CrossRef
.
- T. Tomiki, T. Kohatsu, H. Shimabukuro and Y. Ganaha, J. Phys. Soc. Jpn., 1992, 61, 2382–2387 CrossRef CAS
.
- Y. Pan, W. Wang, G. Liu, S. Skanthakumar, R. Rosenberg, X. Guo and K. K. Li, J. Alloys Compd., 2009, 488, 638–642 CrossRef CAS
.
- K. Ivanovskikh, J. Ogiegło, A. Zych, C. Ronda and A. Meijerink, ECS J. Solid State Sci. Technol., 2013, 2, R3148–R3152 CrossRef CAS
.
- L. Seijo, Z. Barandiarán and E. Harguindey, J. Chem. Phys., 2001, 114, 118–129 CrossRef CAS
.
- J. L. Pascual, N. Barros, Z. Barandiarán and L. Seijo, J. Phys. Chem. A, 2009, 113, 12454–12460 CrossRef CAS PubMed
.
- M. Sekiya, T. Noro, E. Miyoshi, Y. Osanai and T. Koga, J. Comput. Chem., 2006, 27, 463–470 CrossRef CAS PubMed
.
- O. Kazuyoshi, W. Shinta, S. Yuki, T. Hiroaki, I. Takugo, G. B. Mikhail and T. Isao, Jpn. J. Appl. Phys., 2004, 43, L611 CrossRef
.
- K. Ogasawara, S. Watanabe, H. Toyoshima, T. Ishii, M. G. Brik, H. Ikeno and I. Tanaka, J. Solid State Chem., 2005, 178, 412–418 CrossRef CAS
.
- Z.-X. Fang, L.-X. Ning and Z.-F. Cui, Chin. J. Chem. Phys., 2011, 24, 134–140 CrossRef CAS
.
- J. Gracia, L. Seijo, Z. Barandiarán, D. Curulla, H. Niemansverdriet and W. van Gennip, J. Lumin., 2008, 128, 1248–1254 CrossRef CAS
.
- A. B. Muñoz-García, J. L. Pascual, Z. Barandiarán and L. Seijo, Phys. Rev. B: Condens. Matter Mater. Phys., 2010, 82, 064114 CrossRef
.
- A. B. Muñoz-García and L. Seijo, Phys. Rev. B: Condens. Matter Mater. Phys., 2010, 82, 184118 CrossRef
.
- L. Chen, X. Chen, F. Liu, H. Chen, H. Wang, E. Zhao, Y. Jiang, T.-S. Chan, C.-H. Wang and W. Zhang, Sci. Rep., 2015, 5, 045114 Search PubMed
.
- Z. Xia and Q. Liu, Prog. Mater. Sci., 2016, 84, 59–117 CrossRef CAS
.
| This journal is © The Royal Society of Chemistry 2017 |

