 Open Access Article
Creative Commons Attribution 3.0 Unported Licence
Combined influence of ectoine and salt: spectroscopic and numerical evidence for compensating effects on aqueous solutions†
Marc Benjamin
Hahn
 ab,
Frank
Uhlig
 *c,
Tihomir
Solomun
*a,
Jens
Smiatek
*c and
Heinz
Sturm
 ad
ad
aFederal Institute for Materials Research and Testing, D-12205 Berlin, Germany. E-mail: Tihomir.Solomun@bam.de; Tel: +49 30 8104 3382
bFree University Berlin, Department of Physics, D-14195 Berlin, Germany
cInstitute for Computational Physics, University of Stuttgart, D-70569 Stuttgart, Germany. E-mail: smiatek@icp.uni-stuttgart.de; fuhlig@icp.uni-stuttgart.de; Tel: +49 711 685 63757
dTechnical University Berlin, D-10587 Berlin, Germany
First published on 22nd September 2016
Abstract
Ectoine is an important osmolyte, which allows microorganisms to survive in extreme environmental salinity. The hygroscopic effects of ectoine in pure water can be explained by a strong water binding behavior whereas a study on the effects of ectoine in salty solution is yet missing. We provide Raman spectroscopic evidence that the influence of ectoine and NaCl are opposing and completely independent of each other. The effect can be explained by the formation of strongly hydrogen-bonded water molecules around ectoine which compensate the influence of the salt on the water dynamics. The mechanism is corroborated by first principles calculations and broadens our understanding of zwitterionic osmolytes in aqueous solution. Our findings allow us to provide a possible explanation for the relatively high osmolyte concentrations in halotolerant bacteria.
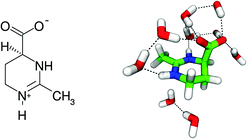
Compatible solutes or osmolytes like ectoine1 (Fig. 1) are produced by halotolerant and halophilic bacteria in order to survive in extreme saline environments.2 The underlying mechanism in the presence of ectoine can be explained by balanced chemical potentials inside and outside the cell which permit a change of the interior salt concentration due to osmosis.3,4 In fact, recent experimental and simulation results revealed a strong influence of ectoine on the local water structure.5–9 In more detail, it was shown that ectoine forms around seven strong hydrogen bonds with its first hydration shell, which explains its pronounced hygroscopic properties.5,10 Therefore, ectoine is also often used as the main ingredient in moisturizers and pharmaceuticals.11 Further beneficial properties are given by the protection of enzyme structures against heating, freezing and drying,12 and the fluidization of lipid bilayers and membranes under high pressures.5,13–15 In summary, ectoine can be regarded as a versatile osmolyte with potential applicability in many consumables.16
Although the properties of ectoine in pure water were studied in detail before, it is yet unclear if the observed effects remain valid in a salty solution. Previous simulation results verified that the number of hydrogen bonds with the local water shell is constant for molar salt concentrations of up to 0.5 mol L−1.5 Nevertheless, the presence of high molar salt concentrations and the possible impact of Hofmeister series effects remains of specific interest.17 In detail, previous theories considered osmolytes like ectoine, hydroxyectoine and trimethylamine N-oxide (TMAO) as water-structure makers (kosmotropes)5,6,9,18 whereas some salts among other co-solutes were discussed as water-structure breakers (chaotropes).17,19,20 Moreover, it was also discussed that chaotropes can be interpreted as protein denaturants and kosmotropes as protein protectants.21,22 Thus, in contrast to ectoine, specific anions like I− and ClO4− are able to destabilize the native structure of proteins, which is known as a typical Hofmeister effect.21–23 In organisms, chaotropes and kosmotropes usually occur simultaneously.24 Hence, the response to environmental changes is given by adaptive concentration changes in protectants and denaturants. Indeed, it can be speculated that the influence of ectoine is less affected by ordinary monovalent salts like NaCl due to its evolutionary success in halotolerant microorganisms. Although it is well known that Cl− is neither a kosmotropic or a chaotropic anion,21 it can be assumed that the combined effects of salts like NaCl and ectoine might impose a significant influence on the local water structure.
With this article, we present the first Raman spectroscopy study of the water OH stretching behavior in the combined presence of ectoine and NaCl in physiologically relevant concentrations.12,25 The experimental findings are analyzed in terms of the water structure around ectoine and its dependence on the presence of salt. Furthermore, density functional theory (DFT) and ab initio molecular dynamics (AIMD) simulations were performed to study the properties of the first solvation shell around ectoine (as depicted in Fig. 1) in more detail. The outcomes of our simulations verify a stable hydration shell whose influence on the global water properties is not affected by the presence of salt for increasing ectoine concentrations. Our findings are important for a deeper understanding of zwitterionic osmolytes like ectoine and their functionality in aqueous solution. Moreover, we provide a possible explanation for the high ectoine concentration in halotolerant bacteria. The detailed description of the experimental procedure and the simulation protocol can be found in the ESI.†
We start the discussion with the resulting confocal Raman spectra of ectoine in aqueous solution without salt. The Raman spectrum of pure water at room temperature and a pressure of 1 atm (black curve in Fig. 2) shows a broad peak at wavenumber k ≈ 3400 cm−1 with a shoulder at 3200 cm−1. A common approach for the interpretation of vibrational spectra is given by a fitting procedure which relies on the use of several Gaussian functions (or other similar profiles) which are centered at different positions. Typical examples are presented by the dashed curves in Fig. 2. In contrast to the underlying interpretation of the Gaussians, which is still under debate26–34 we focus on the spectral features which allow us to disentangle the mutual influences of ectoine and salt on bulk water properties independently. It turns out that the ratio of the intensities for wavenumbers between k = 3200 cm−1 and 3400 cm−1 is a sensitive probe for influences of ectoine and NaCl on the water properties. Therefore, we focus on this ratio for pure water, aqueous NaCl solutions, aqueous ectoine solutions, and aqueous ectoine solutions in the presence of salt. In order to distinguish between the influence of ectoine and the contributions of bulk water, we also analyzed the Raman spectra of dry ectoine power (bottom of Fig. 2). It can be observed that the ectoine ν(CH) vibrational frequencies are located at wavenumbers between k = 2850 cm−1 and 3050 cm−1. Therefore, the analysis of experimental data was limited to k ≥ 3050 cm−1 which belongs to bulk water modes. These ν(OH) modes are the most relevant vibrations for our discussion as they show high sensitivity to hydrogen bonding effects.8 This assumption can be also verified with regard to the results for a one molar aqueous ectoine solution (red curve in Fig. 2) in comparison to dry ectoine powder where a clear distinction between water and ectoine vibrational modes can be seen. In comparison, we also observe the corresponding OD stretching modes of neat D2O between k = 2300 cm−1 and 2700 cm−1 (blue curve in Fig. 2). The corresponding smaller bandwidth as well as the shift of frequencies compared with bulk H2O can be attributed to the larger mass of D2O.
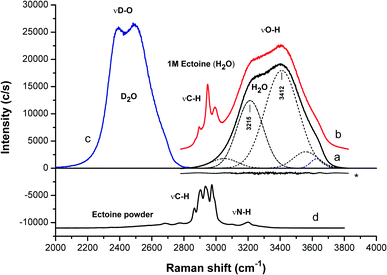 | ||
| Fig. 2 Raman spectra in terms of OH (OD) stretching mode regions of: (a) water, (b) 1 M ectoine solution (H2O), (c) D2O and (d) dry ectoine powder. For clarity, the spectra are shifted vertically. The spectra (a) and (b) are normalized with respect to the area of the OH stretching bands (after appropriate fitting as described in the ESI†). The residual fit for water is marked with an asterisk. The spectra (b) and (d) are additionally normalized with respect to the area of the ectoine CH stretching. The analysis of the data is limited to k ≥ 3050 cm−1. The weak ectoine NH stretching at around 3200 cm−1 (about 1.5% of the water contribution in 1 M ectoine solution) accounts in part for the proportionality to the ectoine concentration, but only for H2O and not D2O due to the frequency shift in the OD vibrations. This contribution has been accounted for in the data of Fig. 3. | ||
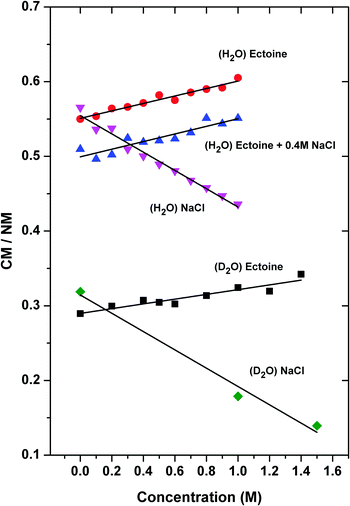
In order to assign the intensity of the modes, we calculated the area A under the Gaussians below and above 3300 cm−1 where the positions with maximum values can be attributed to collective (CM) and non-collective (NM) modes of bulk water stretching, respectively.8 The corresponding spectra of pure H2O can be best fitted by Gaussian functions centered at wavenumbers k = 3050 cm−1 and 3215 cm−1 for the collective modes and k = 3412 cm−1, 3560 cm−1 and 3630 cm−1, respectively for the non-collective modes. For D2O, the equivalent peaks are located at k = 2286 cm−1 and 2367 cm−1 (collective modes) and 2456 cm−1, 2536 cm−1 and 2623 cm−1 (non-collective modes). Indeed, it was discussed that all above-mentioned frequencies at specific wavenumbers belong to OH-vibrational modes of water.35 The results for the ratio CM/NMH2O = (A3050 + A3215)/(A3412 + A3560 + A3630) (H2O) and CM/NMD2O = (A2286 + A2367)/(A2456 + A2536 + A2623) (D2O) for various solution compositions in terms of different ectoine and NaCl concentrations are presented in Fig. 3.
It can be seen that under the influence of NaCl ((H2O)NaCl), the collective behavior of H2O as given by the ratio CM/NM decreases by about 23% ± 4% (from CM/NM = 0.56 for c = 0 M to CM/NM = 0.43 for c = 1 M, error estimated from error in slopes of linear fits) for increasing salt concentrations (identical system with D2O: 41% ± 7%). In contrast, ectoine leads to an increase of the relative influence of the collective modes ((H2O) ectoine) by 9% ± 2% (D2O: 14% ± 2%). Hence, it can be concluded that ectoine enhances the collective modes of water, in contrast to NaCl which weakens the relative contribution of the collective modes. Interestingly, the finding for pure ectoine solution remains even valid in the presence of a 0.4 M NaCl concentration ((H2O) ectoine + 0.4 M NaCl) as the data in Fig. 3 and Table 1 reveal. The increase of the CM/NM ratio with higher ectoine concentrations points at an identical value for the slope compared to the pure ectoine solution. The only difference is a constant shift due to the presence of salt. Identical results with a corresponding constant shift can be also obtained for ectoine + 0.2 molar NaCl solution (data not shown).
| System | M | CM/NMc=0 | R 2 |
|---|---|---|---|
| (H2O) ectoine | 0.050 | 0.551 | 0.959 |
| (H2O) ectoine + 0.4 M NaCl | 0.051 | 0.499 | 0.850 |
| (H2O) NaCl | −0.122 | 0.555 | 0.978 |
| (D2O) ectoine | 0.032 | 0.290 | 0.887 |
| (D2O) NaCl | −0.123 | 0.314 | 0.984 |
In order to understand these effects, we have studied the properties of the local hydration shell around ectoine in more detail. We computed the theoretical Raman spectrum of ectoine in a small water cluster, and recorded the experimental Raman spectrum of hydrated ectoine powder. For the computational and the experimental details, we refer the reader to the ESI.† A similar approach was also described in ref. 8. The numerical and the experimental results are shown in Fig. 4. It can be seen that the experimental as well as theoretical Raman spectra are dominated by peaks at wavenumbers k = 3440 cm−1 and 3490 cm−1, respectively. The corresponding visual representation of the mode can be obtained from the theoretical modeling and involves OH stretching of three water molecules bridging the COO− and NH+ groups of ectoine. Hence, it can be assumed that the resulting binding behavior to the carboxyl group (COO−) mostly dominates the water properties at these wavenumbers and explains the hygroscopic properties of ectoine.5 Electronic structure calculations5,36 suggested that the zwitterionic form of ectoine in water at pH = 7 is more stable than the neutral one (ΔE = 10.81 kcal mol−1),5 which is consistent with our Raman spectroscopy measurements of a 1 M ectoine solution which do not show any bands around 1750 cm−1 expected in the presence of a protonated COOH group. The zwitterionic structure of ectoine involves a half-chair conformation with the COO− group in an axial position,37 giving rise to a large dipole moment between the COO− and the pyrimidinium groups of the molecule.5 In addition, the structure of ectoine and its conformation found in solution (half chair with axially oriented carboxyl-group and zwitterionic properties) is also highly stable and dominant in ectoine crystalline states.37 Based on these findings, one can assume that the strong coordination of water molecules to the NH+ and the COO− group might result in the formation of a strengthened local water structure involving multiple hydrogen bonds within the ectoine–water complex in agreement with the visual representation of the mode shown in Fig. 4. Moreover, in agreement with previous findings,5,8 it is known that the lifetimes of hydrogen bonded water molecules to the carboxyl group are significantly longer compared with bulk water properties.5,8 Thus, it can be concluded that the hydrogen bonds of water molecules with ectoine are energetically more stable compared to intermolecular water hydrogen bonds. Hence, it can be assumed that water molecules which interact with the strongly bound water molecules at ectoine are mostly important for the increase of the collective modes over the non-collective modes. In order to understand the influence of ectoine in more detail, we performed ab initio molecular dynamics simulations and focused on the resulting water properties in comparison to pure water. The details of the simulation protocol are described in the ESI.†
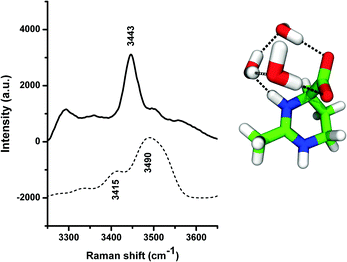 | ||
| Fig. 4 Experimental Raman spectrum obtained by direct hydration of ectoine powder (above) and theoretical Raman spectrum (below) corresponding to the OH stretching mode of the ectoine–water complex. The visual representation of the corresponding configuration is shown at the right part of the figure, with the same color-coding as shown in Fig. 1. | ||
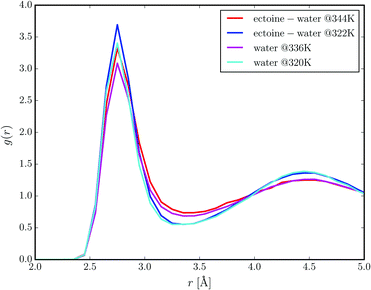
Two distinct sets of ab initio molecular dynamics simulations were performed. One set of simulations contained three molecules of ectoine in aqueous solution (at 1.6 mol L−1 concentration), whereas the other simulation setup is represented by water molecules only. We performed constant energy NVE simulations with effective temperatures in the range between 320 K and 344 K. Fig. 5 presents the radial distribution functions between the oxygen atoms of water molecules at different temperatures in the presence of ectoine and in comparison to pure water. It can be clearly seen that ectoine leads to a stronger binding of water molecules at short distances due to higher peak values at r = 2.7 Å. Hence, the corresponding potential of mean force differences at r = 2.7 Å, are given by ΔPMF322K ≈ −RT![[thin space (1/6-em)]](https://www.rsc.org/images/entities/char_2009.gif) log(g(r)ect+H2O/g(r)H2O) ≈ −0.8 kcal mol−1 with the molar gas constant R, which verifies a stronger attraction between water molecules in the presence of ectoine. Moreover, it can be seen that higher temperatures diminish the number of water molecules in the first hydration shell due to lower peak values at r = 2.7 Å as one would expect. In addition, the resulting differences between the radial distribution functions in the presence of ectoine and for pure water at longer distances r ≥ 4 Å are negligible. Hence, it can be assumed that the presence of ectoine mainly influences the first hydration shell around water molecules which indicates the strengthening of local interactions. These results are also in agreement with previous simulation and experimental findings8,9 which verified longer relaxation times of water molecules, longer lifetimes of hydrogen bonds between water molecules, and also a modified dielectric constant of water in the presence of ectoine. The question now arises why a local effect has such a big influence on the global water properties. Indeed, due to the high concentration of ectoine in solution, most water molecules are in direct or indirect contact with an ectoine molecule. In detail, for 1.6 M ectoine solution roughly 80% of all water molecules are located within a distance of r ≈ 8 Å around ectoine which roughly corresponds to the second hydration shell. Hence, for ectoine concentrations which resemble physiological conditions,2 the amount of bulk water is rather low which explains the strong influence of ectoine on global water properties.
log(g(r)ect+H2O/g(r)H2O) ≈ −0.8 kcal mol−1 with the molar gas constant R, which verifies a stronger attraction between water molecules in the presence of ectoine. Moreover, it can be seen that higher temperatures diminish the number of water molecules in the first hydration shell due to lower peak values at r = 2.7 Å as one would expect. In addition, the resulting differences between the radial distribution functions in the presence of ectoine and for pure water at longer distances r ≥ 4 Å are negligible. Hence, it can be assumed that the presence of ectoine mainly influences the first hydration shell around water molecules which indicates the strengthening of local interactions. These results are also in agreement with previous simulation and experimental findings8,9 which verified longer relaxation times of water molecules, longer lifetimes of hydrogen bonds between water molecules, and also a modified dielectric constant of water in the presence of ectoine. The question now arises why a local effect has such a big influence on the global water properties. Indeed, due to the high concentration of ectoine in solution, most water molecules are in direct or indirect contact with an ectoine molecule. In detail, for 1.6 M ectoine solution roughly 80% of all water molecules are located within a distance of r ≈ 8 Å around ectoine which roughly corresponds to the second hydration shell. Hence, for ectoine concentrations which resemble physiological conditions,2 the amount of bulk water is rather low which explains the strong influence of ectoine on global water properties.
In conclusion, the experimental and simulation results revealed a strengthening of local interactions between water molecules in the presence of ectoine. We observed a significant amount of strongly bound water molecules to the COO− and NH+ groups of ectoine. The corresponding vibrational modes are verified by experimental and calculated Raman spectra. With regard to the relatively high ectoine concentration, which is roughly comparable to physiological concentrations, we conclude that this local effect also drastically influences the global properties of water. The Raman spectroscopic measurements indicated that ectoine increases the ratio of collective vibrational behavior over non-collective modes for water molecules whereas monovalent salts like NaCl decrease this ratio. Our findings indicate that the direct effects of salt and ectoine are independent and mutually compensate each other for comparable concentrations. This finding explains the relatively high osmolyte concentrations in halophilic bacteria which survive in extremely saline environments.
Our results reveal a strong influence of ectoine on the local water structure, which can be attributed to the specific electronic and conformational properties of zwitterionic ectoine. Indeed, our study verifies the superb properties of hygroscopic co-solutes and provides a more detailed understanding of the highly optimized evolutionary strategies that provide the possibility for organisms to survive under extreme environmental conditions.
We greatly acknowledge helpful discussions with Johannes Zeman and Anand Narayanan Krishnamoorthy. This work was supported by the German Science Foundation (DFG) under contract number STU 245/4-1, the cluster of excellence ‘Simulation Technology’ (EXC 310) and the SFB 716. M. B. H. also acknowledges support from the MIS-project of the BAM.
References
- E. A. Galinski, H.-P. Pfeiffer and H. G. Trueper, Eur. J. Biochem., 1985, 149, 135–139 CrossRef CAS PubMed.
- P. H. Yancey, J. Exp. Biol., 2005, 208, 2819–2830 CrossRef CAS PubMed.
- T. E. Sweeney and C. A. Beuchat, Am. J. Physiol.: Regul., Integr. Comp. Physiol., 1993, 264, R469–R480 CAS.
- H. J. Kunte, H. G. Trueper and H. Stan-Lotter, in Astrobiology, ed. D. G. Horneck and D. C. Baumstark-Khan, Springer, Berlin, Heidelberg, 2002, pp. 185–200 Search PubMed.
- J. Smiatek, R. K. Harishchandra, O. Rubner, H.-J. Galla and A. Heuer, Biophys. Chem., 2012, 160, 62–68 CrossRef CAS PubMed.
- J. Smiatek, J. Phys. Chem. B, 2014, 118, 771–782 CrossRef CAS PubMed.
- A. Narayanan Krishnamoorthy, C. Holm and J. Smiatek, J. Phys. Chem. B, 2014, 118, 11613–11621 CrossRef CAS PubMed.
- M. B. Hahn, T. Solomun, R. Wellhausen, S. Hermann, H. Seitz, S. Meyer, H.-J. Kunte, J. Zeman, F. Uhlig, J. Smiatek and H. Sturm, J. Phys. Chem. B, 2015, 119, 15212–15220 CrossRef CAS PubMed.
- A. Eiberweiser, A. Nazet, S. E. Kruchinin, M. V. Fedotova and R. Buchner, J. Phys. Chem. B, 2015, 119, 15203–15211 CrossRef CAS PubMed.
- C. Tanne, E. A. Golovina, F. A. Hoekstra, A. Meffert and E. A. Galinski, Front. Microbiol., 2014, 5, 150 Search PubMed.
- T. Dirschka, Akt. Dermatol., 2008, 34, 115–118 CrossRef.
- K. Lippert and E. A. Galinski, Appl. Microbiol. Biotechnol., 1992, 37, 61–65 CrossRef CAS.
- R. K. Harishchandra, S. Wulff, G. Lentzen, T. Neuhaus and H.-J. Galla, Biophys. Chem., 2010, 150, 37–46 CrossRef CAS PubMed.
- R. K. Harishchandra, A. K. Sachan, A. Kerth, G. Lentzen, T. Neuhaus and H.-J. Galla, Biochim. Biophys. Acta, Biomembr., 2011, 1808, 2830–2840 CrossRef CAS PubMed.
- J. Smiatek, R. K. Harishchandra, H.-J. Galla and A. Heuer, Biophys. Chem., 2013, 180, 102–109 CrossRef PubMed.
- G. Lentzen and T. Schwarz, Appl. Microbiol. Biotechnol., 2006, 72, 623–634 CrossRef CAS PubMed.
- P. Lo Nostro and B. W. Ninham, Chem. Rev., 2012, 112, 2286–2322 CrossRef CAS PubMed.
- E. A. Galinski, M. Stein, B. Amendt and M. Kinder, Comp. Biochem. Physiol., Part A: Mol. Integr. Physiol., 1997, 117, 357–365 CrossRef.
- K. D. Collins, G. W. Neilson and J. E. Enderby, Biophys. Chem., 2007, 128, 95–104 CrossRef CAS PubMed.
- Y. Marcus, Chem. Rev., 2009, 109, 1346–1370 CrossRef CAS PubMed.
- Y. Zhang and P. S. Cremer, Curr. Opin. Chem. Biol., 2006, 10, 658–663 CrossRef CAS PubMed.
- D. R. Canchi and A. E. Garcia, Annu. Rev. Phys. Chem., 2013, 64, 273–293 CrossRef CAS PubMed.
- W. Kunz, Specific ion effects, World Scientific, 2010 Search PubMed.
- P. H. Yancey, M. E. Clark, S. C. Hand, R. D. Bowlus and G. N. Somero, Science, 1982, 217, 1214–1222 CAS.
- P. H. Yancey and J. F. Siebenaller, J. Exp. Biol., 2015, 218, 1880–1896 CrossRef PubMed.
- J. R. Scherer, M. K. Go and S. Kint, J. Phys. Chem., 1974, 78, 1304–1313 CrossRef CAS.
- G. E. Walrafen, M. R. Fisher, M. S. Hokmabadi and W.-H. Yang, J. Chem. Phys., 1986, 85, 6970–6982 CrossRef CAS.
- G. E. Walrafen, J. Chem. Phys., 1967, 47, 114–126 CrossRef CAS.
- J. B. Brubach, A. Mermet, A. Filabozzi, A. Gerschel and R. Roy, J. Chem. Phys., 2005, 112, 184509 CrossRef PubMed.
- J. L. Green, A. R. Lacey and M. G. Sceats, Chem. Phys. Lett., 1986, 130, 67–71 CrossRef CAS.
- D. E. Hare and C. M. Sorensen, J. Chem. Phys., 1992, 96, 13 CrossRef CAS.
- S. A. Rice, M. S. Bergren, A. C. Belch and G. Nielsen, J. Phys. Chem., 1983, 87, 4295–4308 CrossRef CAS.
- A. C. Belch, M. Berkowitz and J. A. McCammon, J. Am. Chem. Soc., 1986, 108, 1755–1761 CrossRef CAS.
- B. M. Auer and J. L. Skinner, J. Chem. Phys., 2008, 128, 224511 CrossRef CAS PubMed.
- G. E. Walrafen and Y. C. Chu, J. Phys. Chem., 1995, 99, 11225–11229 CrossRef CAS.
- K. Suenobu, M. Nagaoka, T. Yamabe and S. Nagata, J. Phys. Chem. A, 1998, 102, 7505–7511 CrossRef CAS.
- L. Inbar, F. Frolow and A. Lapidot, Eur. J. Biochem., 1993, 214, 897–906 CrossRef CAS PubMed.
Footnote |
| † Electronic supplementary information (ESI) available: Details of experimental and theoretical methods. See DOI: 10.1039/c6cp05417j |
| This journal is © the Owner Societies 2016 |

