
 Open Access Article
 This Open Access Article is licensed under a Creative Commons Attribution-Non Commercial 3.0 Unported Licence
The photochemistry of sodium ion pump rhodopsin observed by watermarked femto- to submillisecond stimulated Raman spectroscopy†
Yusaku
Hontani‡
a,
Keiichi
Inoue‡
bcd,
Miroslav
Kloz
a,
Yoshitaka
Kato
b,
Hideki
Kandori
bc and
John T. M.
Kennis
*a
aDepartment of Physics and Astronomy, Faculty of Sciences, VU University Amsterdam, De Boelelaan 1081, 1081 HV Amsterdam, The Netherlands. E-mail: j.t.m.kennis@vu.nl
bDepartment of Frontier Materials, Nagoya Institute of Technology, Showa-ku, Nagoya 466-8555, Japan
cOptoBioTechnology Research Center, Nagoya Institute of Technology, Showa-ku, Nagoya 466-8555, Japan
dPRESTO, Japan Science and Technology Agency, 4-1-8 Honcho, Kawaguchi, Saitama 332-0012, Japan
First published on 17th August 2016
Abstract
Krokinobacter rhodopsin 2 (KR2) is a recently discovered light-driven Na+ pump that holds significant promise for application as a neural silencer in optogenetics. KR2 transports Na+ (in NaCl solution) or H+ (in larger cation solution, e.g. in CsCl) during its photocycle. Here, we investigate the photochemistry of KR2 with the recently developed watermarked, baseline-free femto- to submillisecond transient stimulated Raman spectroscopy (TSRS), which enables us to investigate retinal chromophore dynamics in real time with high spectral resolution over a large time range. We propose a new photocycle from femtoseconds to submilliseconds: J (formed in ∼200 fs) → K (∼3 ps) → K/L1 (∼20 ps) → K/L2 (∼30 ns) → L/M (∼20 μs). KR2 binds a Na+ ion that is not transported on the extracellular side, of which the function is unclear. We demonstrate with TSRS that for the D102N mutant in NaCl (with Na+ unbound, Na+ transport) and for WT KR2 in CsCl (with Na+ unbound, H+ transport), the extracellular Na+ binding significantly influences the intermediate K/L/M state equilibrium on the photocycle, while the identity of the transported ion, Na+ or H+, does not affect the photocycle. Our findings will contribute to further elucidation of the molecular mechanisms of KR2.
Krokinobacter rhodopsin 2 (KR2) is the first identified outward sodium ion (Na+) pump rhodopsin (NaR) reported in 2013.1 KR2 is composed of seven trans-membrane helices (TM1–TM7), and covalently binds a common chromophore, all-trans retinal, which undergoes isomerization to the 13-cis form upon photon absorption. With the unique ability of the unidirectional Na+ pump, KR2 is of great interest in optogenetic applications as a neural silencer.2,3 The crystal structures of the pentameric state of KR2 were solved by Gushchin et al. in 2015,4 which showed that Na+ binding exists on the extracellular side of the interfaces between two different protomers. This binding site consists of Tyr25 (on TM1), Thr87 and main chain carbonyl groups of Thr83 and Phe86 (on TM2) of the same protomer, Asp102 (on the loop between TM2 and TM3) of the neighboring protomer and two water molecules (Fig. 1a). Importantly, the Na+ ions on this binding site are not the ones that are transported.1,4 Moreover, it was reported that the D102N mutant of KR2 does not bind Na+ on the extracellular binding site, but still pumps Na+ as well as WT KR2.2 KR2 also pumps Li+, but transports only H+ in the absence of Na+ and Li+, e.g. in solution containing only larger cations such as K+, Rb+ and Cs+.1,2 Attenuated total reflection-Fourier transform infrared (ATR-FTIR) studies showed K+, Rb+ and Cs+ do not bind to the ion binding site on the extracellular side of KR2.1,2
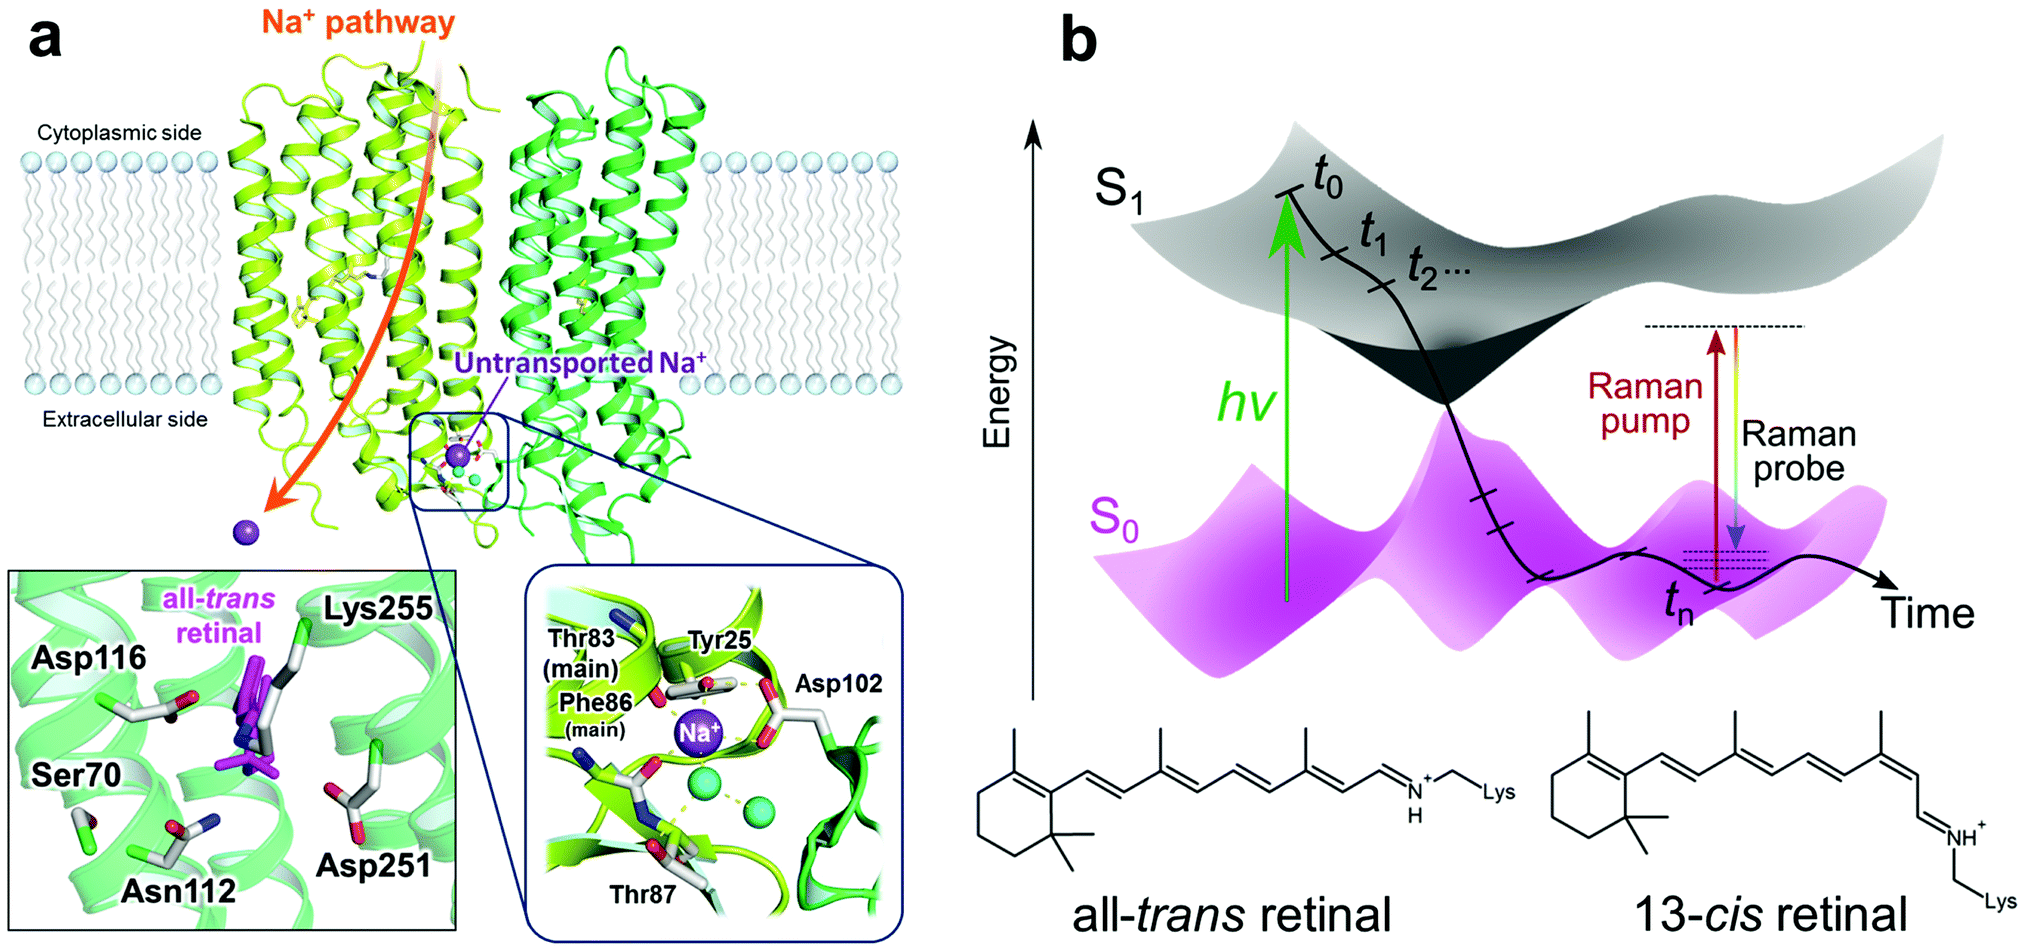 | ||
| Fig. 1 The extracellular Na+ binding site of KR2 and a schematic diagram of transient stimulated Raman spectroscopy. (a) Crystal structure of KR24 (PDB ID: 4XTN) and close-up of the retinal binding pocket and the Na+ binding site on the extracellular side. The Na+ binding site consists of Tyr25 (on TM1), Thr87 and main chain carbonyl groups of Thr83 and Phe86 (on TM2) of the same protomer, Asp102 (on the loop between TM2 and TM3) of the neighboring protomer and two water molecules. (b) Schematic diagram of transient stimulated Raman spectroscopy. A narrowband Raman pump (∼800 nm) and a broadband Raman probe (∼840–960 nm) are applied simultaneously after a time delay. The time delay was varied from −50 ps to 110 μs with the shortest step of 50 fs. | ||
A femtosecond transient absorption study indicated that KR2 has a J intermediate, which is a vibrationally excited state of the primary photoproduct,5,6 and a K intermediate, which is the vibrationally relaxed primary photoproduct,6,7 as other microbial rhodopsins.8 Furthermore, flash photolysis experiments showed that an L/M intermediate, which is an equilibrium of L and M states, is formed in ∼20 μs.1 According to the crystal structure of the L intermediate of bacteriorhodopsin, the retinal Schiff base is located closer to the counterions in the L intermediate than in the K intermediate.9,10 The M state is a typical intermediate that appears after proton transfer from the retinal Schiff base to a counterion.11 Subsequently, an O intermediate, in which a proton is reconstituted to the 13-cis retinal,11 is formed in ∼1 ms, and goes back to the initial ground state in a few tens of milliseconds.1 According to the crystal structures reported by Kato et al. in 2015,2 it is suggested that Asp116 flips in the M-like intermediate with the proton transfer from the retinal Schiff base to Asp116, resulting in opening the pathway of Na+ transport near the retinal Schiff base. Thus, it is considered that the retinal plays important roles not only in triggering the photoreaction, but also in the Na+ pump function. Therefore, observation of the retinal dynamics in earlier time regions than the L/M formation is essential to clarify the molecular mechanism of KR2.
Femtosecond stimulated Raman spectroscopy (FSRS) is a time-resolved vibrational spectroscopic technique that features high temporal (∼100 fs) and spectral (<10 cm−1) resolutions (Fig. 1b)12 and broadband spectral detection. When the wavelength of the Raman pump is tuned resonant or pre-resonant for the chromophore, chromophore-specific observation is possible without disturbance by signals from the protein backbone and side chains. As a major drawback of FSRS, it suffers from notorious problems that arise from unpredictable high-amplitude baselines.13 Recently, we solved these baseline problems with a spectral watermarking approach, involving shaping of the Raman pump in combination with wavelet transform of pseudorandomly generated watermarks, which enables us to automatically eliminate the baseline and minimize the fixed-pattern noise of the CCD detectors. Furthermore, we have extended the FSRS technique with wide-range continuous time delays from ∼10−14 s to ∼10−4 s utilizing synchronized ultrafast Ti:sapphire amplifiers,15 which enables us to investigate chromophore dynamics from femtoseconds to submilliseconds in detail in a single experiment. We call this technique Transient Stimulated Raman Spectroscopy (TSRS).
Here we present femto- to submillisecond TSRS results on WT KR2 in NaCl (Na+ bound, Na+ transport), the D102N mutant in NaCl (Na+ unbound, Na+ transport) and WT KR2 in CsCl (Na+ unbound, H+ transport). With the spectral data, we will discuss the retinal dynamics on the excited state and the photoproduct states up to the L/M-intermediate formation. Moreover, we will show that the extracellular Na+ binding significantly affects the ps–μs retinal chromophore dynamics, and that the identity of the transported ion, H+ or Na+, does not affect the ps–μs reaction.
Results
Femto- to submillisecond transient absorption spectroscopy
For reference, we first applied femto- to submillisecond UV-vis transient absorption spectroscopy to KR2. The time-resolved data were globally analyzed in terms of a kinetic model of sequentially interconverting species with increasing time constants.16Fig. 2 shows steady state absorption spectra and globally fitted transient absorption spectra (Evolution-Associated Difference Spectra, EADS) of WT KR2 in NaCl up to 150 μs (Decay-Associated Difference Spectra, DADS, are shown in Fig. S1, ESI†). Nine components were required to adequately represent the transient absorption data with the following time constants: 20 fs, 170 fs, 420 fs, 2.4 ps, 29 ps, 6.5 ns, 370 ns, 18 μs and infinity. Fig. S2–S4 (ESI†) show raw data along with the fit results. The decay components up to 100 ps are consistent with recently reported femtosecond pump–probe spectroscopy of KR2,8 and the 18 μs decay component corresponds to the ∼26 μs component in the flashphotolysis experiment.1 The first component of the global fitting was created immediately after photon absorption, possibly mixed as a precursor state and a coherent artifact from overlapping of pump and probe pulses. On the second component, typical peaks assigned as exited state absorption (ESA, at ∼480 nm and at ∼630 nm), ground state bleach (GSB, at ∼550 nm) and stimulated emission (SE, at >∼680 nm) were seen. Those peaks apparently overlap each other, influencing the intensity and the peak positions. The positive signals on the EADS consist of ESA and/or photoproducts. Transient absorption spectra of KR2/D102N in NaCl and WT KR2 in CsCl were also globally fitted with nine exponential components (Fig. S5 and S6, ESI†) as well as WT KR2 in NaCl. No significant difference was seen on the transient absorption spectra of the three different sample conditions within the spectral resolution. The time constants of the transient absorption spectra are shown in Table S1 (ESI†).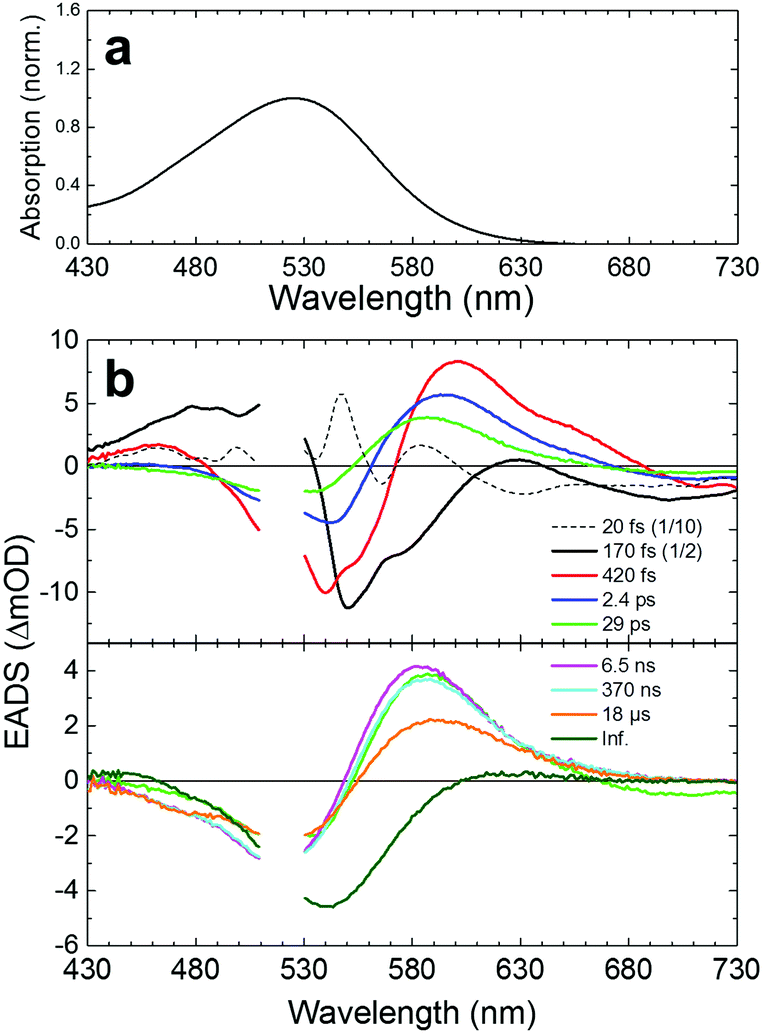 | ||
| Fig. 2 Steady state and transient absorption results of WT KR2 in NaCl. (a) Steady state absorption of WT KR2 in NaCl. (b) Globally fitted evolution-associated difference spectra (EADS) of WT KR2 in NaCl. The first five (top) and the following four (bottom) time components are shown separately. The EADS are cut between 510–530 nm because of the strong pump light scattering. The components of 20 fs and 170 fs are scaled down by a factor of 10 and 2, respectively. The 29 ps component is shown on both of the top and the bottom figures for reference. | ||
Femto- to submillisecond transient stimulated Raman spectroscopy
Fig. 3a shows baseline-free stimulated Raman spectra on the ground state with all-trans retinal in WT KR2 in NaCl, KR2/D102N in NaCl and WT KR2 in CsCl. The ground state Raman spectra were almost identical between WT KR2 in NaCl and CsCl, and KR2/D102N mutant. The 1532 cm−1 band is assigned as the C![[double bond, length as m-dash]](https://www.rsc.org/images/entities/char_e001.gif) C ethylenic stretching mode.17,18 The 1169 cm−1 and 1201 cm−1 bands are assigned as C–C stretching mode.18,19 Typical hydrogen out-of-plane (HOOP) vibrational modes were seen at 831 and 884 cm−1, and methyl rocking mode was observed at 1009 cm−1.18,19 In Fig. 3b, transient stimulated Raman spectra of WT KR2 in NaCl at selected time delays are shown, represented as the difference stimulated Raman spectrum between actinic pulse on minus actinic pulse off. We prefer to show the TSRS spectra as such difference spectra instead of conventional reconstructed all-positive Raman spectra, because for the latter a certain amplitude of the ground-state stimulated Raman spectrum has to be added, which requires visual inspection and therefore introduces a bias. In total, TSRS spectra at 96 delays were recorded. Positive and negative transient Raman signals were seen in the HOOP (∼800–1000 cm−1), the C–C stretching (∼1150–1250 cm−1) and the CC stretching (∼1510–1560 cm−1) regions, whose evolution will be shown with globally fitted data in detail.
C ethylenic stretching mode.17,18 The 1169 cm−1 and 1201 cm−1 bands are assigned as C–C stretching mode.18,19 Typical hydrogen out-of-plane (HOOP) vibrational modes were seen at 831 and 884 cm−1, and methyl rocking mode was observed at 1009 cm−1.18,19 In Fig. 3b, transient stimulated Raman spectra of WT KR2 in NaCl at selected time delays are shown, represented as the difference stimulated Raman spectrum between actinic pulse on minus actinic pulse off. We prefer to show the TSRS spectra as such difference spectra instead of conventional reconstructed all-positive Raman spectra, because for the latter a certain amplitude of the ground-state stimulated Raman spectrum has to be added, which requires visual inspection and therefore introduces a bias. In total, TSRS spectra at 96 delays were recorded. Positive and negative transient Raman signals were seen in the HOOP (∼800–1000 cm−1), the C–C stretching (∼1150–1250 cm−1) and the CC stretching (∼1510–1560 cm−1) regions, whose evolution will be shown with globally fitted data in detail.
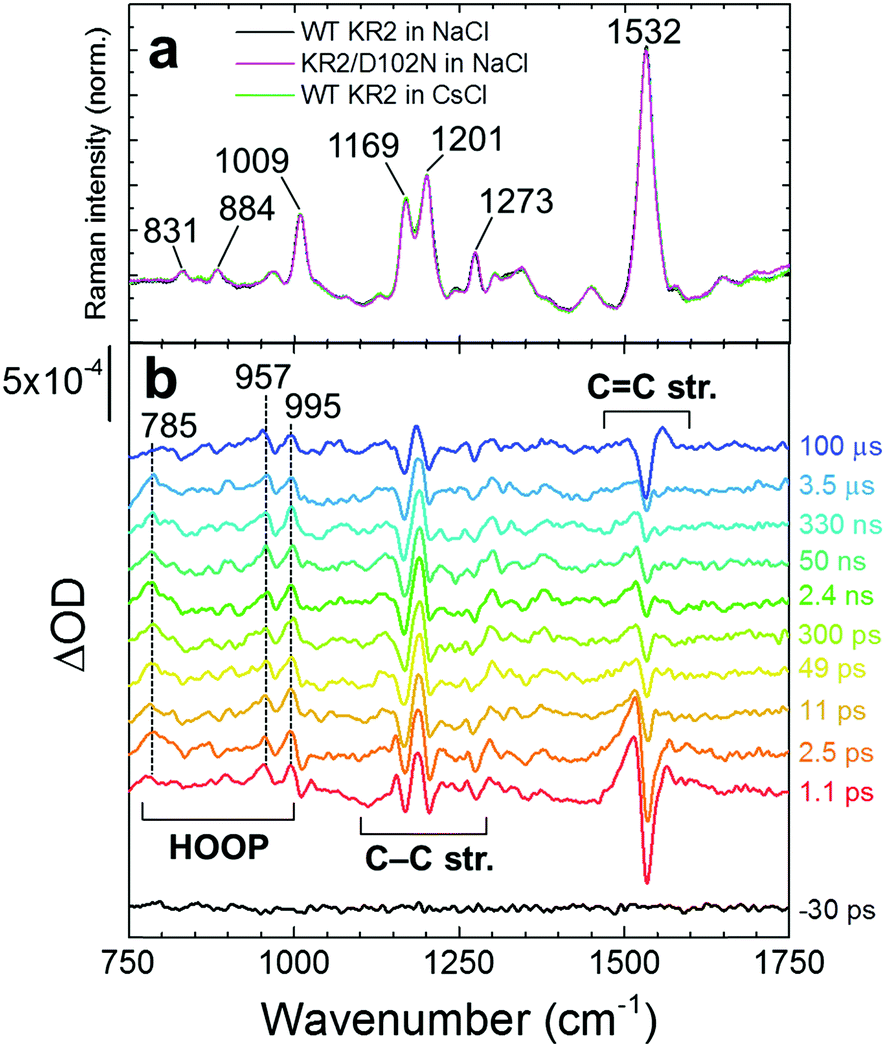 | ||
| Fig. 3 Baseline-free stimulated Raman spectra of WT KR2 in NaCl. (a) Ground state stimulated Raman spectra of WT KR2 in NaCl (black), KR2/D102N in NaCl (magenta) and WT KR2 in CsCl (light green). (b) Selected transient stimulated Raman spectra in WT KR2 in NaCl. | ||
The transient stimulated Raman spectra of WT KR2 were globally fitted with seven time components: 20 fs, 260 fs, 3.4 ps, 22 ps, 25 ns, 21 μs and infinity. Fig. S7–S9 (ESI†) show the raw, wavelet-processed TSRS data along with the fitting results. The 20 fs component is probably a coherent artifact with the three-pulse mixing and is not further considered. Fig. 4 shows EADS of the transient Raman spectra including HOOP, C–C stretching and CC stretching regions (The DADS are shown in Fig. S10, ESI†). The negative signals show GSB, and the positive signals show Raman spectra on the excited state and/or photoproduct states. In the transient absorption measurement, SE was seen in the near-infrared region at very early delay times in KR2 (Fig. S11, ESI†), so Raman initiated by nonlinear emission (RINE)20 signals that decayed mostly with 260 fs were observed on the excited state because of the 800 nm Raman pump pulses. The difference in number of fitting components in the transient Raman (seven) and the transient absorption (nine) spectra probably results from a lower signal-to-noise ratio in the former. Significant spectral shifts on transient Raman signals were seen in the C–C stretching region (Fig. 4b). Positive signals at 1156 and 1185 cm−1 appeared in 260 fs,19 while ground state bleach signals at 1169 cm−1 and 1205 cm−1 were seen. Similar peaks at 1194 cm−1 (positive), 1167 and 1201 cm−1 (negative) reported in 77 K FT-IR experiments,19 indicating those peaks are derived from the 13-cis retinal isomer in the K intermediate.
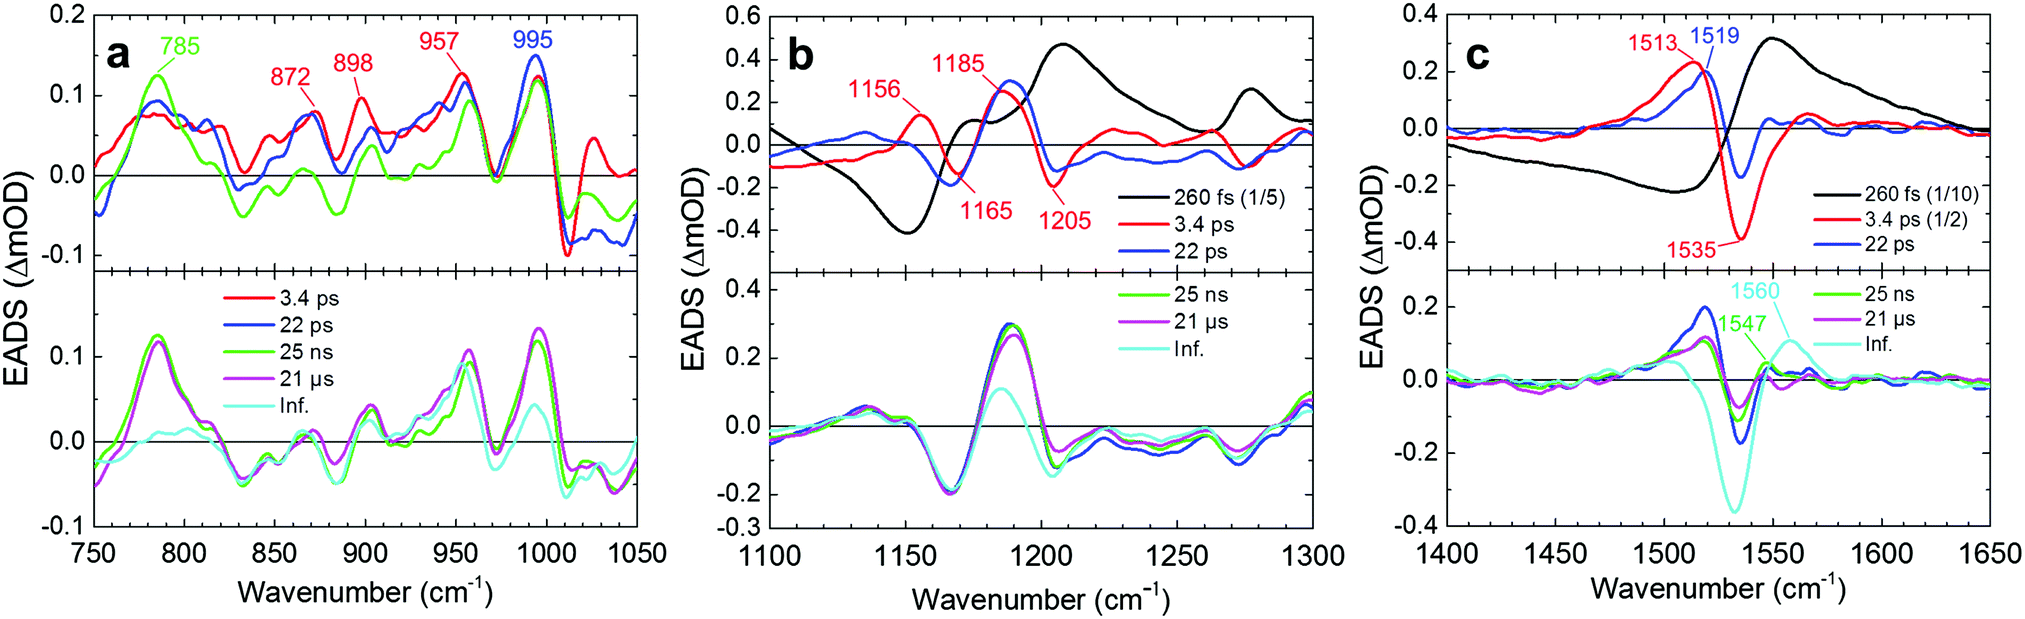 | ||
| Fig. 4 Globally fitted stimulated Raman spectra (EADS) of WT KR2 in NaCl. The signal evolves as 260 fs (black), 3.4 ps (red), 22 ps (blue), 25 ns (green), 21 μs (magenta) and an infinite time constant (cyan) in order. (a) EADS at 750–1050 cm−1 including the HOOP region. The 260 fs component is not shown. The first three (top) and the following two (bottom) time components are shown separately. The 25 ns component is shown on both of the top and the bottom figures for reference. EADS at (b) 1100–1300 cm−1 including the C–C stretching region and (c) 1400–1650 cm−1 including the CC stretching region. The 260 fs (in b and c) and 3.4 ps (in c) components are scaled down. The first three (top) and the following three (bottom) time components are shown separately. The 22 ps component is shown on both of the top and the bottom figures for reference. | ||
In the CC stretching region, a negative signal at around 1535 cm−1 was seen in the transient Raman spectra after 260 fs, which was continuous up to 100 μs (Fig. 4c). On the other hand, a positive signal at 1513 cm−1 appeared in 260 fs. Importantly, in 3.4 ps, the peak at 1513 cm−1 was blue-shifted to 1519 cm−1. The third spectrum has a lifetime of 22 ps (blue spectra in Fig. 4) and is almost identical to the 77 K FT-IR experiments.19 In 22 ps, the peak intensity at 1519 cm−1 decreased by a factor of 2, while a peak at 1547 cm−1 appeared. In 25 ns, the peak intensity at 1519 cm−1 was slightly increased, and that at 1547 cm−1 was decreased. In 21 μs, a positive peak at ∼1560 cm−1 appeared. Simultaneously with the 1560 cm−1 signal appearance, the positive peak at 1519 cm−1 completely decayed while the signal at 1547 cm−1 remained.
Clearly, positive difference Raman signals were seen in the HOOP region (∼800–1000 cm−1); e.g. at 785, 872, 898, 957 and 995 cm−1 after 260 fs, while no clear negative bands appeared in the HOOP region. In 22 ps, HOOP signals at ∼830–930 cm−1 dropped, while some strong positive signals remained up to 25 ns. Significant signal decrease of other peaks such as at 785 and 995 cm−1 was seen in 21 μs.
Similarly to WT KR2 in NaCl, transient Raman spectra of KR2/D102N in NaCl and KR2 WT in CsCl were globally fitted with seven exponential components (Fig. S12, S13 and Table S2, ESI†). Transient Raman spectra from 1.0 ps to 100 μs are shown in Fig. 5a–c. Fig. 5d shows transient Raman spectra of WT KR2 in NaCl, KR2/D102N in NaCl and WT KR2 in CsCl at 4.5 ps, 50 ps, 480 ns and 100 μs. The spectra at 4.5 ps were similar between the three different samples. However, different features were seen at 50 ps and at 480 ns between WT KR2 in NaCl and the other two samples in the CC stretching mode region; the ∼1547 cm−1 peak gained amplitude as compared to the ∼1519 cm−1 peak in KR2/D102N in NaCl and WT KR2 in CsCl, while the ∼1519 cm−1 peak was more significant in WT KR2 in NaCl. At 100 μs, the ∼1560 cm−1 signal appeared in all of the three samples while the ∼1547 cm−1 signal remained in KR2/D102N in NaCl and WT KR2 in CsCl. Notably, the characteristics of the transient Raman spectra of KR2/D102N in NaCl and WT KR2 in CsCl were very similar up to 100 μs. In Fig. 5e–g, the evolution of signals at 1519 cm−1, 1547 cm−1 and 1560 cm−1 are shown. In ∼20 ps, the 1547 cm−1 signal rose above that of 1519 cm−1 in KR2/D102N in NaCl and WT KR2 in CsCl, differently from WT KR2 in NaCl. In ∼60 ns, the signal at 1519 cm−1 slightly rose again, while the 1547 cm−1 signal decayed in the three different samples. In ∼20 μs, a blue-shifted peak appeared at 1560 cm−1 as in WT KR2 in NaCl, but the 1547 cm−1 signal remained at a higher amplitude in KR2/D102N in NaCl and WT KR2 in CsCl than in WT KR2 in NaCl.
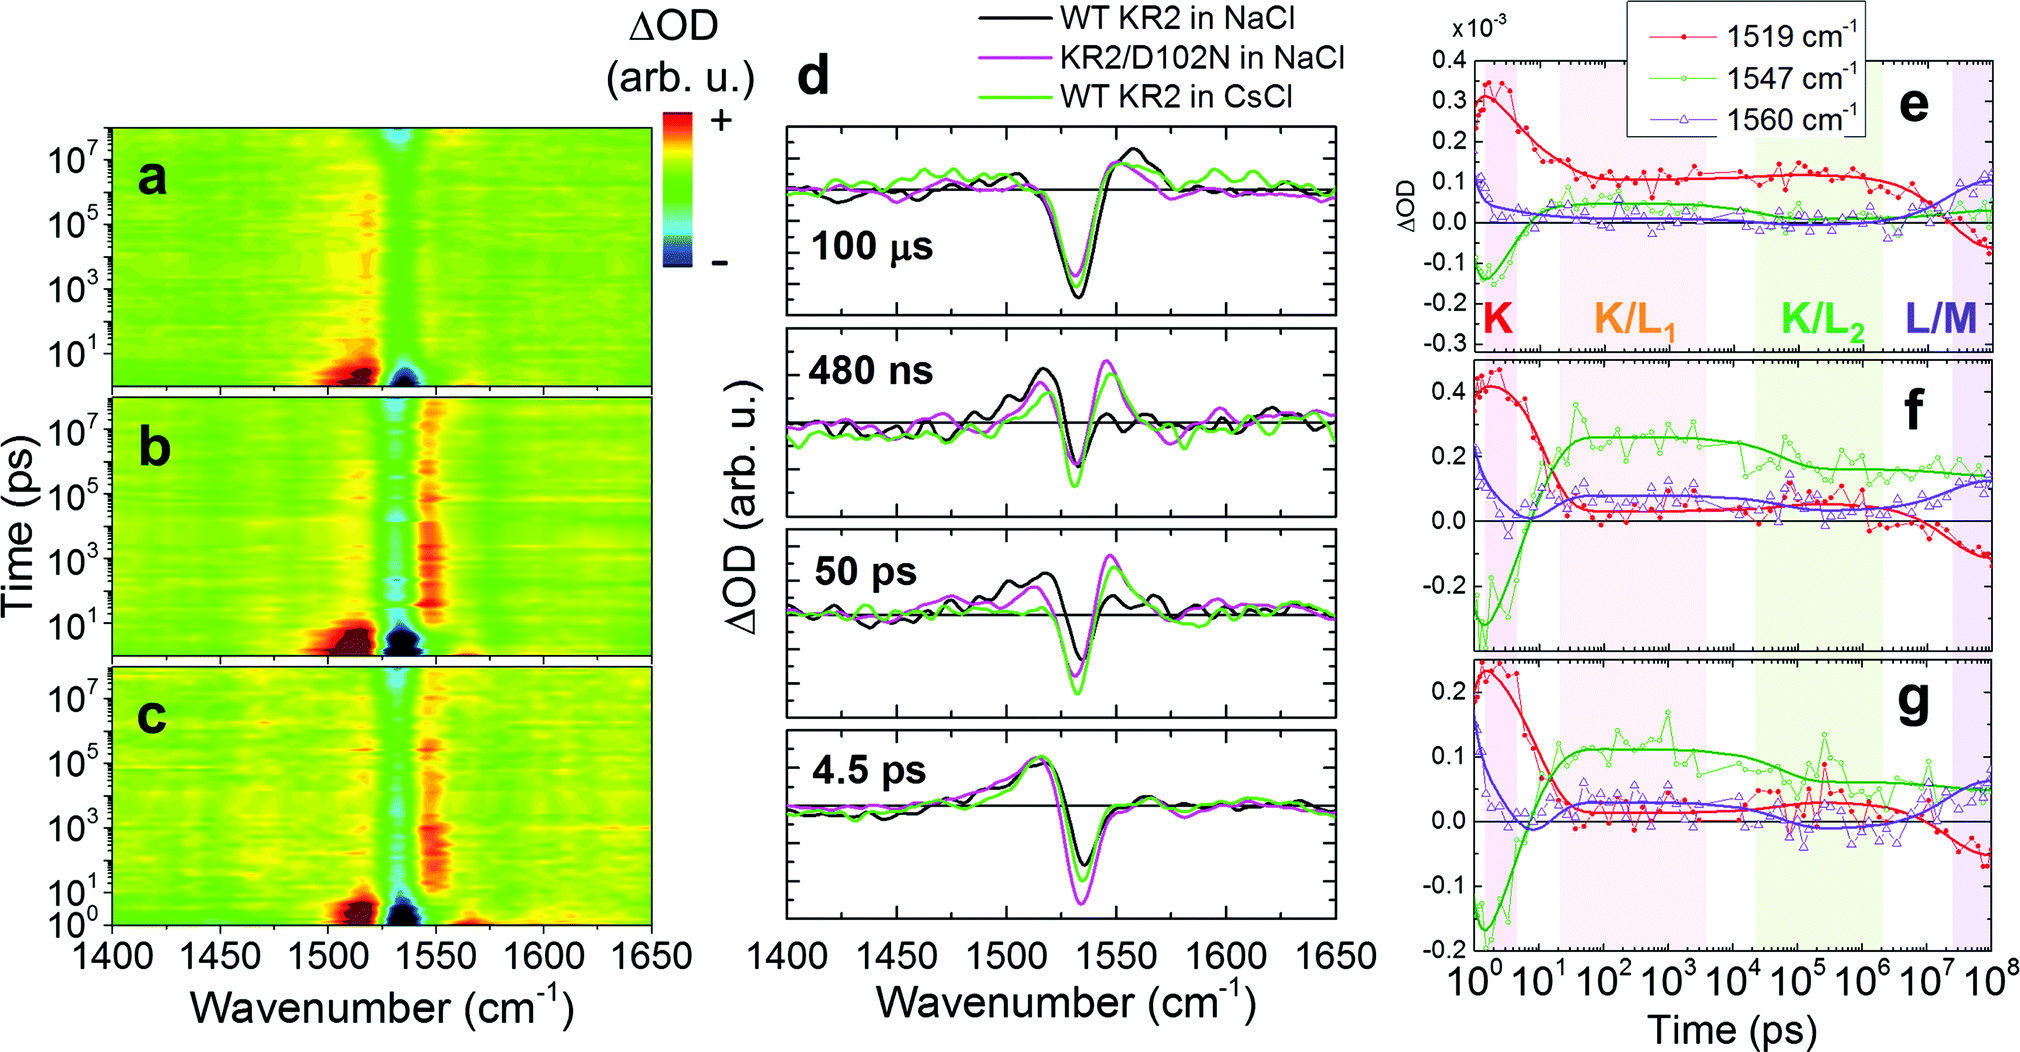 | ||
| Fig. 5 Transient stimulated Raman spectra in the CC stretching region in WT KR2 in NaCl, KR2/D102N in NaCl and WT KR2 in CsCl. Two-dimensional false color representation of transient stimulated Raman spectra of (a) WT KR2 in NaCl, (b) KR2/D102N in NaCl and (c) WT KR2 in CsCl in the spectral region of 1400–1650 cm−1. The difference Raman signals are color-coded as red for positive, green for zero and blue for negative. (d) Normalized transient Raman spectra of WT KR2 in NaCl (black), KR2/D102N in NaCl (magenta) and WT KR2 in CsCl (light green) at 4.5 ps, 50 ps, 480 ns and 100 μs. Time traces of stimulated Raman signals at 1519 cm−1 (red closed dots with a red fitting line), 1547 cm−1 (open green dots with a green fitting line) and 1560 cm−1 (open purple triangles with a purple fitting line) in (e) WT KR2 in NaCl, (f) KR2/D102N in NaCl and (g) WT KR2 in CsCl. | ||
Discussion
With femtosecond-to-picosecond time resolved stimulated Raman spectra, we discuss the excited-state dynamics and the retinal isomerization. The 260 fs decay of the RINE signals, which result from non-linear emission on the excited state,20 implies excited-state population decays mostly in 260 fs. Since typical vibrational peaks from 13-cis retinal (1185 cm−1)19 appeared in 260 fs with the ground state bleach at 1165 and 1205 cm−1, it is clearly shown that the first isomerized J intermediate is formed in 260 fs. The ∼200 fs J-intermediate formation can be also characterized by transient absorption spectra (Fig. 2b); in ∼200 fs, the red-shifted species at 602 nm appeared with the decay of the stimulated emission (Fig. 2b, Fig. S1 and S2, ESI†), which indicates the first photoproduct J intermediate is formed in ∼200 fs.8 Because the frequency of the CC stretching mode is correlated with the retinal absorption energy, it is considered that the red-shifted CC stretching mode (1513 cm−1) corresponds to the J intermediate (Fig. 4c). Notably, the appearance of the positive HOOP signals after the J-intermediate formation indicates the 13-cis retinal is markedly distorted compared to the all-trans retinal, as previously shown in bacteriorhodopsin.21
Here we discuss the J-to-K state transition, which is interpreted as a vibrational cooling on the primary photoproduct state. When the system relaxes to the bottom of the potential energy well, the energy gap for the electronic transition to higher electronic states becomes larger, which results in the blue shift of the absorption. Thus, observation of the blue shift is useful to identify the time scale of the J-to-K transition. On the transient absorption spectra in Fig. 2, the blue shift was observed in two time constants: 420 fs and 2.4 ps. However, owing to the broad photoproduct absorption peaks and the overlap with the negative signals from the ground state bleach and the stimulated emission, it is difficult to decide which time component is involved in the J-to-K transition. On the other hand, the Raman spectra have narrower peaks, which make it easier to identify the time scale of the K-intermediate formation. We observe a 6 cm−1 blue shift on the CC stretching region with ∼3 ps in EADS (Fig. 4c) and the time trace of the peak position (Fig. S14, ESI†), indicating that the J-to-K transition occurs on that timescale. A similar blue-shifted CC stretching mode in J-to-K transition was seen in bacteriorhodopsin.21
Next, we discuss the retinal dynamics of KR2 on the photoproduct intermediates after the K-intermediate formation. The EADS of the transient Raman spectra in the CC stretching region (1510–1560 cm−1) indicate that there are four different intermediate photoproduct states up to 100 μs: evolving with 22 ps, 25 ns, 21 μs and longer than 100 μs (infinity) (Fig. 4). The blue-shifted CC Raman signal at ∼1547 cm−1 that rose in 22 ps is assigned as the L state, which is a typical blue-shifted absorption species in microbial rhodopsins.9,11,22 With the L-state formation, the HOOP signals at ∼830–930 cm−1 dropped (Fig. 4a), which suggests that the retinal chromophore structurally relaxes, but this may also result from slightly reduced resonance conditions of L with respect to K. In channelrhodopsin, the L state showed significant HOOP intensity in time-resolved infrared spectroscopy.23 Significantly, the L-state signal (1547 cm−1) rose in 22 ps while the K-state signal (1519 cm−1) did not completely disappear (Fig. 4c, green line and Fig. 5e). The coexistence of the positive peaks at 1519 cm−1 and 1547 cm−1 indicates that KR2 forms distinct K/L equilibrium states between ∼20 ps and ∼20 μs. The two distinct newly found K/L equilibrium intermediates are described as K/L1 (formed in 22 ps, Fig. 4c, green line) and K/L2 (formed in 25 ns, Fig. 4c, magenta line) intermediates. In 25 ns, the 1519 cm−1 signal slightly rose again while the peak intensity at 1547 cm−1 decreased (Fig. 4c), which implies the equilibrium of K/L shifts back to K in the K/L2 intermediate before the formation of the following L/M intermediate. Even though the L-state structure of KR2 is unsolved, it can be suggested that the retinal Schiff base is oriented to the counterions with a closer distance on the L state, similar to bacteriorhodopsin.9,10 Because the K/L equilibrium slightly shifts back to K again in ∼30 ns, the distance between the retinal Schiff base and the counterions might become longer before the M-state formation.
The blue-shifted 1560 cm−1 band, which forms in ∼20 μs can be assigned as the M state (Fig. 4c, cyan line). The mixture of the positive peaks at 1547 cm−1 and 1560 cm−1 indicates the L state coexists with the M state, forming an L/M intermediate in ∼20 μs as seen in the flash photolysis experiments1 and our transient absorption experiments (Fig. 2). Significant decrease of the HOOP signals at 785 and 995 cm−1 in 21 μs implies that the twist of the retinal is relaxed with the formation of the M state as seen in bacteriorhodopsin.24 From the overall discussion above, a new photocycle model from femtoseconds to submilliseconds is proposed in Fig. 6.
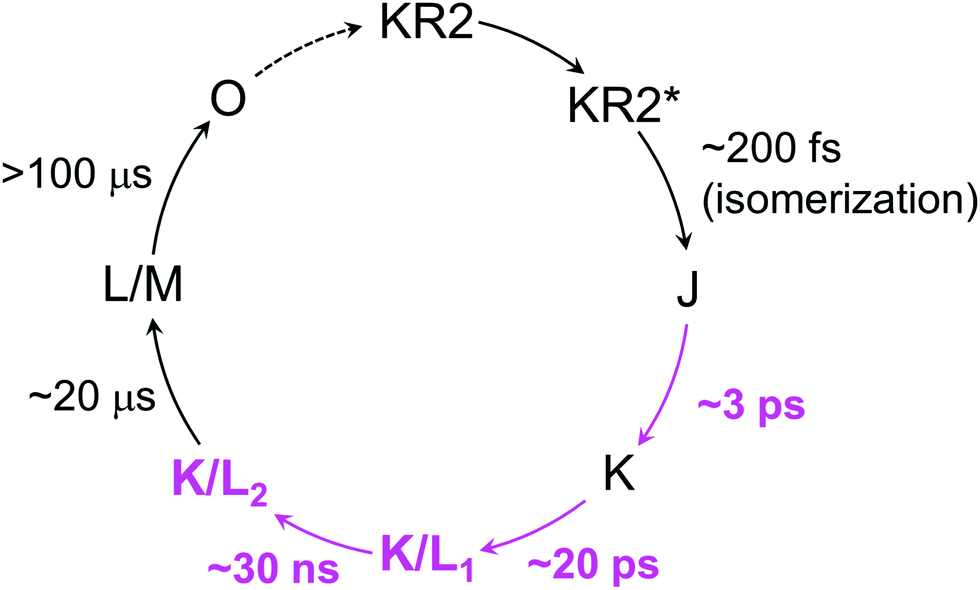 | ||
| Fig. 6 A new photocycle model of WT KR2 in NaCl. The newly identified intermediates and time components by this work are high-lighted as magenta. The O-intermediate formation and decay have previously been proposed.1,8 | ||
We now compare the retinal dynamics of WT KR2 in NaCl (Na+ bound, Na+ transport), KR2/D102N in NaCl (Na+ unbound, Na+ transport) and WT KR2 in CsCl (Na+ unbound, H+ transport). A similar photocycle up to 100 μs in Fig. 6 can be applied to the three different sample conditions, albeit with important differences as outlined below. At 4.5 ps, 50 ps, 480 ns and 100 μs, the retinal of KR2 is in the K, K/L1, K/L2 and L/M intermediate, respectively (Fig. 5d). The ground state stimulated Raman spectra of WT KR2 in NaCl, KR2/D102N in NaCl and WT KR2 in CsCl were almost identical as seen in Fig. 3a. Moreover, no significant difference was seen in transient Raman spectra at 4.5 ps in the three different conditions as seen in 77 K FT-IR experiments.19 These results imply that the molecular structure of the all-trans retinal and the 13-cis retinal in the K intermediate is identical regardless of the Na+ binding on the extracellular side and whether Na+ or H+ is transported.
In the K/L1 intermediate, clear differences between the three different samples were observed in the TSRS experiments: the L state signal (1547 cm−1) is dominant as compared to the K state signal (1519 cm−1) in KR2/D102N in NaCl and WT KR2 in CsCl, while the K state is more significant than the L state in WT KR2 in NaCl, as clearly seen in the false color time-wavenumber plots of Fig. 5a–c, and the time-resolved Raman spectra of Fig. 5d. These observations imply that the equilibrium in the K/L1 intermediate shifts to L in the absence of Na+ binding at the extracellular side. In the K/L2 intermediate, the equilibrium slightly shifts to K as compared to in K/L1 intermediate, although the L state is still dominant in the absence of Na+ binding on the extracellular side. The shift of the K/L equilibrium is clearly seen in the time traces of 1519 cm−1 and 1547 cm−1 signals in Fig. 5e–g. Furthermore, in the L/M intermediate at 100 μs, the M-state peak at 1560 cm−1 has lower amplitude in the D102N mutant and WT KR2 in CsCl (Fig. 5d). This indicates that the equilibrium shifts to L in the L/M intermediate in the absence of the extracellular Na+ binding. Possibly, the distance between the retinal Schiff base and the counterions is different with and without the extracellular Na+ binding, which makes the difference in the K/L/M equilibrium (Fig. 7). Notably, in the case where Na+ is unbound to KR2, the K/L/M equilibrium state is very similar regardless of which ion, Na+ or H+, is transported.
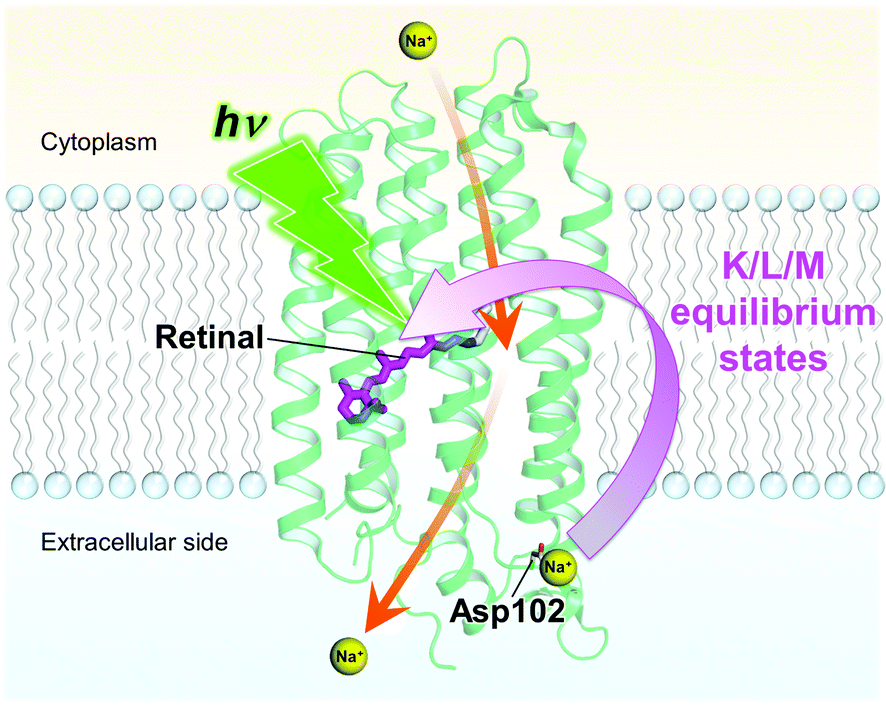 | ||
| Fig. 7 Proposed model of the extracellular Na+ binding that affects the primary dynamics of retinal between picoseconds and microseconds. The Na+ ion bound on the extracellular side affects the K/L and L/M equilibrium states of the retinal. The protein structure is based on Gushchin et al. (PDB ID: 4XTN). The proposed Na+ pumping pathway1 is drawn with orange arrows. | ||
A protomer of the pentameric KR2 has two different Na+ binding sites; (i) bound to Tyr25 (on TM1) and Thr87 main chain carbonyl groups of Thr83 and Phe86 (on TM2), and (ii) bound to Asp102 (on TM2–TM3 loop) (Fig. 1a).4 On the other hand, monomeric KR2 has only a Na+ binding site (i), near Tyr25 and Thr87, lacking the Na+ binding to Asp102 on the TM2–TM3 loop.4 Between the monomeric and pentameric forms, significant structural differences were seen in the first half of TM3, while no notable difference was observed in other regions (Fig. S15, ESI†).4 Possibly, Na+ binding to Asp102 affects the structure of the half of TM3 even though the structural difference might be just from difference of the oligomeric states. The structural difference on the half of TM3 is perhaps involved in the K/L/M equilibrium states, although it does not affect the retinal structure on the steady state and the K intermediate. However, to fully understand how Na+ influences the ps–μs retinal dynamics in K/L1, K/L2 and L/M intermediates, tracing backbone transitions in those time scales with further time-resolved experiments is required.
Conclusion
We investigated the photocycle of sodium ion pump rhodopsin KR2 by applying the watermarked femto- to submillisecond transient stimulated Raman spectroscopy technique. By considering the transient Raman spectra on hydrogen-out-of-plane (HOOP), C–C stretching and CC stretching modes, we propose a new photocycle model of KR2, evolving to J (formed in ∼200 fs) → K (∼3 ps) → K/L1 (∼20 ps) → K/L2 (∼30 ns) → L/M (∼20 μs). We also observed that the retinal conformation and the dynamics in the three probed conditions were almost identical in the ground state and the K intermediate. However, significant differences were observed in K/L1, K/L2 and L/M intermediates, as the K/L and L/M equilibrium shifts to L in the absence of extracellular bound Na+. By our research, it was revealed for the first time that the extracellular Na+ binding plays an important role on the primary photoreactions from picoseconds to microseconds, while the identity of the transported ion, Na+ or H+, does not affect the photocycle.
Methods
Protein expression and purification
The protein samples of WT KR2 and D102N mutant were expressed in E. coli (C41(DE3) strain) and purified as previously reported.2 The purified proteins were solubilized in 1.0% n-dodecyl-β-D-maltoside (DDM), 100 mM NaCl, 50 mM Tris-HCl (pH 8.0). For the spectroscopic measurement in CsCl solution, the solvent was exchanged to that containing 100 mM CsCl instead of NaCl. The proteins were concentrated to 200 μM (5.0 mg mL−1) for transient absorption experiments, and to 2.0 mM (50 mg mL−1) for stimulated Raman experiments, with using a centrifugal filter device (Millipore 30 kDa Mw cutoff). The samples were filled in a homemade sample holder that has two 2 mm-thick CaF2 plates. The sample thickness was set as 400 μm for transient absorption experiments and 200 μm for stimulated Raman experiments with an appropriate sample spacer. The sample holder was set on a Lissajous scanner that ensures sample refreshment between laser shots with a time interval of 60 seconds between successive exposures to the laser pulses.25Transient absorption spectroscopy
Transient absorption measurements were performed with a femtosecond-to-submillisecond pump–probe setup as reported previously.15 A sapphire plate was used for supercontinuum white light generation, and a selected wavelength region; 430–730 nm or 720–940 nm, wase detected by the photodiode array. The time delay was varied up to 150 μs at 164 data points with the minimum temporal step of 50 fs. The diameters of the pump and the probe beams at the sample position were ∼200 μm and ∼70 μm, respectively. The wavelength of the pump beam was centered at 520 nm, and the power was attenuated to ∼500 nJ. The instrumental response function was ∼80 fs, estimated from global analysis.Baseline-free transient stimulated Raman spectroscopy
Femtosecond to submillisecond time-resolved stimulated Raman experiments were performed with the watermarked baseline-free stimulated Raman setup reported previously.14 Raman pump (800 nm, ∼20 μJ) and Raman probe (∼840–960 nm) were spatiotemporally overlapped at the sample position with the diameter of ∼100 μm. Actinic pump (∼520 nm, ∼600 nJ) was focused on the protein sample to a diameter of ∼150 μm with a time delay from −50 ps to 110 μs at 96 data points (logarithmically spaced after 2 ps), generated by an optical delay and an electronic delay as reported previously.15 Raman pumps pass through a specially-designed chopper blade for watermarking approach,14 which produces 14 Raman pump sequences whose wavelengths are slightly shifted each other.14 As a result, 14 different stimulated Raman experiments are effectively performed simultaneously, which makes the baseline-free watermarking approach possible. The sample exposure time to the beams was ∼1 hour in total for each time-resolved stimulated Raman experiment.Global analysis methodology
Global analysis was performed for the transient absorption spectra and the transient stimulated Raman spectra using the Glotaran program.15,26 With global analysis, all wavelengths/wavenumbers were analyzed simultaneously with a set of common time constants.16 A kinetic model was applied consisting of sequentially interconverting, evolution-associated difference spectra (EADS), i.e. 1 → 2 → 3 →⋯ in which the arrows indicate successive mono-exponential decays of a time constant, which can be regarded as the lifetime of each EADS.16 The first EADS corresponds to the difference spectrum at time zero. The first EADS evolves into the second EADS with time constant τ1, which in turn evolves into the third EADS with time constant τ2, etc. The procedure clearly visualizes the evolution of the intermediate states of the protein.27 Decay-associated difference spectra (DADS) indicate the spectral changes with parallel decay channels and independent decay time constants. It is important to note that the parallel and the sequential analysis are mathematically equivalent and yield identical time constants.28 The standard errors in the time constants were less than 5% for the transient absorption and less than 10% for the transient stimulated Raman results.26,27Author contributions
K. I. and Y. K. expressed and purified the samples; Y. H. performed transient absorption experiments; Y. H., K. I. and M. K. performed transient stimulated Raman experiments; Y. H. analyzed the data; Y. H. and K. I. wrote the manuscript, edited by H. K. and J. T. M. K.; H. K. and J. T. M. K. supervised the project.Competing financial interests
The authors declare no competing financial interests.Acknowledgements
Y. H., M. K. and J. T. M. K. were supported by the Chemical Sciences Council of the Netherlands Organization for Scientific Research (NWO) through a VICI grant to J. T. M. K., a VENI grant to M. K. and a Middelgroot investment grant to J. T. M. K. This work was also supported by JSPS KAKENHI Grant to K. I. (26708001, 26115706, 26620005) and H. K. (25104009, 15H02391).References
- K. Inoue, H. Ono, R. Abe-Yoshizumi, S. Yoshizawa, H. Ito, K. Kogure and H. Kandori, Nat. Commun., 2013, 4, 1678 CrossRef PubMed.
- H. E. Kato, K. Inoue, R. Abe-Yoshizumi, Y. Kato, H. Ono, M. Konno, S. Hososhima, T. Ishizuka, M. R. Hoque, H. Kunitomo, J. Ito, S. Yoshizawa, K. Yamashita, M. Takemoto, T. Nishizawa, R. Taniguchi, K. Kogure, A. D. Maturana, Y. Iino, H. Yawo, R. Ishitani, H. Kandori and O. Nureki, Nature, 2015, 521, 48–53 CrossRef CAS PubMed.
- I. Gushchin, V. Shevchenko, V. Polovinkin, V. Borshchevskiy, P. Buslaev, E. Bamberg and V. Gordeliy, FEBS J., 2016, 283, 1232–1238 CrossRef CAS PubMed.
- I. Gushchin, V. Shevchenko, V. Polovinkin, K. Kovalev, A. Alekseev, E. Round, V. Borshchevskiy, T. Balandin, A. Popov, T. Gensch, C. Fahlke, C. Bamann, D. Willbold, G. Buldt, E. Bamberg and V. Gordeliy, Nat. Struct. Mol. Biol., 2015, 22, 390–395 CAS.
- R. A. Mathies, C. H. Brito Cruz, W. T. Pollard and C. V. Shank, Science, 1988, 240, 777–779 CAS.
- D. Xu, C. Martin and K. Schulten, Biophys. J., 1996, 70, 453–460 CrossRef CAS PubMed.
- K. C. Hasson, F. Gai and P. A. Anfinrud, Proc. Natl. Acad. Sci. U. S. A., 1996, 93, 15124–15129 CrossRef CAS.
- S. Tahara, S. Takeuchi, R. Abe-Yoshizumi, K. Inoue, H. Ohtani, H. Kandori and T. Tahara, J. Phys. Chem. Lett., 2015, 6, 4481–4486 CrossRef CAS PubMed.
- J. K. Lanyi and B. Schobert, J. Mol. Biol., 2003, 328, 439–450 CrossRef CAS PubMed.
- T. Kouyama, T. Nishikawa, T. Tokuhisa and H. Okumura, J. Mol. Biol., 2004, 335, 531–546 CrossRef CAS PubMed.
- O. P. Ernst, D. T. Lodowski, M. Elstner, P. Hegemann, L. S. Brown and H. Kandori, Chem. Rev., 2014, 114, 126–163 CrossRef CAS PubMed.
- P. Kukura, D. W. McCamant and R. A. Mathies, Annu. Rev. Phys. Chem., 2007, 58, 461–488 CrossRef CAS PubMed.
- M. Kloz, R. van Grondelle and J. T. M. Kennis, Phys. Chem. Chem. Phys., 2011, 13, 18123–18133 RSC.
- M. Kloz, J. WeiSsenborn, T. Polivka, H. A. Frank and J. T. M. Kennis, Phys. Chem. Chem. Phys., 2016, 18, 14619–14628 RSC.
- J. Ravensbergen, F. F. Abdi, J. H. van Santen, R. N. Frese, B. Dam, R. van de Krol and J. T. M. Kennis, J. Phys. Chem. C, 2014, 118, 27793–27800 CAS.
- I. H. M. van Stokkum, D. S. Larsen and R. van Grondelle, Biochim. Biophys. Acta, Bioenerg., 2004, 1657, 82–104 CrossRef CAS PubMed.
- T. Althaus, W. Eisfeld, R. Lohrmann and M. Stockburger, Isr. J. Chem., 1995, 35, 227–251 CrossRef CAS.
- S. O. Smith, M. S. Braiman, A. B. Myers, J. A. Pardoen, J. M. L. Courtin, C. Winkel, J. Lugtenburg and R. A. Mathies, J. Am. Chem. Soc., 1987, 109, 3108–3125 CrossRef CAS.
- H. Ono, K. Inoue, R. Abe-Yoshizumi and H. Kandori, J. Phys. Chem. B, 2014, 118, 4784–4792 CrossRef CAS PubMed.
- D. W. McCamant, P. Kukura and R. A. Mathies, J. Phys. Chem. B, 2005, 109, 10449–10457 CrossRef CAS PubMed.
- S. Shim, J. Dasgupta and R. A. Mathies, J. Am. Chem. Soc., 2009, 131, 7592–7597 CrossRef CAS PubMed.
- L. Zimanyi, J. Saltiel, L. S. Brown and J. K. Lanyi, J. Phys. Chem. A, 2006, 110, 2318–2321 CrossRef CAS PubMed.
- V. A. Lorenz-Fonfria, T. Resler, N. Krause, M. Nack, M. Gossing, G. F. von Mollard, C. Bamann, E. Bamberg, R. Schlesinger and J. Heberle, Proc. Natl. Acad. Sci. U. S. A., 2013, 110, E1273–E1281 CrossRef CAS PubMed.
- J. Sasaki, A. Maeda, C. Kato and H. Hamaguchi, Biochemistry, 1993, 32, 867–871 CrossRef CAS PubMed.
- M. T. Alexandre, T. Domratcheva, C. Bonetti, L. J. van Wilderen, R. van Grondelle, M. L. Groot, K. J. Hellingwerf and J. T. Kennis, Biophys. J., 2009, 97, 227–237 CrossRef CAS PubMed.
- J. J. Snellenburg, S. P. Laptenok, R. Seger, K. M. Mullen and I. H. M. van Stokkum, J. Stat. Softw., 2012, 49, 1–22 Search PubMed.
- J. T. M. Kennis and M. L. Groot, Curr. Opin. Struct. Biol., 2007, 17, 623–630 CrossRef CAS PubMed.
- K. C. Toh, E. A. Stojkovic, I. H. van Stokkum, K. Moffat and J. T. Kennis, Phys. Chem. Chem. Phys., 2011, 13, 11985–11997 RSC.
Footnotes |
| † Electronic supplementary information (ESI) available. See DOI: 10.1039/c6cp05240a |
| ‡ These authors contributed equally to this work. |
| This journal is © the Owner Societies 2016 |