 Open Access Article
Creative Commons Attribution 3.0 Unported Licence
Biphasic aggregation of a perylene bisimide dye identified by exciton-vibrational spectra
P.-A.
Plötz
a,
S. P.
Polyutov
ab,
S. D.
Ivanov
a,
F.
Fennel
a,
S.
Wolter
a,
T.
Niehaus
c,
Z.
Xie
d,
S.
Lochbrunner
a,
F.
Würthner
 d and
O.
Kühn
*a
aInstitut für Physik, Universität Rostock, Albert-Einstein-Str. 23-24, 18059 Rostock, Germany. E-mail: oliver.kuehn@uni-rostock.de
bLaboratory for Nonlinear Optics and Spectroscopy, Siberian Federal University, Svobodniy 79, 660041 Krasnoyarsk, Russia
cUniversité Claude Bernard Lyon 1, CNRS, Institut Lumière Matière, F-69622, Villeurbanne, France
dInstitut für Organische Chemie & Center for Nanosystems Chemistry, Universität Würzburg, Am Hubland, 97074 Würzburg, Germany
First published on 17th August 2016
Abstract
The quantum efficiency of light emission is a crucial parameter of supramolecular aggregates that can be tuned by the molecular design of the monomeric species. Here, we report on a strong variation of the fluorescence quantum yield due to different phases of aggregation for the case of a perylene bisimide dye. In particular, a change of the dominant aggregation character from H- to J-type within the first aggregation steps is found, explaining the observed dramatic change in quantum yield. This behaviour is rationalised by means of a systematic study of the intermolecular potential energy surfaces using the time-dependent density functional based tight-binding (TD-DFTB) method. This provides a correlation between structural changes and a coupling strength and supports the notion of H-type stacked dimers and J-type stack-slipped dimers. The exciton-vibrational level structure is modelled by means of an excitonic dimer model including two effective vibrational modes per monomer. Calculated absorption and fluorescence spectra are found to be in reasonable agreement with experimental ones, thus supporting the conclusion on the aggregation behaviour.
1 Introduction
Aggregates of chromophores are prospective components for photonic applications based on organic materials.1–3 Here, aggregates of substituted perylene bisimides have attracted particular attention.2,4 For instance, it has been shown that some perylene bisimides are suitable for long range exciton migration,5–7 while others exhibit a rapid localisation of electronic excitations.8 Control over the aggregation behaviour is obviously crucial for tuning the functional properties.9,10 Usually, it is achieved by concentration, temperature, and appropriate substitution,11,12 but also control via the solvent,13 the pH-value14,15 and the sample processing16 has been demonstrated. Previously, we have shown a non-trivial example for dye aggregation upon increasing concentration.17 The observed biphasic behaviour is reflected in a non-monotonous change of the emission spectrum. Such a biphasic behaviour has also been reported for other dyes16,18 as well as for organic molecular crystals.19 The mechanistic picture of biphasic aggregation can be derived from concentration-dependent aggregation models.17,20–22For the case of the perylene bisimide dye shown in Fig. 1 we recently have put forward a concentration-dependent model, which describes the observed biphasic aggregation.17 The central idea is that two kinds of dimers exist. One is energetically favoured and corresponds to the optimal dimer structure. It dominates at intermediate concentrations, respectively, temperatures. However, this favoured dimer is not suitable for the attachment of further monomers due to spatial hindrance. The ability to associate further molecules is reserved to a second dimeric structure, which has a higher energy and exists only in a very low fraction, but can grow to larger aggregates. It has been shown that the corresponding model reproduces accurately the evolution of the absorption spectrum in dependence on the concentration over several orders of magnitude.17 To rationalise these findings we have proposed that the energetically favoured dimer adopts a stacked H-type configuration, called H-dimer in the following, and the other one a slipped-stack J-type configuration (shifted along the long axis of the PBI1).
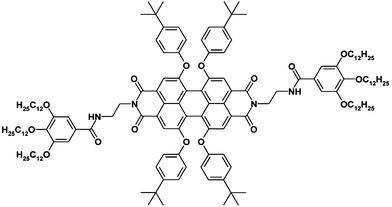 | ||
| Fig. 1 Chemical structure of the considered perylene bisimide derivative PBI1 (N,N-di[N-(2-aminoethyl)-3,4,5-tris(dodecyloxy)benzamide]-1,6,7,12-tetra(4-tert-butylphenoxy)perylene-3,4:9,10-tetracarboxylic acid bisimide).23 | ||
In the present contribution we expand on the intricate aggregation behaviour of PBI1 (cf.Fig. 1) by providing an interpretation of the observed absorption and emission spectra of the different species in terms of an exciton-vibronic dimer model. The latter usually serves as the simplest system for a quantitative investigation of the effect of electron-vibrational coupling on spectra and dynamics of aggregates (see, e.g.ref. 24–28 and for reviews ref. 29 and 30). The present theoretical model is based on density functional theory (DFT) and, in particular, on the density functional based tight-binding (DFTB) method.31,32 It provides not only an efficient way to obtain aggregate geometries, but also enables scanning the potential energy surface for the inter-monomer Coulomb coupling using the approach developed in ref. 33.
In addition, we present new experimental data, where PBI1 aggregation in methylcyclohexane is examined by temperature-dependent absorption spectroscopy, which is a widely applied tool for monitoring aggregation processes.16,34 A detailed evaluation of the temperature-dependent extinction and emission spectra provides insight into the aggregation process and reveals characteristic changes in the spectra to be used for fine-tuning the theoretical model.
The paper is organised as follows: In Section 2 a brief account is given on Frenkel exciton theory including exciton-vibrational interaction. Further, computational details are provided such as those related to the DFTB approach. The experimental methods are described in Section 3. The experimental and simulation results are presented in Section 4 and 5, respectively, and summarised in Section 6.
2 Theoretical model
2.1 Frenkel exciton Hamiltonian
The starting point is an electronic two-level description of the monomer with |gm〉 and |em〉 being the ground (S0) and the first excited electronic state (S1) at site m, respectively. In order to describe the vibronic coupling of the local electronic S0–S1 transitions to intra-monomer nuclear degrees of freedom, we adopt the Huang–Rhys (HR) model of linearly shifted harmonic oscillator potentials.35 Restricting ourselves to the one-exciton manifold, with exciton states defined as , the Hamiltonian reads
 | (1) |
 | (2) |
 | (3) |
 | (4) |
For the calculation of absorption and emission spectra the exciton-vibrational states of the zero- and one-exciton manifolds are required. In the following the multi-mode vibrational states will be denoted as |Mgm〉 for the ground and |Mem〉 for the electronic excited state (M = (M1, M2,…) with Mξ being the quantum number for the ξth mode). Further, we restrict ourselves to a dimer model, i.e. m = 1, 2. The zero-exciton vibrational states are given by
| |αa〉 ≡ |0, Mg1, Mg2〉 = |g1〉|g2〉|Mg1〉|Mg2〉, | (5) |
Hvib|0〉|Mg1〉|Mg2〉 = [E(Mg1) + E(Mg2)]|0〉|Mg1〉|Mg2〉 ≡ ![[scr E, script letter E]](https://www.rsc.org/images/entities/char_e140.gif) a|αa〉, a|αa〉, | (6) |
 | (7) |
| |1, Me1, Mg2〉 = |e1〉|g2〉|Me1〉|Mg2〉 | (8) |
| |2, Mg1, Me2〉 = |g1〉|e2〉|Mg1〉 |Me2〉. | (9) |
H|βb〉 = ![[scr E, script letter E]](https://www.rsc.org/images/entities/char_e140.gif) b|βb〉. b|βb〉. | (10) |
![[scr E, script letter E]](https://www.rsc.org/images/entities/char_e140.gif) b, and the coefficients, Cb, follow from a matrix diagonalisation in the basis set expansion, eqn (7).
b, and the coefficients, Cb, follow from a matrix diagonalisation in the basis set expansion, eqn (7).
Absorption and emission spectra can be calculated assuming the following dipole operator in Condon approximation and providing equal orientations of the monomeric transition dipoles
 | (11) |
 | (12) |
 | (13) |
2.2 Determination of model parameters
The monomer Hamiltonian is parametrised based on previous TD-DFT(B3LYP, 6-311G*) calculations36,37 and assuming identical monomers. The electronic excitation energy has been adopted from ref. 37 without change, i.e. Em = 17![[thin space (1/6-em)]](https://www.rsc.org/images/entities/char_2009.gif) 181 cm−1 (≈2.13 eV). In that reference the HR factors and mode frequencies are combined into a single effective mode with parameters
181 cm−1 (≈2.13 eV). In that reference the HR factors and mode frequencies are combined into a single effective mode with parameters  and
and  , respectively. Although this yields a reasonable fit to the absorption spectrum, in ref. 36 it has been shown that the broad vibronic sideband hides a more subtle structure of vibronic transitions. Therefore, we have chosen a model including two effective modes, i.e. a high- and a low-frequency one, as a compromise between the rigour of a high-dimensional model and the ease of interpretation. Based on the HR factors and frequencies,30,36,37 strongly coupled modes are located in the ranges 1370–1630 cm−1 and 200–220 cm−1 for absorption and 1280–1320 cm−1 and 200–220 cm−1 for emission. These modes are combined into two effective modes, with the parameters given in Table 1.
| h-Mode | l-Mode | |||
|---|---|---|---|---|
| Emission | Absorption | Emission | Absorption | |
| ω | 1275 (1453) | 1392 (1327) | 195 (205) | 208 (209) |
| S | 0.485 (0.37) | 0.556 (0.18) | 0.60 (0.60) | 0.41 (0.41) |
The monomer parameters have been refined by fitting the calculated spectra to the experimental absorption and emission ones. The set of fit parameters contains the frequencies and Huang–Rhys factors of the low- and high frequency modes for absorption and emission and the broadening of the corresponding spectra. The actual fitting has been performed with a genetic algorithm, where the fitness of a parameter set has been judged according to the area enclosed by the calculated and measured spectra (see Section 3) on an interval from −1000 cm−1 to +2000 cm−1 for absorption and −2500 cm−1 to +1000 cm−1 for emission, relative to the maximum of the spectrum. Thereby, the maxima of calculated and measured spectra have been shifted such as to coincide. The obtained monomer parameters are given in Table 1. Compared to the TD-DFT values, especially the specifications of the high frequency mode are noticeably modified. This can be explained as being due to a compensation effect, i.e. it reduces the discrepancy in the splitting between the 0–0 and the 0–1 type peaks. In ref. 36 this discrepancy has been attributed to the contribution of low-frequency modes, which are missing in the present effective mode model. The broadening Γ equals to 528 cm−1 for emission and 555 cm−1 for absorption.
The aggregation of PBI-derivatives in solution strongly depends not only on the π-stacking forces, but on bay substituents as well as on the solvent.11,38,39 Therefore, besides limitations of the computational model, there will be uncertainties in the aggregation structure, unless the full structure with all substituents as well as the solvent is included. In order to explore the dependence of the coupling strength on the dimer geometry, a reduced model is considered. It consists of the perylene core with OH bay substituents as shown in Fig. 2b. This model resembles that part of the system, where the leading HOMO and LUMO levels responsible for the S0–S1 transition are localised.37 In addition it allows exploring the intermolecular potential energy landscape without the steric constrains imposed by the bulky side groups. In passing we note that although the electronic excitations are often localised on the perylene core, one should keep in mind that especially the excitonic coupling could be influenced by structural changes introduced via peripheral substitutions. This issue will be explored below.
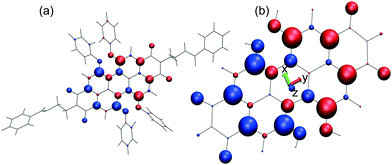 | ||
| Fig. 2 Transition densities represented by atomic-centred Mulliken transition charges from TD-DFTB;32 colour and size indicate sign and magnitude, respectively. Panel (a) shows the model of ref. 37 while in panel (b) the reduced model used in this work is given together with the principal axes coordinate system. Note the different scale in the two panels. The figure is generated using VMD.44 | ||
The intermolecular interactions are investigated using the time-dependent DFTB (TD-DFTB) method32 as detailed in ref. 33. Calculations are performed with a development version of the dftb+ program package31,32,40,41 and using the mio-1-1 Slater-Koster parameter set.31 Within this so-called Tight-Binding-Frenkel-Exciton-Hamiltonian (TBFE) approach the Coulomb coupling is calculated according to ref. 33 as
 | (14) |
The starting geometry of the reduced model dimer has been derived from the geometry-optimised dimer in ref. 36. The perylene core monomers (cf.Fig. 2(b)) have been cut-out, replacing all side-groups by hydrogen atoms. The actual TD-DFTB S0–S1 transition is calculated to be 1.92 eV for this reduced model, 0.3 eV below the TD-DFT/B3LYP result. In passing we note, that for the full model one obtains a value of 1.81 eV, which is also 0.3 eV below the TD-DFT/B3LYP one. Besides this shift of TD-DFTB excitation energies between the full and the core-only model, there is no appreciable influence of the model reduction as far as the atomic-centred Mulliken transition charges are concerned, compare panels (a) and (b) of Fig. 2.
TD-DFTB like TD-DFT suffers from the often erroneous description of charge transfer excitations.42,43 For the PBI1 core model this appears to be the case already for the monomer. Here, we find two optically forbidden charge transfer transitions at 1.47 eV, which are not considered in the following.
The exploration of the Coulomb coupling for the reduced model yields configurations of H- and J-type characteristics, i.e. the Coulomb coupling is positive or negative, respectively. In order to identify possible geometries of the full dimer system, i.e. including all side groups, simulated annealing molecular dynamics has been performed on the basis of the DFTB method and including an empirical dispersion correction.45 Here, a trajectory was equilibrated at 400 K and subsequently cooled down exponentially to 100 K within 1 ps. This was followed by a 1 ps run at 100 K. The temperature was controlled by a Berendsen thermostat. Based on the final structure, additional TBFE calculations were performed, including the perylene core only, to confirm the type of coupling.
3 Experimental methods
PBI1 was synthesised as described in ref. 23. As solvent methylcyclohexane (MCH) of Uvasol quality (VWR international) was used. The concentration of PBI1 in the solution was determined by means of the extinction coefficient of 28![[thin space (1/6-em)]](https://www.rsc.org/images/entities/char_2009.gif) 000 M−1 cm−1 at 18
000 M−1 cm−1 at 18![[thin space (1/6-em)]](https://www.rsc.org/images/entities/char_2009.gif) 350 cm−1 where a kind of isosbestic point exists and aggregation leads to no significant changes in the absorption (see Fig. 3(a)). The solution was investigated in a 0.3 mm thick quartz cuvette (110-QS, Hellma) and the degree of aggregation was changed by tuning the temperature between 90 °C and room temperature. To this end the cell was placed in a matching copper block which is electrically heated and which has two holes for the entering and exiting light beams. Two thermo-elements are used to measure the temperature and to provide a feedback signal for the temperature control unit. The temperature was determined with an accuracy of 2.5 °C. Absorption spectra were recorded with a UV-vis spectrometer (Specord 50, Analytic Jena) relative to a 0.3 mm thick cuvette containing the pure solvent. Fluorescence spectra were measured simultaneously to the absorption ones to guarantee that both result from the same aggregation state. For this purpose the sample was excited with a diode laser at 18
350 cm−1 where a kind of isosbestic point exists and aggregation leads to no significant changes in the absorption (see Fig. 3(a)). The solution was investigated in a 0.3 mm thick quartz cuvette (110-QS, Hellma) and the degree of aggregation was changed by tuning the temperature between 90 °C and room temperature. To this end the cell was placed in a matching copper block which is electrically heated and which has two holes for the entering and exiting light beams. Two thermo-elements are used to measure the temperature and to provide a feedback signal for the temperature control unit. The temperature was determined with an accuracy of 2.5 °C. Absorption spectra were recorded with a UV-vis spectrometer (Specord 50, Analytic Jena) relative to a 0.3 mm thick cuvette containing the pure solvent. Fluorescence spectra were measured simultaneously to the absorption ones to guarantee that both result from the same aggregation state. For this purpose the sample was excited with a diode laser at 18![[thin space (1/6-em)]](https://www.rsc.org/images/entities/char_2009.gif) 797 cm−1 and the resulting fluorescence was imaged onto the fibre input of an array spectrometer. To ensure that the dye was completely dissolved the experimental runs were started at high temperatures. The temperature was subsequently decreased and absorption and fluorescence measurements were performed for each temperature step. After each cooling step, at least 10 minutes have been allowed for thermal equilibration.
797 cm−1 and the resulting fluorescence was imaged onto the fibre input of an array spectrometer. To ensure that the dye was completely dissolved the experimental runs were started at high temperatures. The temperature was subsequently decreased and absorption and fluorescence measurements were performed for each temperature step. After each cooling step, at least 10 minutes have been allowed for thermal equilibration.
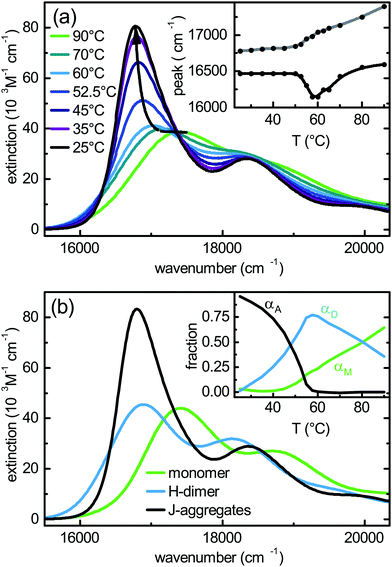 | ||
| Fig. 3 (a) Temperature-dependent absorption spectra of a 0.13 mM PBI1 solution in MCH for the temperature range from 25 °C to 90 °C. (The line through the maxima is shown to guide the eye.) The inset shows the positions of the absorption (grey) and emission (black) maxima. (b) Extinction of monomer, H-dimer and J-aggregates extracted from the aggregation model (from ref. 17). The inset shows the calculated fraction of each species at a given temperature for a dye concentration of 0.13 mM. | ||
4 Experimental results
In the following we describe the particular signatures of the temperature-dependent absorption and emission spectra. By means of a quantitative aggregation model three different contributing species can be identified during the self-assembly process. The optical spectra of each of the species are extracted from the experimental data using a fitting algorithm. These spectra are subsequently compared to the theoretical spectra obtained for the dimer model. (For more details see ref. 17.)4.1 Temperature-dependent absorption and fluorescence spectra
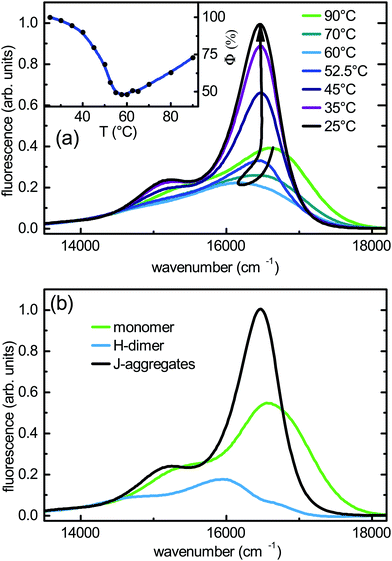
Fig. 3(a) shows the temperature-dependent absorption spectra for PBI1 in MCH at a concentration of 0.13 mM. At high temperatures (90 °C) the absorption spectrum almost matches the monomer absorption. The pure monomer spectrum can be obtained at lower concentrations see ref. 17. With decreasing temperature the size of the aggregates increases monotonically. In the absorption spectra, first a red shift till 60 °C and then a pronounced intensity rise for the low energy band are observed. At room temperature (25 °C) the low energy band is narrower and more red shifted compared to the monomer band. This is a strong indication for the appearance of J-type aggregates in which motional narrowing reduces the bandwidth.46The fluorescence spectra show a more complex variation with temperature compared to the absorption, see Fig. 4(a). Decreasing the temperature from 90 °C to 60 °C causes a pronounced red shift of the fluorescence and the apparent quantum yield reduces by a factor of 1.5, see inset in Fig. 4(a). A further decrease of the temperature results in a turnaround of the spectral behaviour. The fluorescence shifts back to the blue and the quantum yield doubles compared to the minimum. The behaviour of the spectra is different from what one would expect in case of a direct transition from monomers to aggregates. In this case, a temperature change should cause a monotonic shift of the spectra and a monotonic change of the apparent quantum yield due to the varying fractions of two different species. However, we see a distinct minimum of the apparent quantum yield associated with a red shift of the fluorescence at intermediate temperatures. Such a behaviour has also been observed at lower PBI1 concentrations, where the red-shifted fluorescence occurs at a lower temperature.17
Altogether these results show, that the growth of the aggregates is biphasic, meaning that during the assembly process two different aggregated species have an energetically stable geometry. This difference in the intermolecular arrangement is associated with a variation of the excitonic properties, which causes the changes observed in the fluorescence spectra.
4.2 Aggregation model
Since the aggregation constants change with temperature, a direct calculation of the fraction of each of the species, i.e. monomer, H-dimer, and J-aggregates based on the temperature-dependent measurements is challenging. Therefore, these fractions are determined by reconstructing the temperature-dependent absorption spectra. The absorption spectra of the three species are obtained from previous concentration-dependent studies and are given in Fig. 3(b) (cf.ref. 17). The proportions of monomers αM, dimers αD and aggregates αA are obtained as a function of temperature T for a total dye concentration of 0.13 mM by fitting the following equation to the absorption measurements shown in Fig. 3(a):| ε0.13mM(λ,T) = αM(T)·εM(λ) + αD(T)·εD(λ) + αA(T)·εA(λ). | (15) |
Next, the fluorescence spectrum of each of the different species is extracted from the total fluorescence measured at different temperatures. Using the temperature-dependent fractions obtained from the absorption, the fluorescence spectra of the distinct species are determined by a fitting algorithm which minimises the quadratic error between the measured luminescence spectra and the sum of the fluorescence contributions of the PBI1 species. The fluorescence spectra extracted in this way are shown in Fig. 4(b). The fluorescence spectrum of the aggregates shows typical J-type characteristics like a narrow and strong 0–0 type band and a small Stokes shift. The J-type spectrum dominates at low temperatures. The fluorescence spectrum of the H-type dimer dominating at intermediate temperatures is red-shifted and weaker compared to the J-type aggregates. It exhibits a broad shape with a comparatively strong 0–1 type band at 18![[thin space (1/6-em)]](https://www.rsc.org/images/entities/char_2009.gif) 150 cm−1 in agreement with the notion of an H-type configuration. The reconstruction scheme used for the fluorescence spectra allows for small variations (±5%) in the spectral region, where all species emit. Nevertheless, the general shape and the emission strength of the species are stable results.
150 cm−1 in agreement with the notion of an H-type configuration. The reconstruction scheme used for the fluorescence spectra allows for small variations (±5%) in the spectral region, where all species emit. Nevertheless, the general shape and the emission strength of the species are stable results.
5 Simulation results
5.1 Intermolecular interactions
From the comparison of experimental and theoretical monomer absorption and emission spectra, a model including two effective vibronic modes has been established in Section 2.2. To complete the dimer model of Section 2.1 the Coulomb coupling, J = J12, needs to be determined. Its value will strongly depend on the actual configuration, adapted by the two monomers within the dimer. According to the experimental analysis given in the previous section, there should be different types of dimers, i.e. being of H- or J-like character. This gives the motivation for a systematic exploration of the total energy and the Coulomb coupling strength as a function of the dimer configuration. The starting configuration of the dimer for the reduced monomer model has been obtained as described in Section 2.2. In the following the coordinate system (x, y, z) refers to the principal axes shown in Fig. 2(b). The x and y directions are denoted as “in-plane” and the z direction as “perpendicular”.In Fig. 5 different cuts of the intermolecular ground state potential energy surface (total ground state energy) are shown. From panels (a) to (c) of Fig. 5 we can identify an area of ±1 Å in the in-plane directions as well as a tilt of about 20° around the minimum configuration, where the ground state energy does not increase considerably. Further, the potential energy for the in-plane directions depends strongly on the intermolecular distance, compare Fig. 5(a) and (b). However, it should be emphasised that the intramolecular geometry has been frozen. This causes, for instance, the four narrow regions of high energy in Fig. 5(a), which are due to a close approach of the oxygen atoms in the bay positions. Rotating one of the monomers w.r.t. the other around the z axis by an angle ϕ also leads to small distances between the oxygen atoms and correspondingly high energies. Apart from these regions the two monomers can translate almost freely with respect to each other in the depicted coordinate intervals.
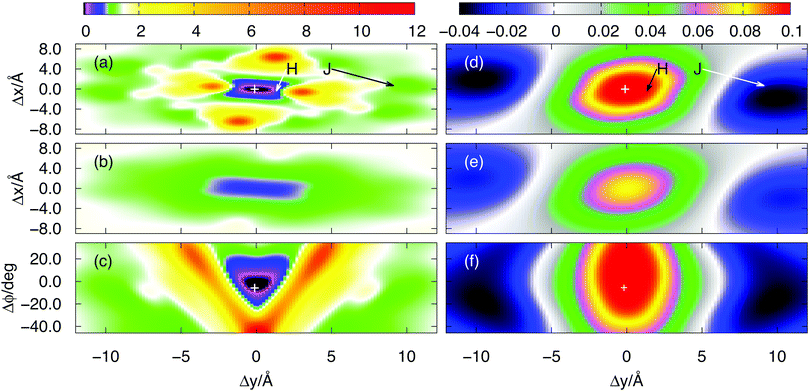 | ||
| Fig. 5 DFTB ground state energy (colour scale in eV) as a function of translations in x- and y-direction at (a) equilibrium distance for z; (b) z increased by 1 Å w.r.t. the equilibrium distance. (c) As a function of translation in y-direction and rotation angle ϕ (equilibrium distance for z). The ground state equilibrium geometry (cross) is set to the origin (definition of axes, see Fig. 2). All offsets of one monomer as compared to the original configuration are measured with respect to these axes. Panels (d–f) show the Coulomb coupling (colour scale in eV) as obtained using the TBFE approach, eqn (14), for the same configurations. The arrows indicate the configurations of the full dimer in the plane of the graph. | ||
In Fig. 5(d–f) we show the respective Coulomb couplings between the S0–S1 transitions as obtained from the TBFE approach, eqn (14). Within the range of feasible configurations in the vicinity of the global energy minimum (as described above) the coupling is always positive and varies between 0.08 and 0.1 eV. Negative values for the Coulomb coupling are found for large in-plane displacements along the long (y) axis of the monomer.
In order to relate these findings to the structure of the full dimer (including the dodecyloxy and the tert-butyl groups), the latter has been optimised using simulated annealing. The structure obtained when starting from a π–π stacked initial geometry is shown in Fig. 6(a). It reveals a structure where the tert-butylphenoxy bay substituents are interlocked and moved out of the plane of the perylene core. The substituents shield the PBI1 core such that a π–π stacking with an additional partner is hindered. Consequently, the aggregate size is limited to the dimer species for this geometry. The coupling strength is positive and (using the reduced model and the TBFE approach) amounts to 0.091 eV (734 cm−1), underlining the experimental findings, that the dimer is of H-type.
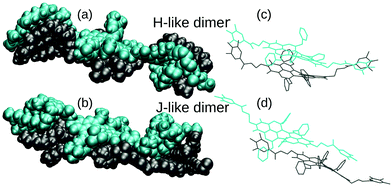 | ||
| Fig. 6 Geometries for the full dimer in gas phase obtained by using simulated annealing molecular dynamics starting from a π-stacked and a shifted structure, which yielded the H-like ((a) and (c)) and the J-like dimer ((b) and (d)), respectively. The colour has been chosen to distinguish the two monomers. Panels (c) and (d) show the structures without alkyl and tert-butyl side groups for better visibility of the stacking configuration. The figure is generated using VMD.44 | ||
In ref. 17 it was argued that J-type aggregates can be formed from a different dimer structure. In order to identify such a dimer configuration, simulated annealing has been performed starting from a stack-slipped geometry. This leads to the structure shown in Fig. 6(b). Most notable is the fact that in the stack-slipped geometry the phenoxy groups of the monomers are situated such that their interaction is reduced. As a result they don't move that much out of the plane of the perylene core thus making the dimer overall more planar. Notice that in terms of Fig. 5 the obtained geometry corresponds to a displacement of about 9 Å in y and −0.7 Å in x direction. In addition there is a tilt of 44° with respect to the axis (−0.6, 0.2, 0.7), i.e. the geometry is not covered by Fig. 5. The coupling strength for this geometry is −0.030 eV (−242 cm−1). Thus this stack-slipped configuration of the tert-butyl groups is of J-type and may allow a further attachment of monomers such as to form longer aggregates, in contrast to the above H-dimer configuration.
At this point we should emphasise that the actual values for J obtained after simulated annealing have to be taken with caution. This holds in particular since according to Fig. 5, small changes in geometry can result in considerable variations of J. For the present setup the following sources of errors could be of relevance: First, we did not include the solvent, which could influence the geometry and also via screening affect the Coulomb interaction itself. Second, for large in-plane shifts along the long axis (y direction), as it is the case in the J-dimer configuration, the dodecyloxy groups are situated on top of the perylene core. This could have an influence on the Mulliken transition charges, which is not included in the present model. Third, TD-DFTB is, of course, only an approximate method (for a comparison with TD-DFT, see ref. 33 and 49). In view of these points, the coupling strengths for the different structures will be refined below by fitting to experimental absorption and emission spectra. However, this will confirm the present finding, i.e. there are two dimer species whose Coulomb couplings differ in sign and thus yield H- and J-type spectral signatures.
5.2 Energy level structure and spectra
In the following we provide a discussion of the experimental absorption and emission spectra in terms of the exciton-vibronic dimer model of Section 2.1. Eventually, this will give refined values for the Coulomb coupling strength. In order to understand the Coulomb coupling-dependent spectra of the PBI1 dimer we will analyse some general aspects of the eigenvalues, absorption and emission spectra of the two-mode model. For the understanding of the distribution of oscillator strength, the electronic character of the transitions will be of importance (for a detailed discussion, see ref. 30). It is obtained by projecting the exciton-vibrational eigenfunctions onto the states |m, 0, 0〉.A scan of the J-dependence of absorption and emission using the HR parameters optimized for the monomer (cf.Table 1) is shown in Fig. 7, panel (c) and (d), respectively. Notice that for reasons of transferability of the results, energies are given in units of the high-frequency vibrational mode ωh in the following. For both ground and excited electronic states five vibrational states are included into the basis set.
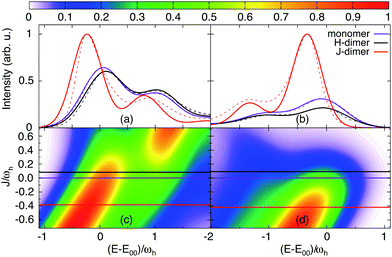 | ||
| Fig. 7 Absorption (a) and emission (b) spectrum of the different PBI1 species: monomer, H-dimer and J-dimer, comparison of the calculated spectra (solid lines) and the experimentally determined species spectra (dashed line, absorption see ref. 17 and emission see Fig. 4, maxima shifted to the calculated spectra); the lower panels show the J-dependence of the spectrum ((c) absorption and (d) emission), the horizontal lines present the fit result for J (note that the actual values are the same for absorption and emission but ωh is different). | ||
First, we consider the absorption spectrum in Fig. 7(c). The monomer spectrum (J = 0) shows two features, which are referred to as 0–0 for the strongest absorption at E1/2 = E00 and as 0–1 vibronic-type side band, which is at the high-energy side of the 0–0-type transition. For negative Coulomb couplings J, both peaks shift to lower energies. This double-peak shape of the spectrum extends to small positive values of J, thus leading to an asymmetry with respect to J = 0. Starting from J ≈ −0.2ωh the vibronic side band gains intensity until it dominates the spectrum for J > 0.2ωh.
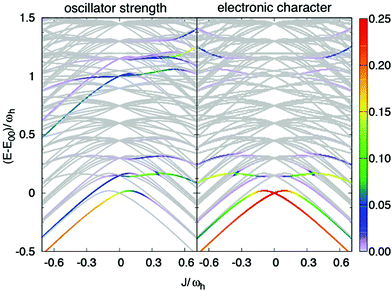
In Fig. 8 the dependence of the energy levels (exciton-vibrational eigenstates) on the Coulomb coupling strength is shown. The colour code has been chosen according to the respective transition strength from the lowest vibrational state of the electronic ground state. The panel on the right hand side shows the electronic character of the states. For negative J one has a J-type dimer, i.e. the strongest transition will be to the lowest level, which is dominantly of electronic character. The behaviour in case of positive J is more interesting. Let us first consider the 0–0 type transition, which starts out with high electronic character at J = 0. Specifically, we would like to draw attention to the avoided crossing around J/ωh ≈ 0.15. If the coupling is smaller most of the oscillator strength is carried by a transition to a state with dominantly electronic character, i.e. the peak in the spectrum is indeed of rather pure 0–0 type. For larger couplings the dominant transition is to a state having mixed electron-vibrational character. Next, we discuss the switch in peak ratio between 0–0 and 0–1 peaks. It is caused by an increasing transition strength into the higher energetic states, which carry electronic character. Hence, as a consequence of the Coulomb coupling the assignment as a 0–1 band should be taken with caution.
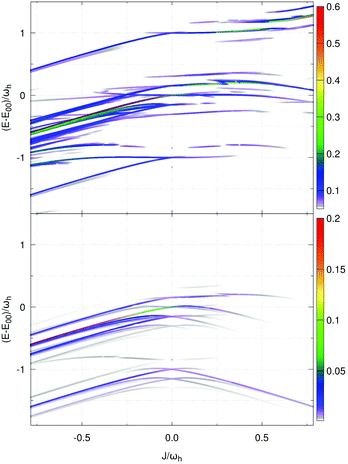
Second, we focus on the emission spectrum in Fig. 7(d). For negative J the general dependence of the shape on the Coulomb coupling is rather similar to the absorption spectrum. In contrast to the latter, the vibronic-type side band is located at the low-energy part of the main peak. For positive J the intensity of the spectrum tends to zero, which is a well-known property of the H-dimer. The behaviour of this spectrum can be rationalised in terms of the transition energy level diagram shown in the upper panel of Fig. 9. Here, transitions from all one-exciton vibrational states to all zero-exciton-vibrational states in the given energy range are included. This results in an essentially dense spectrum, although most of the transitions have a rather small oscillator strength. Apparently, this does not explain the behaviour especially for positive J seen in Fig. 7(d). Therefore, in the lower panel of Fig. 9 each transition is weighted with the Boltzmann population of the initial one-exciton-vibrational state according to eqn (13). Clearly, this results in the observed decrease of intensity for increasing positive values of J. In other words, for the present exciton-vibrational model it is not the oscillator strength as such, which yields vanishing emission for the H-dimer, but the negligible thermal population of those exciton-vibrational states that carry oscillator strength.
Having at hand the emission and absorption spectra for a broad range of values for the Coulomb couplings, we are now able to search for the coupling strength, which yields a match between calculated and experimental spectra. For this purpose again a genetic algorithm was used together with the constraint that the monomeric HR parameters do not change, but the broadenings are flexible. The resulting spectra are compared with the experimental data in Fig. 7(a) and (b). The optimal J values are indicated by horizontal lines in Fig. 7(c) and (d). For the H-dimer both the splitting between the 0–0 transition and the 0–1 side peaks as well as their intensity ratios are well reproduced. The optimal coupling for absorption and emission was determined to be 116 cm−1. There was no need to adjust the broadening of the monomer which is Γ = 528 cm−1 for emission and 555 cm−1 for absorption. Comparing the J- and H-type models we notice that for absorption the less intense peak is in both cases on the higher energetic side of the main peak. Commonly, one would expect the opposite to be the case for the H-dimer.
For the J-dimer the given agreement of the spectra can only be achieved by adjusting the broadening parameter. The coupling constant is found to be −534 cm−1, i.e. in close agreement with the value of −514 cm−1 previously reported in ref. 36. The broadening parameter for absorption and emission is Γ = 401 cm−1 and 332 cm−1, respectively. The different broadening compared to the monomer and the weakly coupled H-dimer cases could be explained by a delocalisation of the exciton states due to the rather large coupling strength. In fact, using the well-known relation that in aggregates the line width is reduced by a factor  , where Ndeloc is the delocalisation length,
  points to a delocalisation over both monomers.46 However, even with the adjustment of the broadening parameters the agreement between theory and experiment is not as good as for the H-dimer case. This could be due to the fact that in the actual experiment aggregates involving more than two monomers are likely to be present, even though the optical properties might be still reasonably described using a dimer model (for a study of the dependence of the absorption spectrum on the aggregate's length, see ref. 36).
Finally, we notice that the coupling parameters obtained by fitting the experimental spectra are in qualitative agreement with those of the TBFE calculations, i.e. H- and J-type behaviour is confirmed. Potential errors have been discussed above. In addition we note that the coupling strength for J-type aggregates has been estimated based on kinetic data to be of the order −120 cm−1,5,50 which also points to the problem of fitting simple models to experimental data.
6 Conclusions
Optical spectroscopy is the primary tool to identify aggregation of dye molecules and to unravel mechanistic details of electronic processes in the formed aggregates. In this contribution we have studied biphasic aggregation behaviour for a perylene bisimide dye. By decomposition of the temperature-dependent experimental spectra into three contributing species, two types of aggregates are identified. Possible structures are obtained by simulated annealing calculations. In the H-dimer the space-demanding tert-butylphenoxy groups at the bay positions are found to be oriented away from the contact plane. This prevents a close approach of a third molecule to the free sides of the perylene bisimide chromophores in the dimer, thus inhibiting further aggregation. In the J-type configuration, where the perylene cores and thus the contact area are shifted in-plane with respect to each other, the binding energy is smaller compared to stacked H-type structure. The tert-butylphenoxy groups of both molecules are displaced from each other and can stay near the contact plane. In this case the association of further molecules is possible and long aggregates with J-type character are formed at sufficiently high concentrations.Given the typical electronic absorption of the dyes, which features a Franck–Condon progression, the proper inclusion of exciton-vibrational interaction is crucial for the correct interpretation of experimental spectra. This has been demonstrated using a two-mode exciton-vibronic dimer model. The parameter of this model have been obtained by combining TD-DFT calculations with fitting of experimental absorption and emission spectra. Interestingly, the absorption spectrum of the H-dimer resembles that of a J-dimer, i.e. the vibronic progression is at the high energy side of the electronic 0–0 transition. This feature finds an explanation in terms of the exciton-vibrational eigenstates of the dimer.
In summary, the present investigation lends further support to the previously suggested biphasic aggregation model for the PBI1 dye. In addition it establishes a model Hamiltonian suitable for studying exciton-vibrational dynamics in larger aggregates.
Acknowledgements
We gratefully acknowledge financial support by the Deutsche Forschungsgemeinschaft through the SFB 652, the project IV 171/2-1 (S. D. I.) and the research group FOR 1809 (F. W.). This work was partly (S. P.) performed within the state contract of the RF Ministry of Education and Science for Siberian Federal University for scientific research in 2014–2016 (Reference number 1792). T. N. would like to thank the Laboratoire d'Excellence iMUST for financial support.References
- G. D. Scholes and G. Rumbles, Nat. Mater., 2006, 5, 683–696 CrossRef CAS PubMed.
- F. Würthner, T. E. Kaiser and C. R. Saha-Möller, Angew. Chem., Int. Ed., 2011, 50, 3376–3410 CrossRef PubMed.
- O. Kühn and S. Lochbrunner, Semicond. Semimetals, 2011, 85, 47–81 Search PubMed.
- F. Würthner, C. R. Saha-Möller, B. Fimmel, S. Ogi, P. Leowanawat and D. Schmidt, Chem. Rev., 2016, 116, 962–1052 CrossRef PubMed.
- H. Marciniak, X.-Q. Li, F. Würthner and S. Lochbrunner, J. Phys. Chem. A, 2010, 115, 648–654 CrossRef PubMed.
- H. Lin, R. Camacho, Y. Tian, T. E. Kaiser, F. Würthner and I. G. Scheblykin, Nano Lett., 2010, 10, 620–626 CrossRef CAS PubMed.
- A. Schubert, V. Settels, W. Liu, F. Würthner, C. Meier, R. F. Fink, S. Schindlbeck, S. Lochbrunner, B. Engels and V. Engel, J. Phys. Chem. Lett., 2013, 4, 792–796 CrossRef CAS PubMed.
- J. Sung, P. Kim, B. Fimmel, F. Würthner and D. Kim, Nat. Commun., 2015, 6, 9646 Search PubMed.
- R. Singh, E. Giussani, M. M. Mroz, F. Di Fonzo, D. Fazzi, J. Cabanillas-Gonzalez, L. Oldridge, N. Vaenas, A. G. Kontos, P. Falaras, A. C. Grimsdale, J. Jacob, K. Muellen and P. E. Keivanidis, Org. Electron., 2014, 15, 1347–1361 CrossRef CAS.
- C. Rest, R. Kandanelli and G. Fernandez, Chem. Soc. Rev., 2015, 44, 2543–2572 RSC.
- S. Ghosh, X.-Q. Li, V. Stepanenko and F. Würthner, Chem. – Eur. J., 2008, 14, 11343–11357 CrossRef CAS PubMed.
- R. Marty, R. Nigon, D. Leite and H. Frauenrath, J. Am. Chem. Soc., 2014, 136, 3919–3927 CrossRef CAS PubMed.
- M. Shirakawa, S. Kawano, N. Fujita, K. Sada and S. Shinkai, J. Org. Chem., 2003, 68, 5037–5044 CrossRef CAS PubMed.
- Y. Egawa, R. Hayashida and J.-I. Anzai, Langmuir, 2007, 23, 13146–13150 CrossRef CAS PubMed.
- N. Maiti, S. Mazumdar and N. Periasamy, J. Phys. Chem. B, 1998, 102, 1528–1538 CrossRef CAS.
- V. Karunakaran, D. D. Prabhu and S. Das, J. Phys. Chem. C, 2013, 117, 9404–9415 CAS.
- F. Fennel, S. Wolter, Z. Xie, P.-A. Plötz, O. Kühn, F. Würthner and S. Lochbrunner, J. Am. Chem. Soc., 2013, 135, 18722–18725 CrossRef CAS PubMed.
- E. A. Mills, M. H. Regan, V. Stanic and P. J. Collings, J. Phys. Chem. B, 2012, 116, 13506–13515 CrossRef CAS PubMed.
- H. Yamagata, D. S. Maxwell, J. Fan, K. R. Kittilstved, A. L. Briseno, M. D. Barnes and F. C. Spano, J. Phys. Chem. C, 2014, 118, 28842–28854 CAS.
- D. van der Zwaag, P. A. Pieters, P. A. Korevaar, A. J. Markvoort, A. J. H. Spiering, T. F. A. de Greef and E. W. Meijer, J. Am. Chem. Soc., 2015, 137, 12677–12688 CrossRef CAS PubMed.
- S. Ogi, K. Sugiyasu, S. Manna, S. Samitsu and M. Takeuchi, Nat. Chem., 2014, 6, 188–195 CrossRef CAS PubMed.
- F. Würthner, Nat. Chem., 2014, 6, 171–173 CrossRef PubMed.
- X.-Q. Li, X. Zhang, S. Ghosh and F. Würthner, Chem. – Eur. J., 2008, 14, 8074–8078 CrossRef CAS PubMed.
- E. McRae, Aust. J. Chem., 1961, 14, 344–353 CAS.
- O. Kühn, T. Renger and V. May, Chem. Phys., 1996, 204, 99–114 CrossRef.
- A. Eisfeld, L. Braun, W. Strunz, J. Briggs, J. Beck and V. Engel, J. Chem. Phys., 2005, 122, 134103 CrossRef CAS PubMed.
- S. Polyutov, O. Kühn and T. Pullerits, Chem. Phys., 2012, 394, 21–28 CrossRef CAS.
- V. Butkus, D. Zigmantas, L. Valkunas and D. Abramavicius, Chem. Phys. Lett., 2012, 545, 40–43 CrossRef CAS.
- F. C. Spano, Acc. Chem. Res., 2010, 43, 429–439 CrossRef CAS PubMed.
- M. Schröter, S. D. Ivanov, J. Schulze, S. P. Polyutov, Y. Yan, T. Pullerits and O. Kühn, Phys. Rep., 2015, 567, 1–78 CrossRef.
- M. Elstner, D. Porezag, G. Jungnickel, J. Elsner, M. Haugk, T. Frauenheim, S. Suhai and G. Seifert, Phys. Rev. B: Condens. Matter Mater. Phys., 1998, 58, 7260–7268 CrossRef CAS.
- T. A. Niehaus, S. Suhai, F. Della Sala, P. Lugli, M. Elstner, G. Seifert and T. Frauenheim, Phys. Rev. B: Condens. Matter Mater. Phys., 2001, 63, 085108 CrossRef.
- P.-A. Plötz, T. Niehaus and O. Kühn, J. Chem. Phys., 2014, 140, 174101 CrossRef PubMed.
- P. Jonkheijm, P. van der Schoot, A. P. H. J. Schenning and E. W. Meijer, Science, 2006, 313, 80–83 CrossRef CAS PubMed.
- V. May and O. Kühn, Charge and Energy Transfer Dynamics in Molecular Systems, Wiley-VCH, Weinheim, 3rd revised and enlarged edition, 2011 Search PubMed.
- D. Ambrosek, A. Köhn, J. Schulze and O. Kühn, J. Phys. Chem. A, 2012, 116, 11451–11458 CrossRef CAS PubMed.
- D. Ambrosek, H. Marciniak, S. Lochbrunner, J. Tatchen, X.-Q. Li, F. Würthner and O. Kühn, Phys. Chem. Chem. Phys., 2011, 13, 17649–17657 RSC.
- V. Percec, M. Peterca, T. Tadjiev, X. Zeng, G. Ungar, P. Leowanawat, E. Aqad, M. R. Imam, B. M. Rosen, U. Akbey, R. Graf, S. Sekharan, D. Sebastiani, H. W. Spiess, P. A. Heiney and S. D. Hudson, J. Am. Chem. Soc., 2011, 133, 12197–12219 CrossRef CAS PubMed.
- J. K. Gallaher, E. J. Aitken, R. A. Keyzers and J. M. Hodgkiss, Chem. Commun., 2012, 48, 7961–7963 RSC.
- B. Aradi, B. Hourahine and T. Frauenheim, J. Phys. Chem. A, 2007, 111, 5678–5684 CrossRef CAS PubMed.
- M. Elstner, P. Hobza, T. Frauenheim, S. Suhai and E. Kaxiras, J. Chem. Phys., 2001, 114, 5149–5155 CrossRef CAS.
- M. E. Casida, F. Gutierrez, J. Guan, F.-X. Gadea, D. Salahub and J.-P. Daudey, J. Chem. Phys., 2000, 113, 7062–7071 CrossRef CAS.
- W. Liu, V. Settels, P. H. P. Harbach, A. Dreuw, R. F. Fink and B. Engels, J. Comput. Chem., 2011, 32, 1971–1981 CrossRef CAS PubMed.
- W. Humphrey, A. Dalke and K. Schulten, J. Mol. Graphics, 1996, 14, 33–38 CrossRef CAS PubMed.
- A. K. Rappe, C. J. Casewit, K. S. Colwell, W. A. Goddard and W. M. Skiff, J. Am. Chem. Soc., 1992, 114, 10024–10035 CrossRef CAS.
- E. E. Knapp, Chem. Phys., 1984, 85, 73–82 CrossRef CAS.
- T. E. Kaiser, I. G. Scheblykin, D. Thomsson and F. Würthner, J. Phys. Chem. B, 2009, 113, 15836–15842 CrossRef CAS PubMed.
- G. Seybold and G. Wagenblast, Dyes Pigm., 1989, 11, 303–317 CrossRef.
- A. Domnguez, B. Aradi, T. Frauenheim, V. Lutsker and T. A. Niehaus, J. Chem. Theory Comput., 2013, 9, 4901–4914 CrossRef PubMed.
- S. Wolter, J. Aizezers, F. Fennel, M. Seidel, F. Würthner, O. Kühn and S. Lochbrunner, New J. Phys., 2012, 14, 105027 CrossRef.
| This journal is © the Owner Societies 2016 |

