 Open Access Article
Mechanism of the potential-triggered surface transformation of germanium in acidic medium studied by ATR-IR spectroscopy
Simantini
Nayak†
 a and
Andreas
Erbe
*ab
aMax-Planck-Institut für Eisenforschung GmbH, Max-Planck-Str. 1, 40237, Düsseldorf, Germany. E-mail: a.erbe@mpie.de, aerbe@arcor.de; Fax: +49 211 6792 218; Tel: +49 211 6792 890
bDepartment of Materials Science and Engineering, NTNU, Norwegian University of Science and Technology, 7491 Trondheim, Norway
First published on 16th August 2016
Abstract
In acidic solution, germanium surfaces undergo a transformation to hydrogen-terminated surfaces at sufficiently negative electrode potentials. Herein, we used in situ and operando attenuated total reflection infrared (ATR-IR) spectroscopy coupled to electrochemical experiments to study the details of this surface transformation on Ge(111) and Ge(100) in 0.1 M HClO4. The ATR-IR data gathered during the surface transformation are consistent with an interpretation according to which an intermediate state exists of a surface with mixed termination. In the mixed termination, both H and OH are bound to the surface, which showed a Ge–H stretching mode at ∼2025–2030 cm−1. At sufficiently negative potentials, the surfaces became fully hydrogen terminated. ATR-IR spectra can be understood by assigning the peak at ∼1977–1990 cm−1 to the stretching mode of GeH1 species on Ge(111), and the peak at ∼2000–2015 cm−1 to a stretching mode of GeH2 species on Ge(100). Measurements of the linear dichroism showed the GeH1 species to be oriented predominantly upright. The transition dipole moment of the GeH2 species was oriented parallel to the surface, as expected for an antisymmetric stretching mode.
1 Introduction
Single element semiconductors, such as silicon and germanium, have been used in a variety of electronic applications. On the other hand, the need for their understanding has contributed significantly to the development of solid state physics. As a result, their band structure, electronic structure and optical properties are well understood. Methods to calculate these and other properties from first principles exist.1–3 Likewise, single element semiconductor surfaces have been widely investigated in ultrahigh vacuum (UHV), leading to detailed knowledge of surface phases.4–6 For surfaces in UHV, experimental results are underpinned by first principles calculations.The consequent next step must be a detailed understanding of electrochemical semiconductor/electrolyte interfaces, for which much fewer experimental techniques exist. For instance, scanning tunneling microscopy (STM) can contribute significantly to understanding.7–9 Other than STM, vibrational spectroscopy can give a significant amount of information on the molecular structure at solid/liquid interfaces.10,11 On silicon as the working horse of solid state physics,12,13 however, often the formation of an amorphous oxide in contact with aqueous solution and the rather negative reduction potential complicate data collection or interpretation for most experimental methods.
On the other hand, germanium surfaces possess an interesting feature: in acidic solution, they undergo a transformation from –OH termination at more positive potentials to –H termination at negative potentials.14–16 The surface transformation on germanium was investigated initially electrochemically.15,16 Later, attenuated total internal reflection infrared (ATR-IR) spectroscopy was used in combination with electrochemistry to study this surface transformation under acidic conditions14,17 for both Ge(111) and Ge(100) surfaces. The formation of GeH and GeH2 was reported during the surface transformation process and both Ge(100) and Ge(111) surfaces were found to be atomically rough due to the formation of (111) microfacets. However, no information regarding the formation of different surface intermediates of Ge during surface transformation was reported. Electrochemical quartz crystal microbalance results also showed a quasi-reversible change between a hydrogenated state of the Ge surface and a hydroxylated state.18 During the surface transformation of germanium, a surface radical was proposed as an intermediate. Surface radicals were also proposed to be formed during H2O2 reduction and hydrogen evolution reaction (HER).14–16 These radicals are also assumed to play an important role during the oxygen reduction reaction (ORR) on germanium, which was observed at potentials negative to the surface transformation in acidic solution.19 On the other hand, in alkaline solution, the ORR is observed at potentials positive from the surface transformation.20
It is known that the surface transformation results in a surface terminated with Ge–H bonds at negative potentials. However, details of the surface reconstruction, and possible intermediates in its formation, are not known. In this work, polarised ATR-IR spectroscopy was used to study the surface transformation on n-doped Ge(100) and Ge(111) in Ar-saturated 0.1 M HClO4.
2 Experimental section
2.1 Materials
0.1 M HClO4 (Sigma-Aldrich) was used as the electrolyte for this study. Ultrapure water was used in the preparation of all the aqueous electrolytes. Double sided polished n-doped Ge(100) and Ge(111) surfaces [resistivity 10–40 Ω cm; root mean square (rms) roughness ≤10 Å; http://Universitywafers.com, Boston, MA, USA] were used as working electrodes and internal reflection elements.2.2 Electrochemical ATR-IR spectroscopy
Standard ATR-IR spectroscopy with polarised light was used,10,11,21,22 in a custom-designed IR cell.19,20 The IR cell was placed on the optical base of a multiple reflection mirror unit (SpectraTech Model 0001-100, SpectraTech, Stamford, CT, USA) inside the sample chamber of a commercial Fourier transform IR spectrometer Biorad FTS3000 (Varian, Palo Alto, CA, USA). IR spectra were recorded using a mercury cadmium telluride (MCT) detector cooled with liquid nitrogen in s- and p-polarisations. The spectral resolution was set to 4 cm−1. The results are displayed as the absorbance at a certain potential, for the calculation of which the single channel spectrum Rsample at that potential was divided by a reference spectrum (Rref), . Spectra were offset against each other in the plots for clarity.
Ar saturated 0.1 M HClO4 solution was purged from a three neck flask into the IR cell with the help of a peristaltic pump (REGLO Digital, Ismatec). Circulation of the solution with the help of the pump created a laminar flow between the liquid inlet and outlet of the cell. The gas volume above the electrolyte in the IR cell was also continuously purged with Ar during IR experiments. A potentiostat/galvanostat Iviumstat XR (Ivium, Eindhoven, The Netherlands) was used to control the electrode potentials. A platinum coil (Goodfellow, Huntingdon, UK) was used as a counter electrode and an Ag/AgCl (3 M KCl) micro reference electrode (Microelectrodes Inc., Bedford, NH, USA) was used as a reference electrode. Before each set of electrochemical IR experiments, cyclic voltammograms (CVs) were recorded from 0.21 V to −0.9 V (10 cycles) to clean the surface and to determine the exact potential window of the surface transformation in the respective experiment. Then, IR spectra were recorded at controlled potential using chronoamperometry mode. The results of electrochemical experiments display the current density j. All electrode potentials E in this work are reported with reference to the standard hydrogen electrode (SHE).
ATR-IR spectra are displayed as difference spectra with respect to a reference measurement at the initial potential, which is 0.21 V unless otherwise noted. Typically, the spectra were collected at 100 mV potential intervals, if not specified otherwise. A potential window from 0.21 V to −0.79 V was chosen for the electrochemical measurements. At each potential, 10 IR spectra were collected, each spectrum after co-adding 100 scans to study the evolution of the spectra at one potential. These 10 spectra at a constant potential were co-added to get one average IR spectrum at that potential.
For peak fitting at different potentials, the spectral range between 2100–1900 cm−1 was selected and baseline corrected. Two points were put at the beginning and at the end of the peak to define the baseline without doing any modification in the region with a peak. The peaks observed in the range of interest during the surface transformation were fitted using OriginLab Origin software by a sum of Gaussian functions. Different starting parameters were tried for the peak positions, within a reasonable interval. Results were accepted only if they were independent of the starting peak positions. No parameter was fixed during Gaussian deconvolution of different peaks.
ATR-IR experiments with both p- and s-polarisations were used. From the dichroic ratio D = Ap/As, the orientation of the transition dipole moments (TDMs) of different species with respect to the surface normal was estimated.10,11,21,23,24 Here, Ap denotes integrated absorbance with p-polarisation, and As denotes integrated absorbance with s-polarisation. The orientational order parameter N2 was determined from the experimental D using  . All calculations have been performed in the thin film approximation.23 For the calculation of the I0i (squared amplitudes of the electric field components at the interface), the refractive index of the thin absorbing film was assumed to be equal to that of the medium water.25N2 is related to the angle θ between the TDM and surface normal as
  .21
.21
In polarised ATR-IR spectroscopy, the surface concentration of the adsorbed species is not directly proportional to the integrated absorbances (As and Ap), due to the effect of orientation, and different from transmission spectroscopy. This problem can be solved by analysing both As and Ap, which were used to determine the surface concentration of adsorbed lipid bilayers.26 Because in this work the required absorption coefficient of the Ge–H modes cannot easily be obtained, an equivalent isotropic absorbance Aiso was calculated as  .19Aiso is proportional to the surface concentration only and independent of orientation.
2.3 Post-mortem surface analysis
The surface morphologies of the Ge surfaces before and after the electrochemical experiments were studied by atomic force microscopy (AFM; Dimension 3100, Model D3100S-1). For the analysis of the AFM images of this work, the WSxM software was used.273 Results
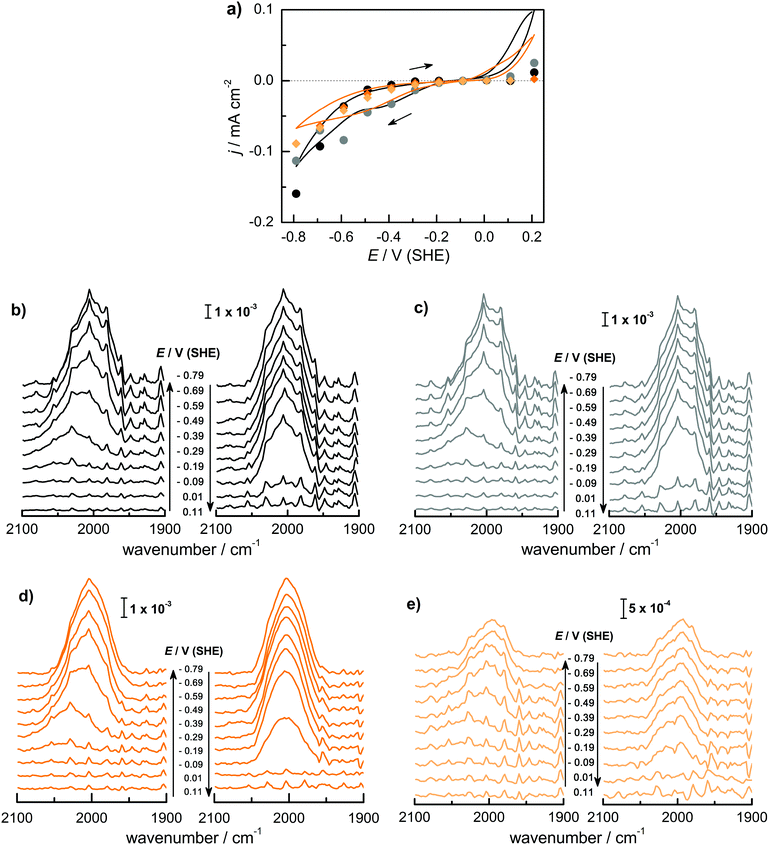
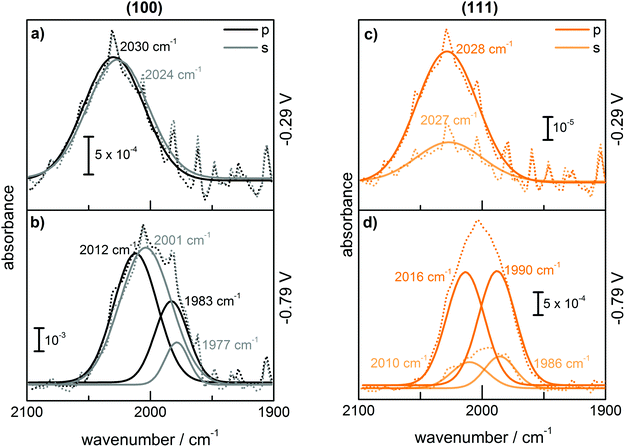
Fig. 1 shows (a) the CVs before the experiment and average current densities at constant potentials recorded during ATR-IR experiment on Ge(100) and Ge(111) surfaces and (b–e) a series of ATR-IR spectra of Ge(100) and Ge(111) surfaces in p- and s-polarisations in the range of 2100 to 1900 cm−1. At −0.29 V, the first IR peak was observed at 2030 cm−1. With increasingly negative potentials, the absorbance increased and the peak shifted to lower wavenumbers by ∼25 cm−1. (The residual features of uncompensated water vapour are also visible in the spectra. As these features are sharp, they can be easily recognised.) When moving towards positive potentials, no corresponding peak shift was observed, though the absorbance of the peaks decreased at −0.09 V compared to −0.79 V. During the onset of the surface transformation, i.e. around −0.29 V, the full width at half maximum (FWHM) of the IR band was 59 cm−1 on Ge(100) and 56 cm−1 on Ge(111). At more negative potentials, e.g. around −0.79 V (Fig. 2), the FWHM with both p- and s-polarisation was 55 cm−1 for Ge(100), while it was 51 cm−1 with p- and 47 cm−1 with s-polarisation on Ge(111). FWHM values show that the IR bands on Ge(100) were slightly broader compared to Ge(111), but the difference may not be significant. For Ge(100) surfaces, p- and s-polarised spectra were observed with similar absorbances, whereas for Ge(111), p-polarised spectra showed ∼3 times the absorbance of s-polarised spectra.The observed peaks in p- and s-polarisations are compiled for Ge(100) and Ge(111) surfaces in Fig. 2. During negative potential scans at −0.29 V, one mode was observed centred at ∼2025–2030 cm−1 ( ) in p- and s-polarisations on both Ge(100) and Ge(111) surfaces. From −0.39 V onward and shown for the example of −0.79 V, the peak became asymmetric, and Gaussian fitting was used to deconvolute the peak into different fractions, one centred at ∼2000–2015 cm−1 (
 ) and the second at ∼1977–1990 cm−1 (
 ), in both s- and p-polarisations on both Ge(100) and Ge(111) surfaces. A deeper analysis of the peaks at three characteristic potentials is presented in Table 1. The overall evolution of different components with potential is shown in Fig. 3. There is mostly a larger Aiso (and hence, surface concentration) at lower potentials.
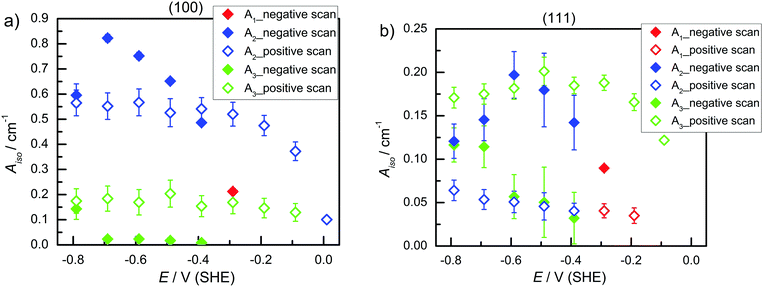 | ||
| Fig. 3 A iso of (a) Ge(100) and (b) Ge(111) in Ar-saturated 0.1 M HClO4 during negative and positive potential scans. | ||
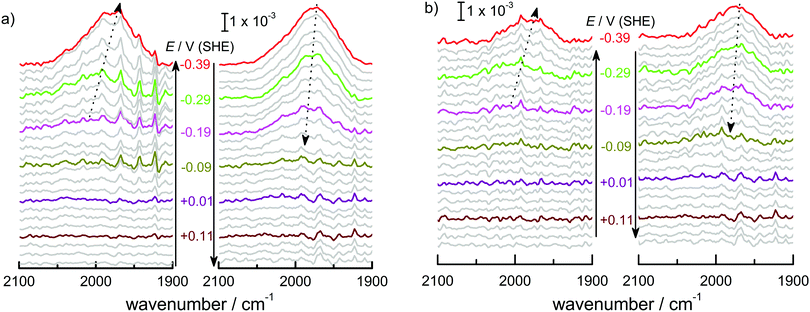
In order to better resolve the peak shift observed around the onset of the surface transformation while moving to more negative potentials, a set of ATR-IR experiments was carried out with 25 mV steps from 0.21 V to −0.39 V. Fig. 4 shows the resulting spectra for Ge(100) and Ge(111) surfaces. Here, at each potential, 5 spectra were averaged for each measurement, consisting of 100 scans each. Fig. 4 shows that an absorption at 2030 cm−1 started to evolve at −0.29 V in a similar manner as shown in Fig. 1 though it is much less prominent compared to Fig. 1. The observed peak shifted to lower wavenumber between −0.29 V and −0.39 V. When moving in the direction of positive potentials, the peak maximum initially at 1970 cm−1 (−0.39 V) shifted to 2000 cm−1 (−0.09 V), a shift that is not visible with the large potential steps used to record the spectra displayed in Fig. 1.
Additional information which aids assignment can be obtained by analysing the linear dichroism of the different bands. The results for TDM estimations are shown in Fig. 5. On Ge(100), the TDM of the peak centred at ∼2000–2015 cm−1 ( ) was oriented parallel to the surface. The TDM of the main peak around ∼1977–1990 cm−1 (
 ) had a slightly lower tilt angle, however, the TDM was almost parallel to the surface and was still above the angle of 54.7°. On Ge(111), the tilt angles were lower, around the angle of 54.7°, and for some samples below, i.e. the TDM is oriented more upright than parallel. No significant potential dependence was observed.
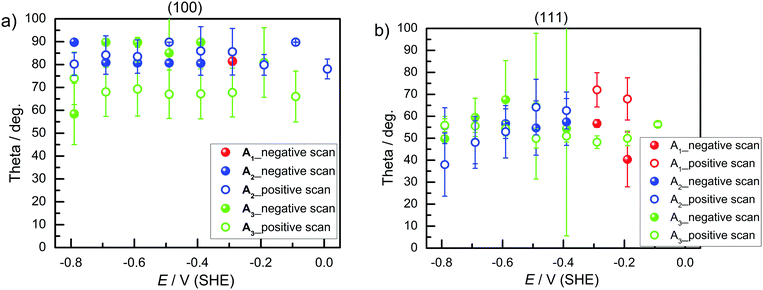 | ||
| Fig. 5 Tilt angle θ of the TDM in (°) on (a) Ge(100) and (b) Ge(111) during negative and positive potential scans. | ||
Finally, AFM images taken before and after surface transformation experiments on both Ge surfaces showed morphological changes (Fig. 6). The rms roughness of Ge(100) before and after surface transformation experiments was found to be 0.22 nm and 0.88 nm, respectively. Similarly, for the Ge(111) surface, the rms roughness before and after surface transformation was 0.25 nm and 0.41 nm, respectively. AFM images of both Ge surfaces showed that surface roughness increased after polarising cathodically. Cathodic polarisation is needed to study the surface transformation. The surface roughness of Ge(100) increased more than that of Ge(111).
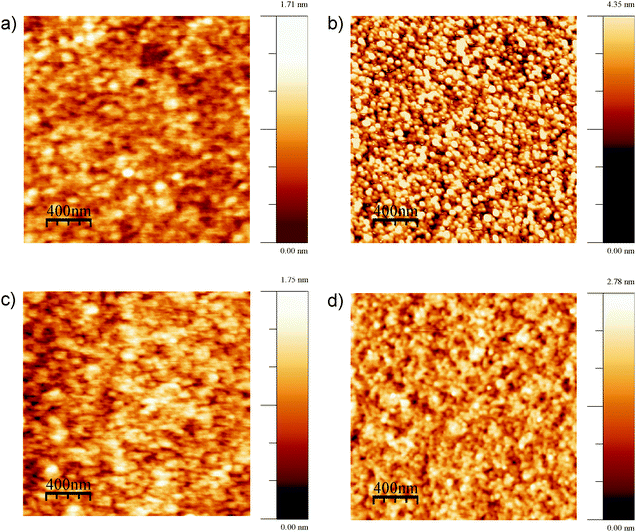 | ||
| Fig. 6 AFM images; Ge(100) surface (a) before electrochemical experiments, (b) after surface transformation experiments; Ge(111) surface (c) before and (d) after the electrochemical experiments. | ||
4 Discussion
Table 2 summarises the reported results of the Ge–H stretching modes in the vibrational spectra of H-terminated Ge surfaces.14,17 At negative potentials, two absorption peaks observed at 1990 cm−1 and 2015 cm−1 were assigned to stretching modes from GeH and GeH2 groups, respectively.17 This assignment was based on the data gathered under vacuum conditions,28 and agrees with the results from force field calculations.29| (I) | |||
|---|---|---|---|
| Ref. | Ge surface | Wavenumber/assignments | Reaction conditions |
| 30 | (100) | GeH (2 modes) | UHV (LEED) |
| (1979 antisymmetric) | |||
| (1991 symmetric) | |||
| 31 | (100) | 1987 (GeH1) | IRRAS after wet chemical treatment of HF for 10 min |
| 2020 (GeH2) | |||
| 2060 (GeH3) | |||
| 32 | (111) | 1980 (mixture of GeH1, GeH2 and GeH3) | After a 2000 L H2 exposure |
| 2021 (GeH2) | |||
| 2060 (GeH3) | |||
| 17 | (111)/(100) | 1970 (GeH1) | In situ electrochemical IR, 1 M HClO4 |
| 2020 (most likely GeH2) | |||
| 33 | (111)/(100) | 1960–1990 (GeH1) | In situ electrochemical IR, 1 M HClO4 |
| 2020 (GeH2) | |||
| 14 | (100) | 1970 (GeH1) | In situ electrochemical IR, 1 M HClO4 |
| 2030 (GeH2) | |||
To describe the full series of spectra completely and assign the different peaks observed on both Ge surfaces, at least three different components are required, centred around ∼2025–2030 cm−1 ( ), ∼2000–2015 cm−1 (
 ) and ∼1977–1990 cm−1 (
 ), with minor differences in maxima between Ge(100) and Ge(111) surfaces (see above). In this work, peaks will be assigned to a Ge–H stretching mode of a surface with mixed H/OH termination (
 ), the Ge–H stretching modes of GeH2 groups on Ge(100) facets (
 ) and the Ge–H stretching mode of GeH1 groups on Ge(111) facets (
 ), respectively. The reasoning for this assignment will be given in the following paragraphs. In the course of the discussion, reference will also be made to a number of studies on the vibrational spectra of H-terminated silicon,34–41 which was studied more widely and in more detail than germanium.
At the most negative potentials, the surface is supposed to be H-terminated to the maximum extent possible. On an unreconstructed Ge(111) surface, GeH1 groups are expected to dominate, with an TDM perpendicular to the surface (Table 2). On an unreconstructed Ge(100) surface, GeH2 are supposed to dominate, which should show two modes, a symmetric and an antisymmetric stretching mode, with TDMs perpendicular to each other (Table 2), in analogy to the situation for SiH2 groups.37,39
The observations (Table 1 and Fig. 2) showed that very similar components are observed on both Ge(111) and Ge(100) surfaces at negative potentials. Also the spectra of Ge(111) showed more than one component at negative potentials. The observed differences, which were also detected between different polarisations in the order of 10 cm−1 may be interpreted as due to the different surface species on the different surfaces. However, fitting the positions of multiple peaks is prone to correlations in the peak position, and hence the authors prefer the simpler explanation of the same surface species on both surfaces. (This should not rule out the presence of other species on the surface that affect the peak position, which cannot be resolved in this work.) The observed tilt angles (Fig. 5) were always on the higher tilt angle side than expected, which is a result of measured dichroic ratios which are likely too low. The dichroic ratios closer to 1 are in general less affected by polariser misalignment and polariser inefficiency.24 Without interpreting the quantitative data in detail, the fact remains that on Ge(111), the TDMs of the observed modes were more upright (less than 54.7°), while on Ge(100), the TDMs were parallel to the surface (larger than 54.7°) – partly in line with expectations. A hysteresis is observed in Fig. 3 for the surface concentration (Aiso) and in Fig. 5 (orientation) for different absorptions. Consequently, the surface transformation process on germanium is not fully reversible. The transformation may be kinetically hindered, or a certain overpotential is required to trigger the surface transformation to detectable rates.
The AFM images showed that the surfaces are not atomically flat. Roughness shifts TDM orientation towards random orientation (∼54.7°), which is presumably the reason why on Ge(111), no strong orientation was observed. On a real, predominantly Ge(111) surface, Ge(100) facets are expected to be present in regions where several atomic layer deep trenches are present. These regions are the explanation put forward here for the presence of GeH2 modes on a Ge(111) surface. Likewise, GeH2 groups are expected to be present near step edges. Compared to Ge(100), the Ge(111) experiments showed that the presence of the  peak, assigned here to GeH2 groups typically associated with Ge(100) surfaces, were less prominent on Ge(111) than on Ge(100) – in line with expectations. The interpretation of
  as associated with GeH1 stretching modes is in line with literature interpretation (see Table 2).28,29 Typically, for C–H stretching modes,42 Si–H modes,29,37,39,40 and Ge–H modes,29 the stretching modes involving fewer numbers of H atoms are observed at the lowest wavenumber, which is also in line with this interpretation. On unreconstructed, defect-poor Si(111), it was possible to observe a single vibrational mode with the appropriate orientation.34 The spectra were more complicated for surfaces with a number of defects, e.g. generated by etching.36
Peak  dominated the spectra of Ge(100) surfaces at negative potentials, and is interpreted as related to modes involving two hydrogen atoms (GeH2). It remains an open question as to why only one peak (rather than 2 peaks for the expected symmetric and antisymmetric modes) was observed. Observation of only one peak is, however, in line with literature data (Table 2). It has been observed previously that the symmetric and antisymmetric stretching modes of SiH2 and GeH2 groups are very close in wavenumber,29,37,39 so that they cannot be distinguished within the peak width observed here. Because antisymmetric modes are more intense in IR absorption spectroscopy (opposing the trend in Raman spectroscopy), the observed TDMs were mostly oriented parallel to the Ge(100) surface (Fig. 5) (in a similar manner to that on Si).37,39 Intensity differences are expected to be stronger here than well-known for organic molecules, because of the different electronegativities of Ge and C. This difference in TDM magnitude is used to explain the observed TDM orientation. The wavenumber of the
  peak observed in this work (2000–2015 cm−1) was slightly lower than that reported in the literature for Ge(100) surfaces (∼2020 cm−1; Table 2). The reason for this difference may be that indeed Ge(100) surfaces reconstruct differently in different media. One possible reconstruction involves the formation of surface dimers of type H–Ge–Ge–H, as shown schematically in Table 2. Dimers of this kind have been found on reconstructed Si(100).4,9,43 For these surface dimers, similar symmetric and antisymmetric modes are expected to the unreconstructed surface. It is possible that in diluted electrolytes such as those used here, no reconstruction is observed, while under UHV conditions Ge(100) reconstructs heavily. The opposite may equally well be true; the two alternatives cannot be distinguished without detailed experiments on the atomic scale, e.g. by STM.
Some literature assignments show GeH3 modes at rather high wavenumbers (∼2060 cm−1; Table 2). These were not observed here. GeH3 groups can only occur at kink sites, and should only be present as a minor component. They may simply have been present in too low concentration to be detected in the in situ experiments conducted here.
Absorption  observed at ∼2025–2030 cm−1 at −0.29 V for both Ge surfaces indicates the formation of a transient species during surface transformation. Considering barely the reported experimental data (Table 2), GeH2 and GeH3 groups may be candidates for the origin of this peak.28 On the other hand, both species are more likely the final products observed on a fully hydrogen terminated surface than the intermediates formed in an initial step of surface transformation. Experimentally, there was no evidence for the presence of a Ge–H surface termination at potentials more positive than −0.29 V. Two possibilities exist for the surface termination before the surface transformation. The surface may either be “plain”, i.e. have no specific termination, or may be –OH terminated, i.e. dangling bonds are saturated by –OH groups. At the positive potentials used here, surface oxidation is already observed in the CVs, so that here an –OH-covered surface is likely to be present. A transition from an –OH terminated to a non-terminated surface should be visible in the CVs as an additional peak, because the surface capacitance changes. As no additional peak was observed, it is likely that the surface was –OH terminated at potentials more positive than −0.29 V for both Ge surfaces. When attempting to draw a fully –OH covered surface, the authors realised that a complete –OH termination of Ge(100) is sterically rather demanding (see Fig. 7, which is a summary of the various structures obtained from the ATR-IR spectra). Therefore, the surface may either have been partially –OH terminated, or must be some form of reconstruct. The obvious intermediate to suggest for a transition of an OH-terminated surface to an H-terminated surface is a mixed termination, with structural elements of type H–Ge–OH. One alternative of a mixed termination on a reconstructed surface is the structural element H–Ge–Ge–OH. Both are shown in Table 2. The peak
  in this work is interpreted as originating from one of the mixed terminations on Ge(100). In line with the interpretation, for Si(100), the Si–H stretching mode of H–Si–OH is in between the Si–H modes of SiH2 and SiH3 groups.35,40 In particular, on Si(100)2 × 1 with the dimer structural element H–Si–Si–H, initial oxidation to H–Si–Si–OH also leads to a species with a vibrational mode with a wavenumber slightly higher than that of SiH2 groups.38,40 Overall, the detailed analysis available for silicon also shows that more reconstructions may play a role which have not been considered here.39
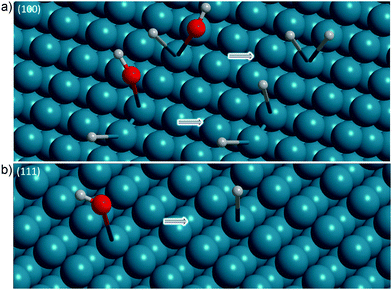 | ||
| Fig. 7 Summary of the structural elements observed during and after the surface transformation of (a) Ge(100) and (b) Ge(111) to full hydrogen termination. | ||
On Ge(111), such a simple mixed termination is not possible. However, as reasoned above, the non-ideal Ge(111) surfaces here should contain Ge(100) facets. The transient mixed termination is only observed on the Ge(100) facets on Ge(111). The facets of the respective other fundamental surfaces, i.e. Ge(111) facets on Ge(100) and Ge(100) facets on Ge(111), must typically be oriented almost perpendicular to the main surface orientation, i.e. Ge(100) or Ge(111), respectively. Hence, the observed TDM orientations must be approximately perpendicular to the orientation for the fundamental surfaces, i.e. the Ge–H stretching modes from Ge(111) facets on Ge(100) are expected to have a TDM oriented parallel to the Ge(100) surface, and vice versa. To rephrase this statement, the expectations of TDM orientations listed in Table 2 must be reversed on the defect facets. This expectation agreed to some extent with the observations here.
The investigation of the time evolution of the absorption peaks at a constant potential (Fig. 4) showed no transformation from a mixed termination to a pure H-termination or vice versa. Transformations between species with different peak wavenumbers occurred only with a potential jump. Nevertheless, the potential window in which this mixed termination was observed was narrow, ∼100 mV.
Equipped with the above assignment, it is interesting to discuss the differences in surface transformation between Ge(111) and Ge(100). Basically, Ge(111) starts to transform earlier than Ge(100). However, the potential range in which the surfaces are fully H-covered are equal for both surfaces, which means that both surfaces have approximately the same stability range. As the  peak was assigned to a mixed termination on Ge(100), this data may indicate that the overall atomistic picture of these surfaces must be more involved. The difference in the starting potential may either indicate the involvement of a different surface reconstruction on both surfaces, or a different role of different defects, kink sites, or step edges, in the different crystals.
5 Summary and conclusions
Fig. 7 presents an overview of the structures inferred from the ATR-IR spectra. During negative potential scans, the Ge surface started to form a transient species involving a mixed termination with H and OH groups at −0.29 V, which is absorbed at ∼2025–2030 cm−1. At strongly negative potentials (−0.79 V), the observed spectra are consistent with Ge(111) surfaces being covered by GeH1 (∼1977–1990 cm−1) and Ge(100) by GeH2 species (∼2000–2015 cm−1). The electrochemical ATR-IR characterisation of the Ge surface transformation presents a more detailed picture compared to previous findings.14,17,28In the discussion in this work, atypical surface reconstructions were not taken into account. A construction of a detailed surface structure from vibrational spectra alone is rather demanding. The picture discussed here is consistent to a large extent with the data presented. It is furthermore the simplest consistent picture. However, more complicated structures may be involved in and present after the surface transformation.
Acknowledgements
S. N. acknowledges ThyssenKrupp Steel Europe for a PhD scholarship in the framework of the IMPRS-SurMat. P. Ulrich Biedermann, Stefan Wippermann and Rochus Schmid are acknowledged for helpful discussion on the theoretical perspective of this transformation. Ganesh Vasan helped in the development of an analysis script and Stefanie Tecklenburg with literature compilation of the situation on silicon. Prof. M. Stratmann is acknowledged for continuous support. This work is supported by the Cluster of Excellence RESOLV (EXC 1069) funded by the Deutsche Forschungsgemeinschaft.References
- S. Cahangirov, M. Topsakal, E. Aktürk, H. Şahin and S. Ciraci, Phys. Rev. Lett., 2009, 102, 236804 CrossRef CAS PubMed.
- S. Wei and M. Y. Chou, Phys. Rev. B: Condens. Matter Mater. Phys., 1994, 50, 2221–2226 CrossRef CAS.
- C.-C. Liu, W. Feng and Y. Yao, Phys. Rev. Lett., 2011, 107, 076802 CrossRef PubMed.
- V. Lifshits, A. Saranin and A. Zotov, Surface Phases on Silicon: Preparation, Structures, and Properties, Wiley, Chichester, UK, 1994 Search PubMed.
- G. Chiarotti, S. Nannarone, R. Pastore and P. Chiaradia, Phys. Rev. B: Solid State, 1971, 4, 3398–3402 CrossRef.
- P. Geng, J. Márquez, L. Geelhaar, J. Platen, C. Setzer and K. Jacobi, Rev. Sci. Instrum., 2000, 71, 504–508 CrossRef CAS.
- M. Hugelmann, P. Hugelmann, W. Lorenz and W. Schindler, Surf. Sci., 2005, 597, 156–172 CrossRef CAS.
- P. Allongue, V. Costa-Kieling and H. Gerischer, J. Electrochem. Soc., 1993, 140, 1009–1018 CrossRef CAS.
- U. Neuwald, H. Hessel, A. Feltz, U. Memmert and R. Behm, Surf. Sci., 1993, 296, L8–L14 CrossRef CAS.
- V. Tolstoy, I. Chernyshova and V. Skryshevsky, Handbook of infrared spectroscopy of ultrathin films, Wiley, New Jersey, USA, 2003 Search PubMed.
- A. Erbe, A. Sarfraz, C. Toparli, K. Schwenzfeier and F. Niu, in Soft Matter at Aqueous Interfaces, ed. P. R. Lang and Y. Liu, Springer, Cham, Switzerland, 2016, vol. 917, pp. 459–490 Search PubMed.
- D. Gräf, M. Grundner and R. Schulz, J. Vac. Sci. Technol., A, 1989, 7, 808–813 Search PubMed.
- M. Morita, T. Ohmi, E. Hasegawa, M. Kawakami and K. Suma, Appl. Phys. Lett., 1989, 55, 562–564 CrossRef CAS.
- J.-N. Chazalviel, A. Belaïdi, M. Safi, F. Maroun, B. Erne and F. Ozanam, Electrochim. Acta, 2000, 45, 3205–3211 CrossRef CAS.
- R. Memming and G. Neumann, J. Electroanal. Chem., 1969, 21, 295–305 CrossRef CAS.
- H. Gerischer and W. Mindt, Surf. Sci., 1966, 4, 440–451 CrossRef CAS.
- F. Maroun, F. Ozanam and J.-N. Chazalviel, J. Phys. Chem. B, 1999, 103, 5280–5288 CrossRef CAS.
- F. Maroun, J.-N. Chazalviel, F. Ozanam and D. Lincot, J. Electroanal. Chem., 2003, 549, 161–163 CrossRef CAS.
- S. Nayak, P. U. Biedermann, M. Stratmann and A. Erbe, Phys. Chem. Chem. Phys., 2013, 15, 5771–5781 RSC.
- S. Nayak, P. U. Biedermann, M. Stratmann and A. Erbe, Electrochim. Acta, 2013, 106, 472–482 CrossRef CAS.
- E. Goormaghtigh, V. Raussens and J.-M. Ruysschaert, Biochim. Biophys. Acta, Biomembr., 1999, 1422, 105–185 CrossRef CAS.
- D. A. Woods and C. D. Bain, Soft Matter, 2014, 10, 1071–1096 RSC.
- N. J. Harrick, Internal Reflection Spectroscopy, Harrick Scientific, New York, 1987 Search PubMed.
- A. Erbe, R. J. Bushby, S. D. Evans and L. J. C. Jeuken, J. Phys. Chem. B, 2007, 111, 3515–3524 CrossRef CAS PubMed.
- J. Bertie and Z. Lan, Appl. Spectrosc., 1996, 50, 1047–1057 CrossRef CAS.
- P. Wenzl, M. Fringeli, J. Goette and U. P. Fringeli, Langmuir, 1994, 10, 4253–4264 CrossRef CAS.
- I. Horcas, R. Fernández, J. M. Gómez-Rodríguez, J. Colchero, J. Gómez-Herrero and A. M. Baro, Rev. Sci. Instrum., 2007, 78, 013705 CrossRef CAS PubMed.
- S. Amy and Y. Chabal, Passivation and Characterization of Germanium Surfaces, in Advanced Gate Stacks for High-Mobility Semiconductors, ed. A. Dimoulas, E. Gusev, P. McIntyre and M. Heyns, Springer, 2007, vol. 27, pp. 73–113 Search PubMed.
- M. Cardona, Phys. Status Solidi B, 1983, 118, 463–481 CrossRef CAS.
- Y. Chabal, Surf. Sci., 1986, 168, 594–608 CrossRef CAS.
- S. Rivillon, Y. J. Chabal, F. Amy and A. Kahn, Appl. Phys. Lett., 2005, 87, 253101 CrossRef.
- E. Crowell and G. Lu, J. Electron Spectrosc. Relat. Phenom., 1990, 54/55, 1045–1057 CrossRef.
- F. Maroun, F. Ozanam and J.-N. Chazalviel, Surf. Sci., 1999, 427–428, 184–189 CrossRef CAS.
- Y. Chabal, P. Dumas, P. Guyot-Sionnest and G. Higashi, Surf. Sci., 1991, 242, 524–530 CrossRef CAS.
- M. Weldon, V. Marsico, Y. Chabal, D. Hamann, S. Christman and E. Chaban, Surf. Sci., 1996, 368, 163–178 CrossRef CAS.
- P. Jakob, Y. Chabal, K. Raghavachari, R. Becker and A. Becker, Surf. Sci., 1992, 275, 407–413 CrossRef CAS.
- P. Dumas, Y. Chabal and P. Jakob, Surf. Sci., 1992, 269, 867–878 CrossRef.
- M. K. Weldon, B. B. Stefanov, K. Raghavachari and Y. J. Chabal, Phys. Rev. Lett., 1997, 79, 2851–2854 CrossRef CAS.
- Y. Chabal, M. Weldon, Y. Caudano, B. Stefanov and K. Raghavachari, Phys. B, 1999, 273–274, 152–163 CrossRef CAS.
- M. K. Weldon, K. T. Queeney, A. B. Gurevich, B. B. Stefanov, Y. J. Chabal and K. Raghavachari, J. Chem. Phys., 2000, 113, 2440–2446 CrossRef CAS.
- Y. Caudano, P. Thiry and Y. Chabal, Surf. Sci., 2002, 502–503, 91–95 CrossRef CAS.
- R. A. Nyquist, Interpreting infrared, Raman, and nuclear magnetic resonance spectra, Academic Press, San Diego, USA, 2001 Search PubMed.
- J. E. Northrup, Phys. Rev. B: Condens. Matter Mater. Phys., 1991, 44, 1419–1422 CrossRef CAS.
Footnote |
| † Present address: Inorganic Chemistry Laboratory, Department of Chemistry, University of Oxford, South Parks Road, Oxford, OX1 3QR, UK. |
| This journal is © the Owner Societies 2016 |

