
 Open Access Article
 This Open Access Article is licensed under a Creative Commons Attribution-Non Commercial 3.0 Unported Licence
A phenomenological model of the solvent-assisted lipid bilayer formation method
Jurriaan J. J.
Gillissen
ab,
Seyed R.
Tabaei
ab and
Nam-Joon
Cho
 *abc
*abc
aSchool of Materials Science and Engineering, Nanyang Technological University, 50 Nanyang Avenue 639798, Singapore. E-mail: njcho@ntu.edu.sg
bCentre for Biomimetic Sensor Science, Nanyang Technological University, 50 Nanyang Drive 637553, Singapore
cSchool of Chemical and Biomedical Engineering, Nanyang Technological University, 62 Nanyang Drive 637459, Singapore
First published on 8th August 2016
Abstract
The recently introduced solvent-assisted lipid bilayer (SALB) formation method allows one to efficiently fabricate planar, lipid bilayers on solid supports and can be used for various applications. It involves the introduction of an aqueous buffer into a mixture of lipid and alcohol, which is incubated on a solid support. The associated phase changes in the ternary bulk system are accompanied by the formation of a lipid bilayer at the solid–liquid interface. While the phase behavior of the ternary bulk system is well understood, the mechanism of bilayer assembly at the solid–liquid interface remains to be elucidated, including whether the adsorption process is limited by diffusion of the lipid in the bulk or by lipid binding kinetics onto the surface. Such factors strongly influence the success of bilayer formation as they pertain to operating conditions, such as lipid concentration, solvent exchange rate and chamber dimensions, and are hence of critical importance for SALB fabrication strategies. Herein, we extend an earlier proposed phenomenological kinetic model of the SALB formation process, based on a volume-averaged treatment of the solvent mixing process. By comparing the model to quartz crystal microbalance with dissipation monitoring (QCM-D) experimental data, we conclude that SALB formation is limited by diffusion of suspended lipid aggregates, with a hydrodynamic radius, that is consistent with aggregate size measurements in the literature. This agreement validates the proposed model to serve as the basis for optimizing conditions for SALB formation.
Introduction
Supported lipid bilayers (SLBs)1 are membrane-mimetic platforms,2,3 which preserve the fundamental features of highly complex biomembranes, such as bilayer thickness, lateral lipid mobility and the ability to host membrane associated biomolecules.4,5 SLBs enable membrane-related processes to be studied by highly sensitive, surface-based analytical tools. For instance, total internal reflection microscopy,6 atomic force microscopy,7,8 impedance spectroscopy9 and quartz crystal microbalance with dissipation (QCM-D)10,11 have successfully been applied to SLBs for biosensor development,12,13 drug discovery14–16 and protein assembly.17–19Several approaches have been developed for fabrication of SLBs, including air bubble collapse20 and dip-pen nanolithography21 for submicron-sized membrane patches and spin-coating for membrane stacks.22 For a continuous coverage of a substrate with a single, planar bilayer, Langmuir–Blodgett4 and vesicle fusion (VF)23 can be used. In particular, the VF method, which involves adsorption, spontaneous rupture and spreading of small unilamellar vesicles (≤100 nm diameter) on a solid support, has become a standard method for bilayer formation.
Since the VF method requires a relatively large adhesion force between the vesicles and the substrate, such that the vesicles rupture and spread spontaneously upon adsorption, the VF method is limited to a sub-set of surfaces, mainly silica-based materials, such as glass and mica,24,25 while the other important surfaces, such as Au,23,26 TiO227 and Al2O328 or nanostructured ones are intractable to vesicle fusion, as well as certain biologically relevant membrane compositions, with a high fraction of cholesterol for instance.29 In some cases, it is possible to overcome these limitations by altering the environmental factors, such as ionic strength,30 pH,31 temperature,32 osmotic imbalance33 and the addition of divalent cations.34 Alternatively, other self-assembly routes which bypass vesicle rupture can be used.
The solvent-assisted lipid bilayer (SALB) formation method35 is an alternative technique to form supported lipid bilayers, which does not require preparation of vesicles. The method involves introduction of an aqueous buffer into a mixture of lipids and water-miscible alcohol (e.g. isopropanol). This ternary system flows through a fluidic chamber contacting a solid support.36 This principle has also been used to form liposomes.37 It is known that, with increasing water content, this ternary system undergoes phase transitions in the bulk, where the lipid structures change from inverted micelles to individual molecules, then to micelles, and subsequently to vesicles.36 Simultaneously, as the water content is increased, lipids form an adsorbed phase at the solid–liquid interface. For small water fractions, the adsorbed lipid phase, which is in the form of small mono-layered patches, is in dynamic equilibrium with the dissolved lipid phase in the bulk,38 while at sufficiently large water fractions, the adsorbed lipid phase constitutes a complete supported lipid bilayer. Hohner et al. correlated the equilibrium adsorbed bilayer mass at various water fractions to the lipid aggregate size distribution in the bulk, and concluded that, with increasing water fraction, the supported bilayer forms just before the micelle to vesicle phase transition occurs in the bulk.36
The SALB formation method has been applied to surfaces which are intractable to the VF method, such as Al2O3, Cr, SnO2, and Au.35,39,40 The method also extends the range of possible compositions of artificial membranes, allowing for instance the formation of bilayers with a high cholesterol content.41,42
Although the formation of bilayers via the SALB method has been demonstrated to be correlated with the micelle to vesicle phase transition in the bulk, the exact formation mechanism is not known. For instance, it is unclear, whether the formation rate is determined by the binding kinetics onto the surface or by the lipid diffusivity in the bulk. These aspects determine the extent of bilayer formation as a function of the operating conditions and are of crucial importance for optimizing the SALB formation process.
In this work, we address the aforementioned question, by extending an earlier proposed, phenomenological kinetic model for SALB formation, based on a volume averaged treatment of the solvent mixing.35 The model in ref. 35 assumes that bilayers are formed by adsorbing micelles and it incorporates micelle attachment to the support via a rate constant ka and predicts that SALB formation is complete for a sufficiently large lipid concentration in the bulk c0 and for a sufficiently small solvent exchange rate γ [s−1] and it is incomplete for small c0 or large γ. Here we refine this model with an explicit expression for ka based on the diffusion flux in laminar flow, which depends on chamber geometry, flow speed and the hydrodynamic radius of the lipid (aggregates). We fit the extended model to quartz crystal microbalance with dissipation monitoring (QCM-D) experimental data of the mass of the adsorbed lipid phase. Using this approach, we deduce the details of the adsorption kinetics leading to SALB formation.
SALB formation model
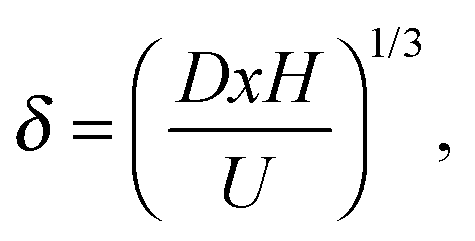
The dynamics of SALB formation depends on the mixing characteristics of the aqueous buffer with the lipid–alcohol mixture, which in turn depend on the geometrical details of the fluidic chamber.43 In the present experiments however, as will be shown below, the mixing may vary considerably upon repeating the experiment under identical conditions. Therefore, we do not attempt to model the detailed, space-dependent flow and mixing in the fluidic chamber, but restrict the modeling to volume-averaged quantities, and restrict the comparison between model and experiment to the equilibrated bilayer mass after full solvent exchange, for which, as will be shown below, experimental variations are modest.We consider a mixture of lipids and water-miscible alcohol that is contained in a cylindrical chamber with diameter L and height H. The geometry is sketched in Fig. 1. The lipid concentration is c0. At t = 0 aqueous buffer is fed into the chamber with volume rate Q, where it mixes with the lipid–alcohol mixture. The mixture is assumed to be homogeneous, except for a thin boundary layer at the bottom surface, with a thickness: δ ≪ H.
 | ||
| Fig. 1 The QCM-D setup consists of a cylindrical, fluidic chamber with a diameter L and a height H. The solvent assisted lipid bilayer is formed on the bottom surface of the chamber. | ||
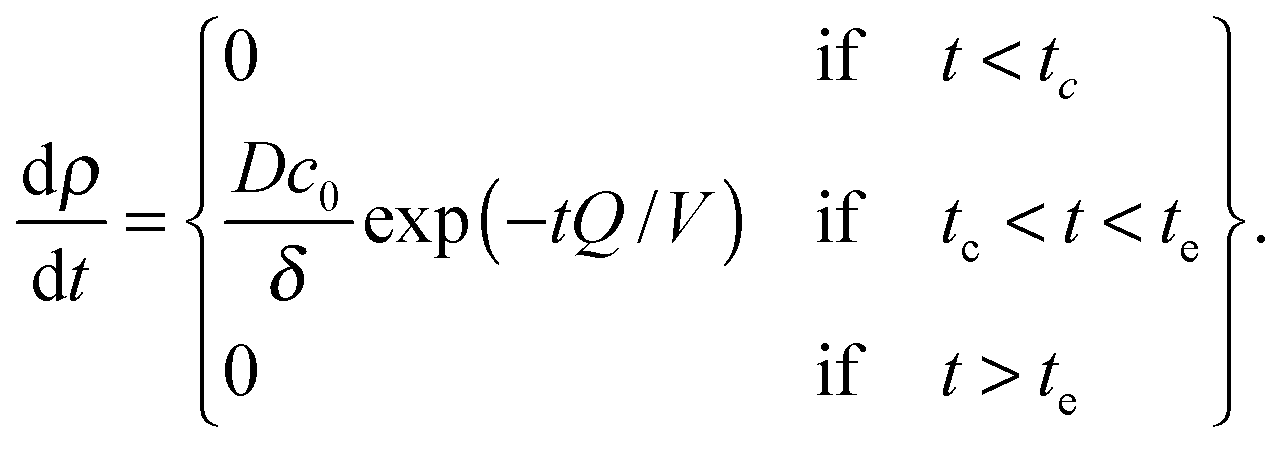
The bilayer formation model is an extension of a model presented earlier,35 and it is based on the assumption that lipids adsorb onto the surface in the form of micelles. Micelles form in the bulk when the water fraction Φ exceeds a certain critical value Φc.35,36 Accordingly, the bilayer areal mass density ρ increases due to a deposition mass flux J, which is zero, when Φ < Φc, and it is zero also when the bilayer mass density reaches its fully developed value ρLB:
 | (1) |
 | (2) |
 | (3) |
The diffusivity D depends on the form in which the lipids diffuse towards the surface, where single lipid molecules diffuse faster than large aggregates, such as micelles or vesicles. In the model we treat the lipid size R as an unknown parameter, which will be determined by matching the model to the experimental data, as seen below. The relation between the diffusivity and the particle size is given by the Stokes–Einstein relation:
 | (4) |
Assuming perfectly mixed conditions in the QCM-D chamber (except for the boundary layer), the bulk lipid concentration cb and the water volume fraction Φ in the chamber evolve as follows:46
cb = c0![[thin space (1/6-em)]](https://www.rsc.org/images/entities/char_2009.gif) exp(−tQ/V), exp(−tQ/V), | (5) |
| Φ = 1 − exp(−tQ/V). | (6) |
| Φc = 1 − exp(−tcQ/V). | (7) |
 | (8) |
 | (9) |
 | (10) |
 | (11) |
 | (12) |
 | (13) |
 | (14) |
 | (15) |
Materials and methods
Lipid preparation
Zwitterionic 1,2-dioleoyl-sn-glycero-3-phosphocholine (DOPC) lipid was purchased from Avanti Polar Lipids (Alabaster, AL). A stock solution was prepared by dissolving the lipid powder in isopropanol (IPA) at a concentration of 5 μg mm−3. Prior to the experiments, the stock solution was further diluted with IPA to the desired lipid concentration. In the SALB formation experiment, the DOPC–IPA mixture was exchanged with an aqueous buffer solution with 150 mM NaCl, 10 mM Tris and a pH of 7.5.Quartz crystal microbalance-dissipation (QCM-D)
A Q-Sense E4 (Q-Sense AB, Gothenburg, Sweden) setup was used to measure the adsorbed bilayer mass, employing an AT-cut, 5 MHz, piezoelectric quartz crystal, coated with an atomically flat silicon dioxide film, with an active area A = 97 mm2, mounted in a cylindrical fluidic chamber, with height H = 0.6 mm, diameter 11.1 mm and volume V = 58 mm3. Prior to use, the substrate was cleaned by immersion in 1% sodium dodecyl sulfate (SDS), rinsed with Milli-Q water (Millipore), dried with a stream of nitrogen gas and treated with oxygen plasma at 180 W for 30 s (March Plasmod Plasma Etcher, March Instruments, California). The frequency shifts Δfn and dissipation shifts ΔDn were recorded at the 3rd, 5th, 7th, 9th and 11th overtones under flow-through conditions, using a peristaltic pump (Ismatec Reglo Digital M2-2/12). The temperature of the flow cell was fixed at 24.0 ± 0.5 °C. Experiments were conducted for various lipid concentrations c0 between 0.01 and 0.5 μg mm−3 and for various flow rates Q between 0.83 and 10 mm3 s−1, respectively. Further details of QCM-D principles and operation can be found elsewhere.47Results
We have used QCM-D to measure the extent of SALB formation at various lipid concentrations (c0 = 0.01 − 0.5 μg mm−3) and flow rates (Q = 0.83 − 10 mm3 s−1).35,38Fig. 2A shows, for c0 = 0.5 μg mm−3 and Q = 0.83 mm3 s−1, the recorded negative frequency shift −Δfn/n, which itself is a positive quantity, for the third overtone, i.e. n = 3, as a function of time. At t = 0, pure buffer is injected into the QCM-D flow chamber, which defines the zero (baseline) frequency and dissipation shifts, i.e. Δfn = 0 and ΔDn = 0. It is noted that t = 0 in the experiments (buffer injection) does not correspond to t = 0 in the model (organic to aqueous solvent exchange). At t = 6 min pure IPA is injected, inducing a gradual exchange in the chamber from buffer to IPA. Due to the non-monotonic viscosity of the buffer–IPA mixture48 (Fig. 2B), Δfn first increases and then it decreases during the solvent exchange. After full exchange, at t = 20 min and −Δf3/3 = 134 Hz, the lipid–IPA solution (c0 = 0.5 μg mm−3) is injected, resulting in −Δf3/3 increasing slightly, from 134 Hz to 139 Hz. This increase does not correspond to bilayer formation but to the formation of lipid monolayer patches on the support, which are in dynamic equilibrium with the bulk lipid.40 After equilibration (t = 36 min), the flow is switched back to buffer solution, where again due to the non-monotonic viscosity (Fig. 2B), the −Δf3/3 first increases and then it decreases. The signal does not return back to zero (baseline), but instead reaches: −Δf3/3 = 26 Hz, which corresponds to an adsorbed mass of ρAD = −CΔf3/3 = 4.4 ng mm−2, which is in the correct range for lipid bilayers.49 Here C = 0.17 ng s mm−2 is the Sauerbrey constant of the sensor.50 | ||
| Fig. 2 QCM-D measurements of solvent-assisted lipid bilayer formation using lipid concentration c0 = 0.5 μg mm−3 and flow rate Q = 0.83 mm3 s−1. (A) The negative frequency shift for the third overtone scaled with the overtone number −Δf3/3 as a function of time. The experiment starts with the injection of pure buffer. At t = 5 min the flow is switched to IPA (left inset). At t = 20 min the flow is switched to lipid–IPA mixture (middle inset). At t = 36 min the flow is switched back to buffer (right inset). (B) The viscosity of the water–isopropanol mixture as a function of the water fraction.48 (C) The final scaled frequency shift and dissipation shift as functions of the overtone number. The frequency and dissipation shifts are scaled such that they represent the inertia force and the friction force on the QCM-D, scaled with the inertia of the quartz. (D) Two SALB formation experiments at identical conditions produce roughly the same final frequency shift (−Δf3/3) but show markedly different transient behaviors. | ||
Fig. 2C shows the final scaled frequency shift −Δfn/fn and dissipation shift ΔDn/π as functions of the overtone number n, where fn = nf0 is the overtone resonance frequency and f0 = 5 MHz is the QCM-D fundamental frequency. These quantities correspond to the forces on the quartz (scaled with the quartz inertia) due to the adsorption of the lipids, where −Δfn/fn is the inertial force, which is in phase with the quartz acceleration and ΔDn/π is the friction force, which is in phase with the quartz velocity.51 The data show that −Δfn/fn is overtone independent and that ΔDn/π ≪ − Δfn/fn. Both these observations indicate that the lipid adsorbs into a homogeneous film, which oscillates rigidly and in phase with the oscillating quartz, which is consistent with the formation of a lipid bilayer.
Upon repetition of the experiment under identical conditions, the time evolution of −Δf3/3 during the solvent exchange is observed to vary from experiment to experiment (Fig. 2D). These variations are due to variations in the mixing process in the QCM-D chamber. Variations in the final bilayer mass however are modest (∼10%), as can be seen in Table 1. Therefore, we do not analyze the transient mixing details, but focus the analysis on the final bilayer mass.
| c 0 [mg mL−1] | Q [mm3 s−1] | −Δf3/3 [Hz] mean | −Δf3/3 [Hz] standard deviation | N |
|---|---|---|---|---|
| 0.01 | 0.83 | 10 | 1.6 | 4 |
| 0.05 | 0.83 | 7.7 | 3.9 | 4 |
| 0.1 | 0.83 | 21.4 | 1.6 | 4 |
| 0.25 | 0.83 | 26.3 | 1.8 | 4 |
| 0.5 | 0.83 | 25.3 | 0.3 | 4 |
| 0.1 | 0.83 | 26.6 | — | 1 |
| 0.1 | 3.33 | 14.4 | — | 1 |
| 0.1 | 6.67 | 9.0 | 2.1 | 2 |
| 0.1 | 10 | 4.7 | — | 1 |
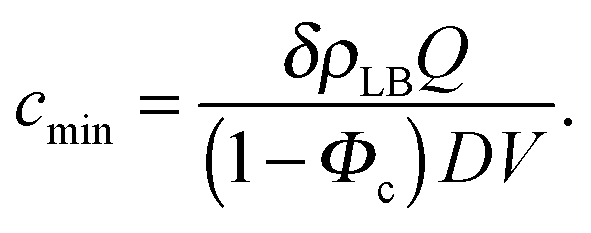
Fig. 3A and Table 1 show the final bilayer mass as a function of the lipid concentration c0 at a fixed flow rate of Q = 0.83 mm3 s−1. Fitting eqn (11) to the data in Fig. 3A gives the minimum lipid concentration required to form a full bilayer of cmin = 0.13 μg mm−3. Inserting this value into eqn (13) provides the diffusivity of the lipid that is transported towards the bilayer. Eqn (13) also contains the critical water fraction Φc. Since the value for Φc is not known for the water–IPA–DOPC system, we assume Φc = ½, which is consistent with the measured Φc in the range (0.4–0.8), using 1,2-dimyristoyl-sn-glycero-3-phosphocholin (DMPC) and 1,2-dimyristoyl-sn-glycero-3-trimethylammoniumpropane (DMTAP) dissolved in water and IPA.36 In the Discussion and conclusion section, we will discuss the sensitivity of the outcome of the model to the exact value of Φc. Inserting cmin = 0.13 μg mm−3 together with Φc = ½ and Q = 0.83 mm3 s−1 into eqn (13) gives a diffusivity of D = 139 μm2 s−1, and inserting this diffusivity value into eqn (4) gives a radius of R = 0.6 nm, where we have used a solvent viscosity of η = 2.5 g m−1 s−1, which corresponds to a 50% water fraction (Fig. 2B), which is consistent with the assumption Φc = ½ above.
 | ||
| Fig. 3 Effect of lipid concentration and flow rate on SALB formation. (A) Bilayer formation as a function of lipid concentration using a constant flow rate of 0.83 mm3 s−1. The line represents a fit [eqn (11)] through the data. (B) Bilayer formation as a function of flow rate using a constant lipid concentration of 0.1 μg mm−3. The line represents a fit [eqn (14)] through the data. Bilayer formation was defined as the final QCM-D frequency shift after full solvent exchange −Δf3/3 divided by the value that corresponds to a complete bilayer, i.e. 26 Hz. | ||
Fig. 3B and Table 1 show the final bilayer mass as a function of the solvent exchange rate Q, at a fixed lipid concentration c0 = 0.1 μg mm−3. Increasing Q reduces the contact time between the lipid solution and the target surface, inhibiting bilayer formation. Fitting eqn (14) to the data in Fig. 3B gives a maximum flow rate to ensure a full bilayer formation of Qmax = 0.8 mm3 s−1. Inserting this value together with c0 = 0.1 μg mm−3 into eqn (15) gives a diffusivity of D = 237 μm2 s−1, and inserting this diffusivity value into eqn (4) gives a radius of R = 0.2 nm. Furthermore, as seen in Fig. 3B, the model (Q−2/3 law) correctly predicts that upon increasing Q to 10-fold, i.e. from 1 to 10 mm3 s−1, the bilayer mass reduces five-fold, i.e. from 25 Hz to 5 Hz.
Discussion and conclusion
We have extended an earlier proposed phenomenological model for the solvent-assisted lipid bilayer (SALB) formation, by assuming that the lipid adsorption process is limited by diffusion. In the model the diffusivity acts as a free parameter, which we have obtained by fitting the model to experimentally measured bilayer mass, either as a function of the lipid concentration or as a function of the flow rate. The diffusivities from both procedures are in the same range, i.e. D = 139 μm2 s−1 and 237 μm2 s−1, which supports that the model correctly predicts the flow rate and concentration dependencies of the SALB formation process and that it can be used as a design tool for optimizing the SALB formation in different experimental configurations.Furthermore, we have used the Stokes–Einstein relation to determine the hydrodynamic radius of the adsorbing lipid: R = 0.4 ± 0.2 nm. It is noted that for objects with a radius smaller than ∼0.5 nm, the diffusivity can be somewhat larger, than the value predicted by the Stokes–Einstein model.52 Applying these corrections to the present analysis may give a somewhat larger value for R.
Let us now verify the assumption that the adsorption process is limited by diffusion, i.e. that kδ/D ≫ 1. To this end, we consider the consequences of assuming that kδ/D ≪ 1, by imagining that we decrease k from a value that is very large to a value that is very small compared to D/δ, while keeping all the other parameters constant. Reducing k at a constant D reduces the adsorption rate and therefore results in a lower bilayer mass. In order to match the experimentally measured bilayer mass would therefore require a larger diffusivity, which corresponds to a smaller particle size, according to the Stokes–Einstein relation [eqn (4)]. Above, we estimated that matching the experimental data with a diffusion-limited model (kδ/D ≫ 1) requires a particle of nano-meter size. Therefore matching the experimental data, assuming kδ/D ≪ 1, would require the adsorbing particles to be (order(s) of magnitude) smaller than a nano-meter. This hypothetical violation of physical constraints suggests that the process is indeed limited by diffusion, or that the diffusion velocity D/δ is at most of the same order of magnitude as the adsorption rate constant k.
Another crucial assumption in our model is the value for the critical water fraction, which is unknown in the present system, and which was arbitrarily chosen as Φc = ½. To see the influence of this parameter on the results, we re-calculate the diffusivities and the corresponding hydrodynamic radii R, by inserting cmin = 0.13 μg mm−3 and Qmax = 0.8 mm3 s−1 into eqn (13) and (15), respectively, for the limiting case of Φc → 1, which results in R = 1.1 ± 0.6 nm.
Considering the above mentioned factors, we conclude that in the present experiments, lipids diffuse towards the surface in a form that has a hydrodynamic radius of R ∼ 1 nm. Given the level of approximation of our model, this value is consistent with the earlier experimental observation, that lipid micelles are the key building blocks for SALB formation.36 In this regard it is noted that, even though our experiments involve a dynamically changing water content, the bulk system is in quasi-equilibrium, and can therefore be compared to experiments under equilibrium conditions.36 The quasi-equilibrium bulk phase condition follows from the time scale for micelle formation τc ∼ 10−5 s, estimated from Smoluchowski theory: τc ∼ (4πDRc)−1 and measured experimentally,53 which is orders of magnitude smaller than that of bilayer formation τLB ∼ δρLB/(Dc0) ∼ 102 s. Here R ∼ 10−9 m is the micelle radius, c = c0/ML ∼ 1023 m−3 is the number density of individual lipid molecules, ML ∼ 10−24 kg is the mass of one lipid molecule, D ∼ 10−10 m2 s−1 is the lipid diffusivity and δ ∼ 10−6 m is the boundary layer thickness.
In summary, our results are consistent with the literature findings and the proposed phenomenological model may serve as a design tool to find the optimal operating conditions for SALB formation, such as lipid concentration, flow rate and chamber dimensions.
Acknowledgements
We would like to acknowledge the funding support from the National Research Foundation (NRF2015NRF-POC001-019) to N.-J. C.References
- E. Sackmann, Science, 1996, 271, 43–48 CAS.
- K. Ariga, Chem. Rec., 2004, 3, 297–307 CrossRef CAS PubMed.
- Y.-H. M. Chan and S. G. Boxer, Curr. Opin. Chem. Biol., 2007, 11, 581–587 CrossRef CAS PubMed.
- L. K. Tamm and H. M. McConnell, Biophys. J., 1985, 47, 105–113 CrossRef CAS PubMed.
- E. Kalb, J. Engel and L. K. Tamm, Biochemistry, 1990, 29, 1607–1613 CrossRef CAS PubMed.
- T. Dewa, R. Sugiura, Y. Suemori, M. Sugimoto, T. Takeuchi, A. Hiro, K. Iida, A. T. Gardiner, R. J. Cogdell and M. Nango, Langmuir, 2006, 22, 5412–5418 CrossRef CAS PubMed.
- J. Mou, J. Yang and Z. Shao, J. Mol. Biol., 1995, 248, 507–512 CrossRef CAS PubMed.
- J. Schneider, Y. F. Dufrêne, W. R. Barger and G. U. Lee, Biophys. J., 2000, 79, 1107–1118 CrossRef CAS PubMed.
- C. Steinem, A. Janshoff, W.-P. Ulrich, M. Sieber and H.-J. Galla, Biochim. Biophys. Acta, Biomembr., 1996, 1279, 169–180 CrossRef.
- A. Janshoff, H.-J. Galla and C. Steinem, Angew. Chem., Int. Ed., 2000, 39, 4004–4032 CrossRef CAS.
- M. Edvardsson, S. Svedhem, G. Wang, R. Richter, M. Rodahl and B. Kasemo, Anal. Chem., 2008, 81, 349–361 CrossRef PubMed.
- K. Ariga, J. P. Hill and H. Endo, Int. J. Mol. Sci., 2007, 8, 864–883 CrossRef CAS.
- E. T. Castellana and P. S. Cremer, Surf. Sci. Rep., 2006, 61, 429–444 CrossRef CAS.
- P. Kongsuphol, K. B. Fang and Z. Ding, Sens. Actuators, B, 2013, 185, 530–542 CrossRef CAS.
- W. Römer and C. Steinem, Biophys. J., 2004, 86, 955–965 CrossRef.
- R. Mishra, B. Bulic, D. Sellin, S. Jha, H. Waldmann and R. Winter, Angew. Chem., Int. Ed., 2008, 47, 4679–4682 CrossRef CAS PubMed.
- N. L. Thompson, C. L. Poglitsch, M. M. Timbs and M. L. Pisarchick, Acc. Chem. Res., 1993, 26, 567–573 CrossRef CAS.
- H. McConnell, T. Watts, R. Weis and A. Brian, Biochim. Biophys. Acta, 1986, 864, 95–106 CrossRef CAS.
- Y. A. Domanov and P. K. J. Kinnunen, J. Mol. Biol., 2008, 376, 42–54 CrossRef CAS PubMed.
- M. D. Mager and N. A. Melosh, Langmuir, 2007, 23, 9369–9377 CrossRef CAS PubMed.
- S. Lenhert, P. Sun, Y. Wang, H. Fuchs and C. A. Mirkin, Small, 2007, 3, 71–75 CrossRef CAS PubMed.
- U. Mennicke and T. Salditt, Langmuir, 2002, 18, 8172–8177 CrossRef CAS.
- C. Keller and B. Kasemo, Biophys. J., 1998, 75, 1397–1402 CrossRef CAS PubMed.
- P. S. Cremer and S. G. Boxer, J. Phys. Chem. B, 1999, 103, 2554–2559 CrossRef CAS.
- H. Egawa and K. Furusawa, Langmuir, 1999, 15, 1660–1666 CrossRef CAS.
- N. J. Cho, S. J. Cho, K. H. Cheong, J. S. Glenn and C. W. Frank, J. Am. Chem. Soc., 2007, 129, 10050–10051 CrossRef CAS PubMed.
- N.-J. Cho and C. W. Frank, Langmuir, 2010, 26, 15706–15710 CrossRef CAS PubMed.
- M. D. Mager, B. Almquist and N. A. Melosh, Langmuir, 2008, 24, 12734–12737 CrossRef CAS PubMed.
- H. Schönherr, J. M. Johnson, P. Lenz, C. W. Frank and S. G. Boxer, Langmuir, 2004, 20, 11600–11606 CrossRef PubMed , 444.
- S. Boudard, B. Seantier, C. Breffa, G. Decher and O. Felix, Thin Solid Films, 2006, 495, 246–251 CrossRef CAS.
- N.-J. Cho, J. A. Jackman, M. Liu and C. W. Frank, Langmuir, 2011, 27, 3739–3748 CrossRef CAS PubMed.
- E. Reimhult, F. Höök and B. Kasemo, Phys. Rev. E: Stat., Nonlinear, Soft Matter Phys., 2002, 66, 051905 CrossRef CAS PubMed.
- J. A. Jackman, J.-H. Choi, V. P. Zhdanov and N.-J. Cho, Langmuir, 2013, 29, 11375–11384 CrossRef CAS PubMed.
- M. Dacic, J. A. Jackman, S. Yorulmaz, V. P. Zhdanov, B. Kasemo and N.-J. Cho, Langmuir, 2016, 32, 6486–6495 CrossRef CAS PubMed.
- S. R. Tabaei, J.-H. Choi, G. Haw Zan, V. P. Zhdanov and N.-J. Cho, Langmuir, 2014, 30, 10363–10373 CrossRef CAS PubMed.
- A. Hohner, M. David and J. Rädlera, Biointerphases, 2010, 5, 1–8 CrossRef CAS PubMed.
- F. Szoka and D. Papahadjopoulos, Proc. Natl. Acad. Sci., 1978, 75, 4194–4198 CrossRef CAS.
- S. R. Tabaei, J. A. Jackman, S.-O. Kim, V. P. Zhdanov and N.-J. Cho, Langmuir, 2015, 31, 3125–3134 CrossRef CAS PubMed.
- J. A. Jackman, S. R. Tabaei, Z. Zhao, S. Yorulmaz and N.-J. Cho, ACS Appl. Mater. Interfaces, 2014, 7, 959–968 Search PubMed.
- S. R. Tabaei, J. A. Jackman, S.-O. Kim, V. P. Zhdanov and N.-J. Cho, Langmuir, 2015, 31, 3125–3134 CrossRef CAS PubMed.
- S. R. Tabaei, J. A. Jackman, S.-O. Kim, B. Liedberg, W. Knoll, A. N. Parikh and N.-J. Cho, Langmuir, 2014, 30, 13345–13352 CrossRef CAS PubMed.
- S. R. Tabaei, J. A. Jackman, B. Liedberg, A. N. Parikh and N.-J. Cho, J. Am. Chem. Soc., 2014, 136, 16962–16965 CrossRef CAS PubMed.
- M. C. Kim, J. J. Gillissen, S. R. Tabaei, V. P. Zhdanov and N.-J. Cho, Phys. Chem. Chem. Phys., 2015, 17, 31145–31151 RSC.
- V. G. Levich, Physicochemical Hydrodynamics, Prentice Hall, 1962 Search PubMed.
- J. A. Jackman, V. P. Zhdanov and N.-J. Cho, Langmuir, 2014, 30, 9494–9503 CrossRef CAS PubMed.
- R. B. Bird, E. N. Lightfoot and E. W. Stewart, Transport Phenomena, Wiley, 2007 Search PubMed.
- M. Rodahl, F. Hook, A. Krozer, P. Brzezinski and B. Kasemo, Rev. Sci. Instrum., 1995, 66, 3924–3930 CrossRef CAS.
- K. Pratt and W. Wakeham, Proc. R. Soc. London, Ser. A, 1975, 342, 401–419 CrossRef CAS.
- N.-J. Cho, C. W. Frank, B. Kasemo and F. Höök, Nat. Protoc., 2010, 5, 1096–1106 CrossRef CAS PubMed.
- G. Z. Sauerbrey, Z. Phys, 1959, 155, 206–222 CrossRef CAS.
- D. Johannsmann, The Quartz Crystal Microbalance in Soft Matter Research: Fundamentals and Modeling, Springer, 2014 Search PubMed.
- J. T. Edward, J. Chem. Educ., 1970, 47, 261 CrossRef CAS.
- P. Mijnlieff and R. Ditmarsch, Nature, 1965, 208, 889–891 CrossRef CAS.
| This journal is © the Owner Societies 2016 |