 Open Access Article
C-type related order in the defective fluorites La2Ce2O7 and Nd2Ce2O7 studied by neutron scattering and ab initio MD simulations
Liv-Elisif
Kalland
*a,
Stefan T.
Norberg
bc,
Jakob
Kyrklund
d,
Stephen
Hull
c,
Sten G.
Eriksson
b,
Truls
Norby
a,
Chris E.
Mohn
*ae and
Christopher S.
Knee†
b
aCentre for Materials Science and Nanotechnology, Department of Chemistry, University of Oslo, FERMiO, Gaustadalléen 21, NO-0349 Oslo, Norway. E-mail: l.e.kalland@smn.uio.no; c.e.mohn@geo.uio.no
bDepartment of Chemistry and Chemical Engineering, Chalmers University of Technology, SE-412 96 Gothenburg, Sweden
cThe ISIS Facility, STFC Rutherford Appleton Laboratory, Chilton, Didcot, OX11 0QX, UK
dDepartment of Chemistry, University of Gothenburg, SE-405 30 Gothenburg, Sweden
eCenter for Earth Evolution and Dynamics, University of Oslo, NO-0371 Oslo, Norway
First published on 5th August 2016
Abstract
This work presents a structural investigation of La2−xNdxCe2O7 (x = 0.0, 0.5, 1.0, 1.5, 2.0) using X-ray powder diffraction and total scattering neutron powder diffraction, analysed using Rietveld and the reverse Monte Carlo method (RMC). Ab initio molecular dynamics (MD) modelling is also performed for further investigations of the local order. The main intensities in the neutron diffraction data for the La2−xNdxCe2O7 series correspond to the fluorite structure. However, additional C-type superlattice peaks are visible for x > 0 and increase in intensity with increasing x. The Nd-containing compositions (x > 0) are best fitted with Rietveld analysis by using a combination of oxygen deficient fluorite and oxygen excess C-type structures. No indications of cation order are found in the RMC or Rietveld analysis, and the absence of cation order is supported by the MD modelling. We argue that the superlattice peaks originate from oxygen vacancy ordering and associated shift in the cation position away from the ideal fluorite site similar to that in the C-type structure, which is seen from the Rietveld refinements and the observed ordering in the MD modelling. The vacancies favour alignments in the 〈110〉, 〈111〉 and especially the 〈210〉 direction. Moreover, we find that such ordering might also be found to a small extent in La2Ce2O7, explaining the discernible modulated background between the fluorite peaks. The observed overlap of the main Bragg peaks between the fluorite and C-type phase supports the co-existence of vacancy ordered and more disordered domains. This is further supported by the observed similarity of the radial distribution functions as modelled with MD. The increase in long range oxygen vacancy order with increasing Nd-content in La2−xNdxCe2O7 corresponds well with the lower oxide ion conductivity in Nd2Ce2O7 compared to La2Ce2O7 reported earlier.
1 Introduction
Rare earth doped ceria has a variety of applications within oxygen sensors, solid oxide fuel cells (SOFCs) and catalysis. The electrochemical properties and structure of doped ceria are studied with as much interest now1–4 as a couple of decades ago.5–8 The reduction and oxidation properties of ceria, its structural stability to changes in cation–oxygen stoichiometries and its ability to accommodate high concentrations of aliovalent dopants, make this compound highly versatile as an oxide ion conductor. However, at doping levels above ∼15–20 mole% the ionic conductivity decreases.8,9 Changes in the degree of local ordering, or clustering, are often suggested to rationalize the variations in the conducting properties with composition.9–11 Identifying the underlying atomic structure is consequently essential to explain these macroscopic properties.Ceria (CeO2) possesses the perfect fluorite structure (space group Fm![[3 with combining macron]](https://www.rsc.org/images/entities/char_0033_0304.gif) m) with both of the Wyckoff sites 4a and 8c being fully occupied (see Fig. 1b), and exhibits high solubility of C-type structured rare earth sesquioxides RO1.5 (space group Ia
m) with both of the Wyckoff sites 4a and 8c being fully occupied (see Fig. 1b), and exhibits high solubility of C-type structured rare earth sesquioxides RO1.5 (space group Ia![[3 with combining macron]](https://www.rsc.org/images/entities/char_0033_0304.gif) , e.g. Y2O3, see Fig. 1a). Fluorite structured oxides were commonly believed to exhibit a third nearest neighbour ordering of the oxygen vacancies (i.e. 〈111〉 alignment within the oxygen cube around a cation‡) when sufficiently oxygen deficient.12,13 This is indeed the case for CeO2−δ when δ > 0.3,14 and such local vacancy ordering explains the significant decrease in oxide ion conductivity.11,15 However, a former detailed analysis of the superstructure observed for CeO2 doped with ∼50 mole% YO1.5 suggests that vacancy ordering exclusively in the 〈111〉 direction is not always the situation, and it is necessary to also consider other ordering possibilities.6
, e.g. Y2O3, see Fig. 1a). Fluorite structured oxides were commonly believed to exhibit a third nearest neighbour ordering of the oxygen vacancies (i.e. 〈111〉 alignment within the oxygen cube around a cation‡) when sufficiently oxygen deficient.12,13 This is indeed the case for CeO2−δ when δ > 0.3,14 and such local vacancy ordering explains the significant decrease in oxide ion conductivity.11,15 However, a former detailed analysis of the superstructure observed for CeO2 doped with ∼50 mole% YO1.5 suggests that vacancy ordering exclusively in the 〈111〉 direction is not always the situation, and it is necessary to also consider other ordering possibilities.6
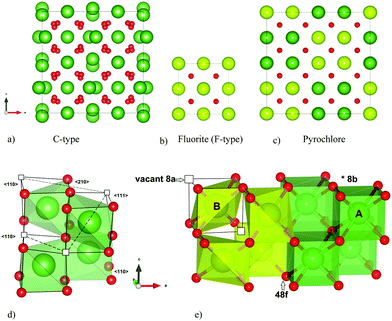 | ||
| Fig. 1 The (a) C-type and (c) P-type (pyrochlore) compared to the parent structure (b) F-type (perfect fluorite). Coordination polyhedron and vacancy alignment 〈111〉, 〈110〉 and 〈210〉 in C-type (d), and (e) 〈111〉 in pyrochlore. All crystal structures are drawn with VESTA.42 | ||
In this study we focus on two ceria-based systems, La2Ce2O7 and Nd2Ce2O7, and their intermediate phases (La2−xNdxCe2O7). La2O3 and Nd2O3 possess the hexagonal A-type structure, rather than the cubic C-type structure. Nonetheless, when ceria is doped with La2O3 and Nd2O3 the trends in conductivity and lattice parameter due to doping levels are similar as when ceria is doped with C-type sesquioxides.9,10,16 La2Ce2O7 and Nd2Ce2O7 are proposed as systems on the verge of transitioning into more ordered superstructures of the perfect fluorite structure; the pyrochlore and C-type structure respectively (see Fig. 1a–c). La2Ce2O7 is most often reported as a disordered fluorite,17–20 although a pyrochlore structure (A2B2O7, space group Fd![[3 with combining macron]](https://www.rsc.org/images/entities/char_0033_0304.gif) m) has also been advocated.21 Nd2Ce2O7 is reported as a more long range ordered system where C-type supercell diffraction patterns are observed.9,17 Long range order will affect the conductivity properties of the compositions. The ionic conductivity is lower in Nd2Ce2O7 compared to La2Ce2O719,22 and we expect a decreasing oxygen ion conductivity with increasing Nd-content in La2−xNdxCe2O7. Thus, a structural investigation of these systems can further elucidate the ordering mechanism for heavily doped ceria, as well as the effect of the average dopant size, and link variations in ionic conductivity to structural changes.
m) has also been advocated.21 Nd2Ce2O7 is reported as a more long range ordered system where C-type supercell diffraction patterns are observed.9,17 Long range order will affect the conductivity properties of the compositions. The ionic conductivity is lower in Nd2Ce2O7 compared to La2Ce2O719,22 and we expect a decreasing oxygen ion conductivity with increasing Nd-content in La2−xNdxCe2O7. Thus, a structural investigation of these systems can further elucidate the ordering mechanism for heavily doped ceria, as well as the effect of the average dopant size, and link variations in ionic conductivity to structural changes.
This work is part of a larger investigation, relating structure to hydration and conductivity properties, and the principal objective of this study is to capture local changes in the ordering patterns when going from La2Ce2O7 with a disordered fluorite structure, to Nd2Ce2O7 where superlattice diffraction peaks are observed. Both long and short range crystal structure of five different compositions of La2−xNdxCe2O7 are studied (x = 0.0, 0.5, 1.0, 1.5, 2.0). The Rietveld method is used to analyse the long range order observed with powder X-ray diffraction (PXRD) and powder neutron diffraction (NPD) data. The local order is investigated with a reverse Monte Carlo (RMC) method to analyse both the Bragg and diffuse intensities based on the scattering factor S(Q) and the real space radial distribution function G(r) obtained by total scattering NPD. To further look at possible local order and investigate the preferred oxygen vacancy clustering, ab initio molecular dynamics (MD) modelling studies are performed.
2 Experimental and computational details
2.1 Synthesis
La2−xNdxCe2O7 compositions in the range x = 0.0, 0.5, 1.0, 1.5 and 2.0 were prepared via solid state reaction of stoichiometric amounts of La2O3, Nd2O3 (both 99.99% Sigma Aldrich) and CeO2 (99.9% Alfa Aesar). The reactants were dried at 800 °C prior to weighing and mixed under ethanol using an agate-mortar and pestle. The powders were then heated in high density and purity alumina crucibles at 1050 °C for 20 h, and subsequently at 1200 °C and 1300 °C for 8 h durations with re-grinding steps. The samples were then pressed into pellets (9/8 inch diameter) under a load of 20 tons and heated to 1400 °C for 8 h and subsequently grinded. This step was repeated three times, with the final heating time extended to 16 h, to yield phase pure samples as judged by Rietveld analysis of long scan PXRD data.2.2 Structural characterisation
The long scan PXRD data were collected on a Bruker D8 Advance operating with Cu Kα1 radiation in the 2θ range 19° to 100° with a step size of 0.009° and count time of 4 s per step. The five samples were placed into thin walled vanadium cans of 8 mm diameter and loaded into a sample changer, along with an empty vanadium can for background correction. The neutron diffraction data was collected at room temperature on the newly upgraded Polaris diffractometer of the ISIS facility, Rutherford Appleton Laboratory, U.K., using the backscattering detector bank covering angles of (135° < 2θ < 167°), the 90° detector bank (75° < 2θ < 113°), and the two low angle detector banks (40° < 2θ < 66°) and (19° < 2θ < 34°), respectively. These cover a total range of 0.2–60 Å−1 for the scattering vector Q (where Q = 2π/d and d is the interplanar spacing). The measurements took approximately 6 hours in order to obtain counting statistics of sufficient statistical quality to allow analysis of the total scattering. The PXRD data and NPD data from the 90° detector (bank 4, providing the optimum balance of resolution and wide d-spacing range to cover all main reflections from the phases), were analysed with the Rietveld23 method using the GSAS program.24The NPD data from each detector bank were merged to form a single spectrum covering a wide Q range using the program Gudrun,25 after background scattering and beam attenuation correction. This process puts the scattered intensity onto an absolute scale of scattering cross-section. The resultant normalized total scattering structure factor, S(Q), was used to generate the corresponding total radial distribution function, G(r), via a Fourier transform (for details, see Keen26).
The G(r) can also be expressed as the sum of the individual partial radial distribution functions, gij(r), weighted by cicj![[b with combining macron]](https://www.rsc.org/images/entities/i_char_0062_0304.gif) i
i![[b with combining macron]](https://www.rsc.org/images/entities/i_char_0062_0304.gif) j, where ci and
j, where ci and ![[b with combining macron]](https://www.rsc.org/images/entities/i_char_0062_0304.gif) i are the concentration and the coherently bound neutron scattering lengths, respectively, for the species i. The partial radial distribution function can be extracted from the RMC modelling results, and is, in turn, given by
i are the concentration and the coherently bound neutron scattering lengths, respectively, for the species i. The partial radial distribution function can be extracted from the RMC modelling results, and is, in turn, given by
 | (1) |
RMC modelling of the neutron total scattering data was performed using the RMCProfile software.27 A bond valence sum (BVS) soft constraint28 was used to ensure that individual cation–anion coordination environments remain chemically reasonable, with parameters taken from Brese and O'Keefe.29 The RMC modelling used both reciprocal space data, S(Q), and real space data, G(r). The former emphasises the long-range ordering, while the G(r) focuses on the short-range interactions. Additionally, the S(Q) used for RMC modelling is broadened by convolution with a box function to reflect the finite size of the configuration box (for details, see Tucker et al.27). An 8 × 8 × 8 fluorite supercell was used as the initial atomic configuration for La2−xNdxCe2O7 with x = 0, 0.5 and 1, with the vacancies and cations randomly distributed. For the more Nd-containing systems, x = 1.5 and 2.0, a 4 × 4 × 4 C-type supercell with oxygen excess and randomly distributed cations was used. To test cation clustering preference a second set of modelling (RMC2) was performed on the end members La2Ce2O7 and Nd2Ce2O7, with the same initial configuration as previously mentioned, where cation swapping was allowed. Also the pyrochlore structure was tested as an initial configuration in a third set of RMC modelling (RMC3). Finally, a total of 10 RMC runs were performed to improve the statistical significance of extracted results, using the fitted configuration but with different seeds for the random number generator.
2.3 Ab initio molecular dynamics
Ab initio Born–Oppenheimer molecular dynamics was carried out within the NVT ensemble, with a step length of 2 fs, to investigate the local nature of different possible configurations. The temperature was controlled by a Nosé thermostat.30,31 Only the end members, La2Ce2O7 and Nd2Ce2O7, were studied in detail using a careful selection of representative start configurations as described below. The structure, such as the partial radial distribution functions g(r), was analysed by sampling many configurations during the MD run. From the g(r)s we calculate the neutron weighted total G(r). Since there is no ionic migration occurring in MD runs at 300 K, we obtain the G(r) resulting from the atomic positions for a fixed configuration of cations and oxygen and the dynamic vibrations similar to the experimental conditions from 10 ps long runs. Comparison of the obtained G(r) gives us insight into the influence of different configurations on vibrational properties. The sampled configurations are studied using PLATON32 to extract atomic distances and other relevant crystallographic data.To collect sufficient statistics on coordination numbers and preferred vacancy orientation, MD runs at 1500 K have also been carried out. At this temperature the oxygen are migrating in the structure during the MD run, and several configurations of the oxygen lattice were sampled. Four different starting configurations with randomly distributed cations were used, giving statistics from a total of 0.64 ns after 0.04 ns of equilibration, for each composition (50 ps long MD runs were also performed on 3 × 3 × 3 super cells). The location of the vacant oxygen sites was sampled to analyse the vacancy–vacancy (vac–vac) distribution in terms of distance and direction. The latter analysis has been done by dividing the whole simulation cell into space filling cubic boxes where each box contains one of the initial oxygen sites (i.e. the 8c position in Fm![[3 with combining macron]](https://www.rsc.org/images/entities/char_0033_0304.gif) m). The vacant boxes and the distribution of vac–vac pairs from each box aligned in 〈100〉, 〈110〉, 〈111〉, 〈200〉, 〈210〉, 〈211〉 or 〈220〉 manner, are then identified. This resembles a pair distribution function with discrete distances for each type of pairs.
m). The vacant boxes and the distribution of vac–vac pairs from each box aligned in 〈100〉, 〈110〉, 〈111〉, 〈200〉, 〈210〉, 〈211〉 or 〈220〉 manner, are then identified. This resembles a pair distribution function with discrete distances for each type of pairs.
All MD runs were performed using the projector augmented wave (PAW)33 method as implemented in the VASP code.34 The generalized gradient approximation functional by Perdew, Burke and Ernzerhof (GGA-PBE)35 was employed using a plane wave cut-off energy at 400 eV, and only the gamma point to sample the Brillouin zone. All MD runs have been performed at constant volume with a 2 × 2 × 2 supercell (N = 88) of the cubic fluorite structure, which is equivalent to the size of a single unit cell of pyrochlore or C-type structure, using the cell parameters obtained experimentally from initial X-ray Rietveld refinements (i.e., asupercell = 2 × afluorite = 11.1325 Å for La2Ce2O7 and asupercell = 10.9639 Å for Nd2Ce2O7). To investigate the possible limitations due to the cell size, 3 × 3 × 3 supercells with randomly distributed atoms within the fluorite structure were also used.
The start configurations chosen for the MD runs were based on those suggested in literature, random distribution configurations, and low energy configurations found within the static limit from full structural optimization. The configurations are described as combinations of different possible cation and anion sub-lattices. The cation sub-lattices were either exhibiting a random distribution, or a pyrochlore order. These cation sub-lattices were thereafter combined with an oxygen lattice with the 56 oxygen atoms randomly distributed on the 8c site. Two types of oxygen order were also tried; (1) one order in a manner similar to the C-type, and (2) an order proposed by Withers et al.6 The first ordering scheme is related to the C-type structure where 8 of the positions equal to the 16c are vacant such that every second plane in the [001] direction has 4 vacant positions (see Fig. 2). This distribution results in a combination of 〈110〉 and 〈210〉 alignments between vacancies, but zero 〈111〉 alignments, which also would be present in the perfect C-type structure. The second ordered arrangement is based on a tetragonal structure proposed by Withers et al. after TEM investigations, and the vacancies are ordered in a 〈210〉 manner in combination with 〈200〉 and 〈220〉 when translated into a cubic fluorite supercell.6 For La2Ce2O7 the perfect pyrochlore structure has also been tried.
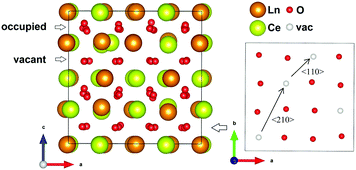 | ||
| Fig. 2 Showing the order in the oxygen sub-lattice for one of the two (004) planes with vacant 16c positions in the chosen ordered oxygen configuration related to the C-type structure. | ||
3 Results and discussion
3.1 Rietveld refinement based on XRD and ND – long range order
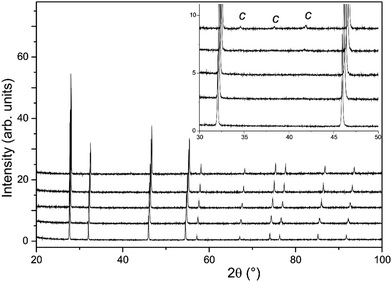
The long scan PXRD data were analysed using the Rietveld method with the oxygen deficient, disordered fluorite structure (space group Fm![[3 with combining macron]](https://www.rsc.org/images/entities/char_0033_0304.gif) m) previously reported for La2Ce2O719 as the input for the initial model. This provided an adequate fit to the data sets, however, for the x ≥ 1.5 samples, additional weak reflections consistent with a C-type structure (space group Ia
m) previously reported for La2Ce2O719 as the input for the initial model. This provided an adequate fit to the data sets, however, for the x ≥ 1.5 samples, additional weak reflections consistent with a C-type structure (space group Ia![[3 with combining macron]](https://www.rsc.org/images/entities/char_0033_0304.gif) ) were apparent (see Fig. 3). The oxygen excess C-type structure reported for Gd1−xCexO1.5+x/236 modified to give the correct Nd to Ce ratio was therefore used as the starting point for an analysis of Nd2Ce2O7 that provided a satisfactory fit to the data set.
) were apparent (see Fig. 3). The oxygen excess C-type structure reported for Gd1−xCexO1.5+x/236 modified to give the correct Nd to Ce ratio was therefore used as the starting point for an analysis of Nd2Ce2O7 that provided a satisfactory fit to the data set.
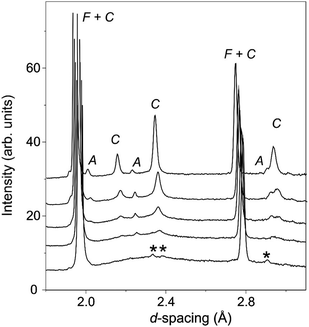
In contrast with the PXRD data, the neutron patterns revealed the emergence of the C-type supercell peaks occurring for lower x in La2−xNdxCe2O7. As shown in Fig. 4, supercell intensity is apparent for x ≥ 0.5, and the peaks associated with the doubled unit cell grow strongly with increasing Nd-content. Given the much greater sensitivity of the neutron diffraction data to the oxygen ion sub-lattice compared to the PXRD data, the following detailed structural investigations will focus exclusively on these data. Analysis of the neutron diffraction data proceeded using the models obtained from the PXRD as input with an initial focus on the end members La2Ce2O7 and Nd2Ce2O7.
The La2Ce2O7 PND data was analysed successfully based on the disordered fluorite structure, with Fm![[3 with combining macron]](https://www.rsc.org/images/entities/char_0033_0304.gif) m symmetry, consistent with all previous neutron diffraction studies.19,20,37 Refinement of the oxygen site occupancy yielded a value of 0.875(3) consistent with the nominal value 0.875, and the average structure of La2Ce2O7 is best described as a cation disordered, oxygen deficient fluorite. In particular, no evidence for a pyrochlore superstructure characterised by perfectly ordered La and Ce positions that was predicted by DFT simulations of VanPoucke et al.21 was found.
m symmetry, consistent with all previous neutron diffraction studies.19,20,37 Refinement of the oxygen site occupancy yielded a value of 0.875(3) consistent with the nominal value 0.875, and the average structure of La2Ce2O7 is best described as a cation disordered, oxygen deficient fluorite. In particular, no evidence for a pyrochlore superstructure characterised by perfectly ordered La and Ce positions that was predicted by DFT simulations of VanPoucke et al.21 was found.
As noted previously19,20 the neutron diffraction pattern of La2Ce2O7 displayed a strongly modulated background as seen in Fig. 4, indicative of significant deviations from the long range average structure determined from fitting of the Bragg diffraction intensities. The amplitude of the modulated background increased with the amount of La in La2−xNdxCe2O7, and the broad humps were situated in the same region as the obtained C-type peaks which were diminishing. We therefore argue that the local structure of La2Ce2O7 and the Nd-containing systems are similar and that therefore any ordering is likely to be of the same kind in the two compositions – the only difference being that in Nd-containing systems the ordering tendency is more profound and the atoms crystallize in domains or phases to a larger extent producing well defined Bragg peaks (i.e. the incipient local order in La2Ce2O7 is similar to ordering in Nd2Ce2O7).
The modulated background was modelled using the shifted Chebyshev background function with the maximum number of 36 variables, and a close inspection of the diffraction pattern revealed very weak additional peaks in the d-spacing range 2–3 Å as is apparent in Fig. 4. These were found to originate from a silicate based apatite phase with an approximate composition of La9.33(SiO4)6O238 introduced from reaction of La2O3 and the agate material of the mortar and pestle used during the synthesis process. This phase also accounts for the peak seen in the long scan PXRD data at 2θ ≈ 30.5° (Fig. 3). The phase was introduced into the Rietveld refinement and a refined content of 0.05 wt% was obtained, and we are therefore confident that it has a negligible influence on the stoichiometry of the disordered fluorite.
The diffraction pattern from Nd2Ce2O7 was initially analysed with the oxygen excess C-type structure with the additional oxide ion, located at the 16c site (Ia![[3 with combining macron]](https://www.rsc.org/images/entities/char_0033_0304.gif) space group) and the cations statistically disordered over the 24d and 8b sites as suggested by Grover et al.36 This produced a moderate quality fit to the data, with significant discrepancies between the calculated and observed intensities; in particular the relatively weak supercell reflections associated with the doubled fluorite cell were overestimated. Therefore, a two phase approach with the oxygen excess C-type and disordered fluorite phases was introduced, and a significant improvement to the agreement factors resulted with an approx. 50
space group) and the cations statistically disordered over the 24d and 8b sites as suggested by Grover et al.36 This produced a moderate quality fit to the data, with significant discrepancies between the calculated and observed intensities; in particular the relatively weak supercell reflections associated with the doubled fluorite cell were overestimated. Therefore, a two phase approach with the oxygen excess C-type and disordered fluorite phases was introduced, and a significant improvement to the agreement factors resulted with an approx. 50![[thin space (1/6-em)]](https://www.rsc.org/images/entities/char_2009.gif) :
:![[thin space (1/6-em)]](https://www.rsc.org/images/entities/char_2009.gif) 50 distribution of the fluorite and C-type phase as judged by the refined weight fractions. Both phases contribute to the main intensity (fluorite 200, 220… etc.) and this leads to a high degree of correlation between the parameters. Nonetheless, through careful refinement it was possible to introduce the atomic variables from each phase, with particularly significant improvements in the fit associated with modelling the displacements of the 24d cation and 48e and 16c oxygen sites in the C-type structure.
50 distribution of the fluorite and C-type phase as judged by the refined weight fractions. Both phases contribute to the main intensity (fluorite 200, 220… etc.) and this leads to a high degree of correlation between the parameters. Nonetheless, through careful refinement it was possible to introduce the atomic variables from each phase, with particularly significant improvements in the fit associated with modelling the displacements of the 24d cation and 48e and 16c oxygen sites in the C-type structure.
Furthermore, the possibility of cation ordering was investigated by setting the extremes of the 8b site being occupied either completely by Nd or Ce ions with the occupancy of the 24d site adjusted to retain an overall 1![[thin space (1/6-em)]](https://www.rsc.org/images/entities/char_2009.gif) :
:![[thin space (1/6-em)]](https://www.rsc.org/images/entities/char_2009.gif) 1 ratio of Nd and Ce, but this produced no evidence of long range cation ordering. Moreover, no significant deviation between the cation stoichiometry of the C-type related and disordered fluorite components were apparent from the Rietveld analysis.
1 ratio of Nd and Ce, but this produced no evidence of long range cation ordering. Moreover, no significant deviation between the cation stoichiometry of the C-type related and disordered fluorite components were apparent from the Rietveld analysis.
Tests were also carried out to probe the most favourable location of the oxygen vacancy within the C-type structure, and a strong preference for deficiency on the 16c site was obtained. In particular the 321 reflection at d-spacing 2.9 Å was found to be sensitive to the occupation factor, n, of this position. Simultaneous refinement of n and the atomic displacement parameter (ADP) yielded a reduction to an approximate 0.4 occupancy that, combined with the full occupancy of the 48f site, would result in a significant deficiency, e.g. δ ≈ 0.2 for Nd2Ce2O7−δ. Given the high degree of correlation between n and the ADP, the occupancy factor was therefore set to 0.5 in the final cycles in order to preserve the expected O7 stoichiometry.
From Fig. 4 it is clear that the relative intensities of the C-type peaks present in the intermediate compositions are more or less invariant, and we therefore judged that the type of oxygen vacancy order is also constant in the C-type related phase present in the La2−xNdxCe2O7 samples where 0.5 ≤ x ≤ 1.5. This was confirmed by the refinements of these samples which preceded using a statistical distribution of the three cationic species at the available cation positions. Given both the previously noted degree of correlation between the atomic parameters in the fluorite and C-type related phases, and the rapid decay of the C-type related phase with increasing lanthanum content, it was only possible to fully refine all atomic parameters of the C-type phase for the x = 1.5 and 2.0 data sets. For the x ≤ 1.0 samples the ADPs of all sites in the C-type phase were set equal to unity. For the sake of completeness the minor Nd2O3 component (hexagonal A-type fluorite structure) present in all the Nd-containing samples was also modelled. Refinement of the data results in a content of 0.002–0.004 wt% of Nd2O3, which is too small to significantly impact the main phase compositions.
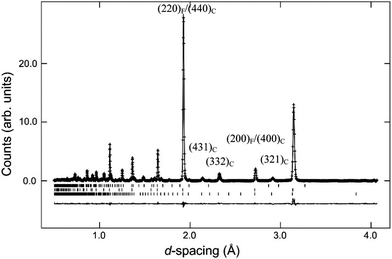
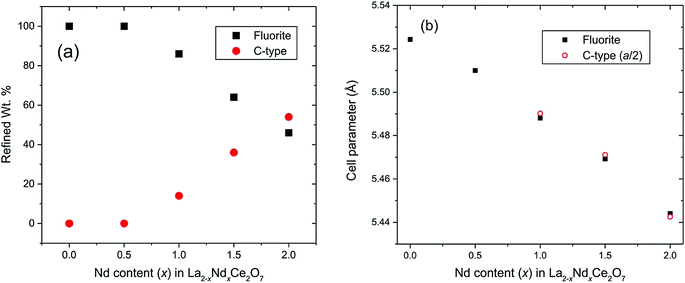
The refined structural parameters obtained from the Rietveld analyses are presented in Table 1. Fig. 5 shows the final Rietveld fit of the Nd2Ce2O7 data. Note that the high χ2 factors listed in Table 1 reflect the imperfect modelling of the modulated backgrounds and the quality of fit to the Bragg diffraction intensities is good as judged by the Rwp factors. The composition of the samples, extracted from the refined phase fractions of the fluorite and C-type phases, is presented in Fig. 6a, and the evolving cell parameters of the La2−xNdxCe2O7 series are shown in Fig. 6b.
| La2Ce2O7 | La1.5Nd0.5Ce2O7 | LaNdCe2O7 | La0.5Nd1.5Ce2O7 | Nd2Ce2O7 | |
|---|---|---|---|---|---|
| a ADP was not possible to refine. b In all cases a decrease in occupancy factor n was obtained and to maintain overall oxygen stoichiometry n was fixed at 0.5. | |||||
| Fluorite phase | |||||
| Ln/Ce(1) 4a (0, 0, 0) | |||||
| U iso × 100 (Å2) | 1.905(14) | 1.75(2) | 1.98(3) | 2.06(6) | 2.07(9) |
| O(1) 8c (1/4, 1/4, 1/4) | |||||
| U iso × 100 (Å2) | 3.88(2) | 3.71(2) | 3.96(5) | 3.88(9) | 3.89(13) |
| Occupancy, n | 0.875(3) | 0.864(3) | 0.874(4) | 0.876(6) | 0.863(10) |
| a (Å) | 5.52429(3) | 5.51031(8) | 5.48810(6) | 5.4693(1) | 5.4437(2) |
| Wt% | 100 | 94.3(1) | 80.1(3) | 73.4(4) | 41.6(8) |
| C-type related phase | |||||
| Ln/Ce(1) 8b (1/4, 1/4, 1/4) | |||||
| U iso × 100 (Å2) | — | 1.0a | 1.0a | 1.8(4) | 1.64(20) |
| Ln/Ce(2) 24d (x, 0, 1/4) | |||||
| x | — | −0.0215(18) | −0.0208(8) | −0.0194(6) | −0.0187(3) |
| U iso × 100 (Å2) | — | 1.0a | 1.0a | 0.25(8) | 0.63(6) |
| O(1) 48e (x, y, z) | |||||
| x | — | 0.3819 | 0.3834(6) | 0.3837(4) | 0.3825(3) |
| y | — | 0.1422 | 0.1392(6) | 0.1404(5) | 0.1415(3) |
| z | — | 0.3821 | 0.3836(5) | 0.3829(4) | 0.3821(2) |
| U iso × 100 (Å2) | — | 1.0a | 1.0a | 0.90(9) | 1.15(6) |
| Occupancy, n | — | 1.0 | 1.0 | 1.0 | 1.0 |
| O(2) 16c (x, x, x) | |||||
| x | — | 0.3842 | 0.3838(13) | 0.3852(10) | 0.3848(6) |
| U iso × 100 (Å2) | — | 1.0a | 1.0a | 1.3(3) | 1.4(2) |
| Occupancy, n | — | 0.5b | 0.5b | 0.5b | 0.5b |
| Wt% | 0.0 | 5.6(9) | 19.6(7) | 26.2(7) | 58.1(5) |
| a (Å) | — | 11.017(2) | 10.9814(8) | 10.9441(5) | 10.8853(3) |
| R wp (%) | 2.52 | 3.02 | 3.30 | 3.15 | 3.21 |
| χ 2 | 31.47 | 93.25 | 48.22 | 65.99 | 53.78 |
| Variables | 46 | 46 | 54 | 57 | 60 |
3.2 Radial distribution functions – short range ordering
The total radial distribution functions, G(r), obtained experimentally for the different compositions of La2−xNdxCe2O7 are strikingly similar, as seen in Fig. 7. The peaks become slightly sharper when moving from La2Ce2O7 to Nd2Ce2O7 (see indent in Fig. 7), which could be interpreted as increasing configurational order or stiffer bonds. In addition, the peak positions are moved to lower r values due to the decreasing lattice parameter.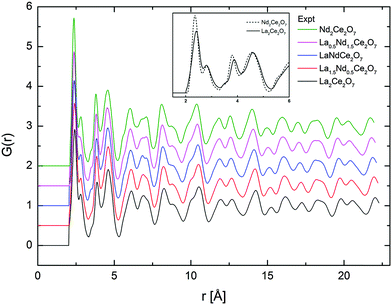 | ||
| Fig. 7 G(r) obtained from total scattering neutron diffraction for all compositions and for the two end-members at short r in inset. | ||
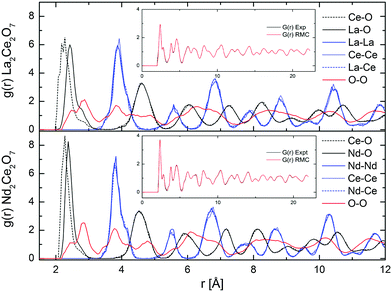 | ||
| Fig. 8 Partial g(r) from RMC (RMC set 1), and comparison of G(r) from experimental NPD results and RMC fit (in inset), for La2Ce2O7 and Nd2Ce2O7. | ||
| Data set | CN La | CN Nd | CN Ce |
|---|---|---|---|
| La2Ce2O7 | |||
| RMC1 | 7.12 | 7.02 | |
| RMC2 | 6.83 | 7.32 | |
| RMC3 | 7.09 | 7.04 | |
| MD | 6.92 | 6.89 | |
| La1.5Nd0.5Ce2O7 | |||
| RMC1 | 7.02 | 7.02 | 7.02 |
| RMC3 | 6.99 | 6.98 | 7.05 |
| LaNdCe2O7 | |||
| RMC1 | 6.97 | 7.06 | 7.13 |
| RMC3 | 6.83 | 6.93 | 7.31 |
| La0.5Nd1.5Ce2O7 | |||
| RMC1 | 6.99 | 6.98 | 7.08 |
| RMC3 | 6.90 | 6.93 | 7.16 |
| Nd2Ce2O7 | |||
| RMC1 | 7.07 | 7.05 | |
| RMC2 | 6.77 | 7.34 | |
| RMC3 | 6.98 | 7.18 | |
| MD | 6.97 | 6.91 | |
The partial distribution functions, gij(r), for the two end members La2Ce2O7 and Nd2Ce2O7 are shown in Fig. 8. Here we see that the difference between the Ln(La/Nd)–O and Ce–O distance is smaller in Nd2Ce2O7 since the ionic radii of Ln and Ce become more equal,40 and thus the lattice strain decreases. When comparing the end members the first partial gLn/Ce–O(r) and gO–O(r) peaks are broader in the La2Ce2O7 system, pointing to either larger amplitudes of vibration in La2Ce2O7 or more spread out oxygen positions and varying bond lengths between cations and oxygen compared to Nd2Ce2O7. The partial gO–O(r)s has a shoulder on the first peak in both La2Ce2O7 and Nd2Ce2O7, at around 2.5 Å, which could indicate that a fraction of the oxygen is more strongly correlated. However, the MD modelling does not support a structural model containing these split O–O as we will see later.
None of the RMC results showed any particular tendency for ordering within the sub-lattices for any of the systems. However, it is worth bearing in mind that RMC tends to give the most disordered configuration that is consistent with the experimental data as it is a Monte Carlo method. If there are only domains exhibiting ordering, the PND data might contains insufficient information for the RMC to capture any local ordering. However, an important observation, is that the peaks in the partial g(r)s become sharper when moving from La2Ce2O7 to Nd2Ce2O7, and this is either due to decreasing dynamic vibrations or static disorder. The latter is best described as more localised atom positions. Consequently we turn to MD modelling to investigate possible configurations that could result in similar G(r) profiles.
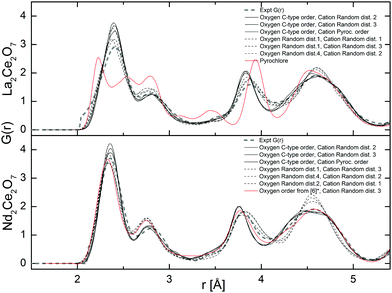 | ||
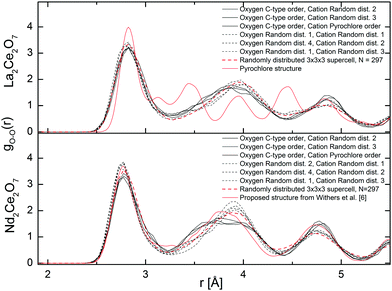
Fig. 9 Total neutron weighted G(r) resulting from the MD runs at 300 K compared with the experimental results. *![[thin space (1/6-em)]](https://www.rsc.org/images/entities/char_2009.gif) In ref. 6 a tetragonal structure is proposed with a 〈210〉 vacancy ordering and the symmetry has been translated into a cubic symmetry for a more direct comparison. In ref. 6 a tetragonal structure is proposed with a 〈210〉 vacancy ordering and the symmetry has been translated into a cubic symmetry for a more direct comparison. | ||
The broadening of the G(r) peaks for La2Ce2O7 compared to Nd2Ce2O7 as found experimentally is also reproduced in the G(r) from MD. Regardless of the choice of starting cation and anion configuration for both La2Ce2O7 and Nd2Ce2O7 the G(r)s are strikingly similar. There are, nevertheless, some small deviations between the configurations containing a randomly distributed oxygen sub-lattice, as indicated by RMC, compared to ordered oxygen configurations termed C-type ordering (see description in Section 2.3) which is an ordered oxygen excess C-type configuration.
In Fig. 9 we see that some of the peaks are either broadened or sharpened when comparing the ordered and random oxygen configurations, especially in the Nd2Ce2O system. The peak around 3.8 Å is broader and somewhat shifted to higher distance by around 0.1 Å for the disordered oxygen configurations, and the peak at ∼4.5 Å, which is dominated by cation–oxygen distances, is sharper when comparing with the ordered excess C-type configurations. Overall, the C-type related ordered oxygen configurations are more consistent with the experimental results for Nd2Ce2O7 except around r ∼ 3.8 Å, than the random oxygen configurations. The oxygen configuration containing a second type of ordering (proposed by Withers et al. in ref. 6) is also plotted for the Nd2Ce2O7 system and resemble the random oxygen configurations at the shortest distances (r < 3.5) whereas they are closer to the C-type ordered configurations at longer distances (r > 3.5 Å). Although the same features and deviations are seen for the La2Ce2O7 system, there is overall less deviation between ordered and random oxygen structures.
The partial distribution functions extracted from MD are in good agreement with those extracted from RMC with only some small deviations in the gO–O(r). The gO–O(r), from MD are plotted in Fig. 10 and show three well defined peaks corresponding to the 〈100〉, 〈110〉, and 〈111〉 alignments between the oxygen around the cations at approx. 2.8, 3.8, and 4.8 Å, respectively. The MD results appear more ordered than the gO–O(r) from RMC (Fig. 8), since the latter flattens out at higher r, especially in La2Ce2O7. The shoulder at ∼2.5 Å found with RMC, is not seen in the MD results. The discrepancy can be explained by the modest cell size used in MD or uncertainties in the RMC result at short distances. Therefore, we also plot the results for a 3 × 3 × 3 supercell in Fig. 10, where the atoms are distributed randomly to see how the cell size might influence the gO–O(r) and hopefully understand the deviation between RMC and MD. The disordered 3 × 3 × 3 supercell reproduces the gO–O(r) from the 2 × 2 × 2 supercell, suggesting that the RMC analysis is hampered by the presence of some artificial feature at the short O–O distances around 2.5 Å.
As for the total pair distribution functions from MD, there are also deviations between the ordered and the randomly distributed oxygen lattices, and the deviations are more visible for Nd2Ce2O7. Although the random oxygen configurations are in better agreement with the RMC results around 4.8 Å (Fig. 10), the second peak at ∼3.8 Å corresponding to 〈110〉 alignment between oxygen, is clearly shifted to a higher r of about 0.2 Å when comparing with RMC, especially for Nd2Ce2O7. The peak positions in the ordered oxygen configurations (i.e. denoted as C-type order in Fig. 9 and 10) in Nd2Ce2O7 have an overall better agreement with the RMC results. Note that this ordered oxygen configuration derives from the oxygen excess C-type structure, where the vacant oxygen positions are ordered relative to each other in a similar manner as the 16c sites are in C-type structure. The ordered C-type related oxygen configurations is thus linked to the Rietveld results where the superlattice Bragg peaks were sensitive to the occupation of 16c. Since the vacancies are important to define the oxygen order we look further at vacancy ordering and alignments of vac–vac pairs in the systems.
3.3 Oxygen vacancy ordering
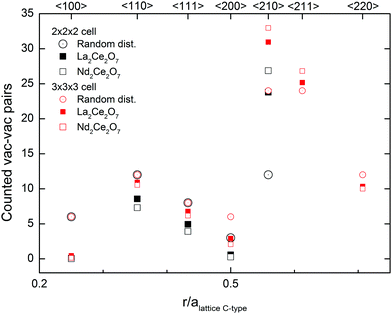
Oxide ion diffusion occurs during the MD runs at 1500 K, and therefore we can study how the oxygen sub-lattice evolves following diffusion. By sampling configurations from the run we then include numerous different oxygen configurations, further enabling us to look at statistics of the coordination numbers and the nature of oxygen vacancy order.The coordination numbers from MD are around 7 for all cations (Table 2), supporting that vacancy–vacancy ordering is not driven by electrostatic forces between cations and oxygen. From the Rietveld refinement of the Nd-containing samples we know that the observed superlattice peaks in PND and PXRD can be associated with a C-type structure, and the stoichiometric C-type structure (i.e. R2O3) contains a specific ratio of vacancies oriented in the 〈110〉, 〈111〉 and 〈210〉 directions. So to understand the underlying nature of these Bragg-peaks found in Nd2Ce2O7, the average vacancy–vacancy pair alignments found during the evolving MD runs in Nd2Ce2O7 and La2Ce2O7 are calculated.
The graph in Fig. 11 presents a pair distribution function with discrete values for the distances between the vacancies and shows the average number of vacancy pairs found in each set of directions within the supercell (N = 88 and 8 vacancies) of Nd2Ce2O7 and La2Ce2O7. For both compositions the closest vac–vac pairs are mostly observed in the 〈110〉 direction, as well as some in the 〈111〉 direction, which are the building blocks of the vacancy oxygen order found in the C-type structure.§ Almost no 〈100〉 pairs are found, and such alignments seem highly unfavourable. Furthermore, we found an unusually high amount of 〈210〉 alignments between the vacancies compared to a random vacancy distribution and almost no vac–vac pairs are aligned in the 〈200〉 direction. Since the 2 × 2 × 2 cell might be too small to correctly sample 〈200〉 and 〈210〉 pairs, additional MD runs were performed in a larger 3 × 3 × 3 cell, and the results confirm the high number of vac–vac pairs in the 〈210〉 direction (see Fig. 11).
In sufficiently reduced ceria an oxygen vacancy ordering with 〈111〉 vac–vac pairs is found.14 Our results show that such ordering can be ruled out for both of the investigated systems. In the structure proposed by Withers et al.,6 the preferred vac–vac alignment is also 〈210〉 together with some 〈200〉 and 〈220〉 alignments, based on the observed TEM diffraction pattern. However, they also suggest that first, second or third nearest neighbours should be avoided, which is not in agreement with our present MD simulations, since we see a significant amount of both 〈110〉 and 〈111〉 alignments. If we instead compare these results with the ratio between the typical alignments in C-type oxygen structures we see similarities. The ratios between the 〈210〉, 〈110〉 and 〈111〉 alignments observed in the MD runs for Nd2Ce2O7 are between the ratios in the stoichiometric C-type and our oxygen excess C-type used as one of the starting configurations in MD at 300 K. The preferred vacancy alignments and ratio supports an oxygen vacancy ordering similar to that in C-type.
There is no doubt that the 〈210〉 directions between vacancies are important in these compositions, and this alignment between vacant 16c positions in the C-type structure is accommodated in the {321} plane, and is thus linked to the Rietveld results where this superlattice Bragg peak was sensitive to the occupation of 16c. The preference for 〈210〉 vacancy pairs is stronger for Nd2Ce2O7 compared to La2Ce2O7. This indicates that the tendency of intermediate range vacancy ordering is stronger in Nd2Ce2O7, although La2Ce2O7 probably exhibits similar ordering to a small extent.
3.4 Summarizing discussion
The Rietveld refinements of the La2−xNdxCe2O7 series show that La2Ce2O7 exhibits a disordered oxygen deficient fluorite structure whereas additional super lattice peaks are apparent for the Nd-containing compositions. Therefore the best refinements for the Nd-containing compositions were reached with a two phase approach combining a C-type related structure with an oxygen deficient fluorite structure. Moreover, the Rietveld analysis revealed that the oxygen vacancies tend to be localised on the 16c site of the C-type structure, indicating that it can be viewed as an oxygen excess C-type phase. The increased intensity of the super-lattice peaks extracted from the PND data compared to the PXRD data indicates that oxygen order is the origin of the observed C-type supercell peaks. We find no evidence of cation order but the refinements show a small shift in one of the cation sites away from the perfect fluorite structure for the C-type related phase. The MD and RMC results are in good agreement and support the lack of cation clustering. Both techniques give an average coordination number around 7 for all cations in contrast to earlier suggested models.2,3 Therefore, we trust that the observed supercell peaks appear mainly due to symmetry changes arising from oxygen vacancy ordering.The observed vacancy ordering is described by vacancies aligning in the 〈210〉 direction combined with 〈110〉 and some 〈111〉 alignments, and can thus be termed an oxygen excess C-type structure where the remaining vacancies favour the 16c position. Such an order gives rise to symmetry planes equal to those in the C-type structure and can explain the superlattice peaks. Locally the 〈110〉 and 〈111〉 alignments of the vacancies induce small shifts in the cation position away from the perfect fluorite site for the 24d site as it is in the C-type structure. This shift in position will contribute to the additional superlattice peaks as supported by the Rietveld refinements.
The significant diffuse scattering observed for La2Ce2O7 indicates that the local structure deviates from the average fluorite structure, and the background modulation is also consistent with the C-type peak positions suggesting that there is some short range order similar to that of the Nd-containing samples. MD modelling of La2Ce2O7 supports this claim showing a tendency towards vacancy ordering.
Based on the diffraction data it is apparent that the amount, or degree, of long range order existing in La2−xNdxCe2O7 increases with the Nd-content. In La2−xNdxCe2O7 the lattice parameter decreases with Nd-content (see Fig. 6b), as expected, since the cation radius of Nd+3 is smaller than La+3. The development is, however, not linear, and the additional size reduction is likely to occur due to the increase in long range order, which is in agreement with earlier studies on Ce1−xNdxO2−δ.9,16
Some short range oxygen vacancy order seems to be preferred in both La2Ce2O7 and Nd2Ce2O7, but for long range order to appear, the building blocks of 〈110〉 and 〈111〉 alignments between the vacancies, further creating a high number of 〈210〉 alignments, must expand over several unit cells. The driving force towards long range order in La2−xNdxCe2O7 is most likely due to structural relaxation based on vacancy interactions and changes in cation size, since the coordination numbers and vacancy concentrations are equal for all the compositions in the La2−xNdxCe2O7 series. The decreasing cell size and free volume with increasing Nd-content could impose greater electrostatic forces between the vacancies, and oxide ions, making it more favourable for them to order. Structural relaxation in terms of long range ordering could also be facilitated by more similar ionic radius for the involved cations (i.e. Nd+3 more similar to Ce+4 than La+3). In La2Ce2O7, on the other hand, the strain caused by larger differences in cation size within the disordered cation lattice, obstructs the prevalence of long range order. This is consistent with the findings of Yamamura et al. in an earlier study of Ln2Ce2O7 (Ln = La, Nd, Sm, Eu, Gd, Y, Yb).17 They concluded that the ionic radius ratio r(Ln3+)/r(Ce4+), using the 8-fold coordinated Shannon radii,40 must be smaller than 1.17 for the C-type phase to be stabilized. This leaves La2Ce2O7 outside the stability range. This correlation is also found in the work of Ou et al. in similar compositions.41
The two phase approach used in the Rietveld refinements does not contradict the existence of grains containing domains of vacancy ordering, and the refined unit cell parameters of the two phases are indeed almost identical (i.e. afluorite ≈ 1/2 × ac-type). Also the G(r)s extracted from ordered and random oxygen configurations are quite similar, indicating that they could co-exist without considerable lattice mismatch. We therefore conclude that the samples of La2−xNdxCe2O7 exhibit crystalline grains with the fluorite structure and the presence of anion ordered domains of increasing extent with the Nd-content and it is supported by findings in Y2Ce2O7 by Withers et al.6
Vacancy ordering ultimately lowers the oxide ion conductivity. When a long range ordered sub-lattice is energetically favourable, the activation energy for an oxygen jump is higher than in a totally disordered lattice, as it can be compared to the formation of an anti-Frenkel defect. Oxygen transport might even depend on collective movements. If the more local forces are the dominating factor for the ordering, the oxygen (or vacancy) can be effectively trapped. In these compositions it is natural to assume that any oxygen movement inducing a vac–vac alignment in the 〈100〉 would have a high activation barrier, leading to a lower number of possible sites the oxygen (or vacancy) can jump to.
4 Conclusions
The La2−xNdxCe2O7 series predominantly exhibits a disordered fluorite structure with increasing intensity of additional C-type supercell peaks in the PND data with increasing x. Rietveld refinements show that the Nd-containing (x > 0) compositions were best fitted using a combination of oxygen deficient fluorite and oxygen excess C-type structure, whereas La2Ce2O7 was best refined as a disordered fluorite. The diffraction data and Rietveld refinements indicate that superlattice peaks stem from domains with vacancy ordering and associated shifts in the cation position away from the perfect fluorite structure, which is related to the C-type structure. Ab initio molecular dynamics results confirm that oxygen vacancy order comparable to that in the C-type structure, is a plausible ordering scheme explaining the change in long range order and the observed C-type Bragg peaks. The oxygen vacancies prefer alignments in the 〈210〉 direction in combination with the 〈110〉 and 〈111〉 direction. The PND data and MD suggest that C-type related ordering might also be found in La2Ce2O7. The radial distribution functions extracted from PND, RMC and MD is in good agreement, and show that oxygen ordered and disordered configurations can co-exist. The results show how these compositions are at the border between different structures where the stability is so finely balanced between enthalpic and entropic contributions, order and disorder. The extent of long range order gradually increases as the average cation size decreases with Nd-substitution. Finally, greater vacancy ordering can explain the low oxide ion conductivity in Nd2Ce2O7 compared to La2Ce2O7.Acknowledgements
The authors gratefully acknowledge UNINETT Sigma2 – the National Infrastructure for High Performance Computing and Data Storage in Norway, for providing computational resources for the MD modelling. The UK Science and Technology Facilities Council is thanked for allocating neutron beamtime at the ISIS facility, Rutherford Appleton Laboratory, U.K.References
- J. P. Allen, P. R. Keating, D. O. Scanlon and G. W. Watson, Doping CeO2 with trivalent cations: defect structures and reducibility, American Chemical Society, 2013, p. ENFL-418 Search PubMed.
- M. Coduri, M. Brunelli, M. Scavini, M. Allieta, P. Masala, L. Capogna, H. E. Fischer and C. Ferrero, Z. Kristallogr., 2012, 227, 272–279 CrossRef CAS.
- D. E. P. Vanpoucke, P. Bultinck, S. Cottenier, V. Van Speybroeck and I. Van Driessche, J. Mater. Chem. A, 2014, 2, 13723–13737 CAS.
- L. Pino, A. Vita, M. Lagana and V. Recupero, Appl. Catal., B, 2014, 148–149, 91–105 CrossRef CAS.
- H. L. Tuller and A. S. Nowick, J. Electrochem. Soc., 1975, 122, 255–259 CrossRef CAS.
- R. L. Withers, J. G. Thompson, N. Gabbitas, L. R. Wallenberg and T. R. Welberry, J. Solid State Chem., 1995, 120, 290–298 CrossRef CAS.
- T. Kudo and H. Obayashi, J. Electrochem. Soc., 1975, 122, 142–147 CrossRef CAS.
- H. Yahiro, Y. Eguchi, K. Eguchi and H. Arai, J. Appl. Electrochem., 1988, 18, 527–531 CrossRef CAS.
- T. Hagiwara, Z. Kyo, A. Manabe, H. Yamamura and K. Nomura, J. Ceram. Soc. Jpn., 2009, 117, 1306–1310 CrossRef CAS.
- J. Faber, C. Geoffroy, A. Roux, A. Sylvestre and P. Abélard, Appl. Phys. A: Solids Surf., 1989, 49, 225–232 CrossRef.
- H. L. Tuller and A. S. Norwick, J. Electrochem. Soc., 1979, 126, 209–217 CrossRef CAS.
- H. J. Rossell and H. G. Scott, J. Phys. (Paris), Colloq., 1977, 38(Colloq C-7), 28–31 Search PubMed.
- T. R. Welberry, B. D. Butler, J. G. Thompson and R. L. Withers, J. Solid State Chem., 1993, 106, 461–475 CrossRef CAS.
- S. Hull, S. T. Norberg, I. Ahmed, S. G. Eriksson, D. Marrocchelli and P. A. Madden, J. Solid State Chem., 2009, 182, 2815–2821 CrossRef CAS.
- M. Mogensen, T. Lindegaard, U. R. Hansen and G. Mogensen, J. Electrochem. Soc., 1994, 141, 2122–2128 CrossRef CAS.
- L. Li, R. Kasse, S. Phadke, W. Qiu, A. Huq and J. C. Nino, Solid State Ionics, 2012, 221, 15–21 CrossRef CAS.
- H. Yamamura, H. Nishino, K. Kakinuma and K. Nomura, J. Ceram. Soc. Jpn., 2003, 111, 902–906 CrossRef CAS.
- H. Yamamura, H. Nishino and K. Kakinuma, J. Ceram. Soc. Jpn., 2004, 112, 553–558 CrossRef CAS.
- V. Besikiotis, C. S. Knee, I. Ahmed, R. Haugsrud and T. Norby, Solid State Ionics, 2012, 228, 1–7 CrossRef CAS.
- E. Reynolds, P. E. R. Blanchard, Q. Zhou, B. J. Kennedy, Z. Zhang and L.-Y. Jang, Phys. Rev. B: Condens. Matter Mater. Phys., 2012, 85, 132101 CrossRef.
- D. E. P. Vanpoucke, P. Bultinck, S. Cottenier, V. Van Speybroeck and I. Van Driessche, Phys. Rev. B: Condens. Matter Mater. Phys., 2011, 84, 054110 CrossRef.
- S. Cheng, Master thesis, University of Oslo, 2012.
- H. Rietveld, J. Appl. Crystallogr., 1969, 2, 65–71 CrossRef CAS.
- A. C. Larson and R. B. Von Dreele, General Structure Analysis System (GSAS), Los Alamos National Laboratory Report, 1994, LAUR 86-748.
- A. K. Soper, Gudrun, http://www.isis.stfc.ac.uk/instruments/sandals/data-analysis/gudrun8864.html.
- D. Keen, J. Appl. Crystallogr., 2001, 34, 172–177 CrossRef CAS.
- M. G. Tucker, D. A. Keen, M. T. Dove, A. L. Goodwin and Q. Hui, J. Phys.: Condens. Matter, 2007, 19, 335218 CrossRef PubMed.
- S. T. Norberg, M. G. Tucker and S. Hull, J. Appl. Crystallogr., 2009, 42, 179–184 CrossRef CAS.
- N. E. Brese and M. O'Keeffe, Acta Crystallogr., Sect. B: Struct. Sci., 1991, 47, 192–197 CrossRef.
- S. Nosé, J. Chem. Phys., 1984, 81, 511–519 CrossRef.
- G. Kresse and J. Hafner, Phys. Rev. B: Condens. Matter Mater. Phys., 1993, 48, 13115–13118 CrossRef CAS.
- A. Spek, Acta Crystallogr., Sect. D: Biol. Crystallogr., 2009, 65, 148–155 CrossRef CAS PubMed.
- P. E. Blochl, C. J. Forst and J. Schimpl, Bull. Mater. Sci., 2003, 26, 33–41 CrossRef CAS.
- G. Kresse and J. Furthmueller, Phys. Rev. B: Condens. Matter Mater. Phys., 1996, 54, 11169–11186 CrossRef CAS.
- J. P. Perdew, K. Burke and M. Ernzerhof, Phys. Rev. Lett., 1996, 77, 3865–3868 CrossRef CAS PubMed.
- V. Grover and A. K. Tyagi, J. Solid State Chem., 2004, 177, 4197–4204 CrossRef CAS.
- F. Brisse and O. Knop, Can. J. Chem., 1967, 45, 609–614 CrossRef CAS.
- J. E. H. Sansom, J. R. Tolchard, P. R. Slater and M. S. Islam, Solid State Ionics, 2004, 167, 17–22 CrossRef CAS.
- W. L. Bragg and E. J. Williams, Proc. R. Soc. London, Ser. A, 1934, 145, 699–730 CrossRef CAS.
- R. Shannon, Acta Crystallogr., Sect. A: Cryst. Phys., Diffr., Theor. Gen. Crystallogr., 1976, 32, 751–767 CrossRef.
- D. R. Ou, T. Mori, F. Ye, T. Kobayashi, J. Zou, G. Auchterlonie and J. Drennan, Appl. Phys. Lett., 2006, 89, 171911 CrossRef.
- K. Momma and F. Izumi, J. Appl. Crystallogr., 2011, 44, 1272–1276 CrossRef CAS.
Footnotes |
| † Present address: ESAB AB, Lindholmsallén 9, SE-402 77 Gothenburg, Sweden. |
| ‡ Note that 〈111〉 is the group of directions and the correct vector for this vac–vac distance in the fluorite structure would be 1/2 × 〈111〉, and for the pyrochlore 1/4 × 〈111〉. However, to avoid confusion when comparing different unit cells we only use the group of directions related to an oxygen cube as illustrated in Fig. 1. |
| § There are indications towards the 〈111〉 vac–vac pairs being predominantly in empty cubes. However, a mix of empty and filled cubes is expected due to the resemblance to C-type structure and further studies are needed in order to determine the exact ratio. |
| This journal is © the Owner Societies 2016 |

