 Open Access Article
Creative Commons Attribution 3.0 Unported Licence
Mesophase structure and behaviour in bulk and restricted geometry of a dimeric compound exhibiting a nematic–nematic transition†
N.
Sebastián
*a,
M. G.
Tamba
a,
R.
Stannarius
a,
M. R.
de la Fuente
b,
M.
Salamonczyk
c,
G.
Cukrov
c,
J.
Gleeson
d,
S.
Sprunt
d,
A.
Jákli
c,
C.
Welch
e,
Z.
Ahmed
e,
G. H.
Mehl
*e and
A.
Eremin
*a
aDepartment of Nonlinear Phenomena, Institute for Experimental Physics, Otto von Guericke University Magdeburg, Magdeburg, Germany. E-mail: nerea.sebastian@ehu.eus; alexey.eremin@ovgu.de
bDepartamento de Física Aplicada II, Facultad de Ciencia y Tecnología, Universidad del País Vasco. Aptd 644, E-48080 Bilbao, Spain
cLiquid Crystal Institute and Chemical Physics Interdisciplinary Program, Kent State University, Kent, Ohio 44242, USA
dDepartment of Physics, Kent State University, Kent, Ohio 44242, USA
eDepartment of Chemistry, University of Hull, Hull HU6 7RX, UK. E-mail: g.h.mehl@hull.ac.uk
First published on 23rd June 2016
Abstract
We present structural studies of a dimeric compound composed of a central heptyl spacer linking two mesogens consisting of terphenyl units at which two adjacent fluoro groups are attached to each central ring. The terminal rings are linked to pentyl chains as terminal groups. The material exhibits a nematic–nematic transition and a low temperature modulated phase. The higher temperature nematic phase was found to exhibit an anomaly of the bend elastic constant similar to that of the dimers with N–Ntb phase sequence, and the physical properties of the low-temperature nematic phase are similar to those of the known Ntb materials. The structure of the low-temperature modulated smectic/columnar phase is described together with its ability to form freely suspended films and fibres. The relation of the modulated structure to the fibre formation and to the appearance of the labyrinthine instability in freely-suspended films is discussed.
1. Introduction
It has been long recognised that the mesogenic shape is of vital importance for determining the character of the liquid crystalline phase.1 Rod-shaped, disc-shaped, bent-core or umbrella-shaped molecular forms are just a few examples of mesogenic design. Bent-core mesogens, for example, exhibit a rich variety of polar phases, which are not typical for rod-shaped mesogens. Mean-field theory of bent-core liquid crystals predicts a manifold of nematic-type phases (without positional order) including uniaxial, biaxial and tetrahedratic phases.2 Unusual properties of the bent-core nematic phases of resorcinol derivatives, such as the formation of optically active domains, enhanced flexoelectric effect3 and strong magneto-optical effects,4,5 have been reported. Recently, the appearance of weakly first order nematic–nematic transitions and the identification of a novel nematic phase have been reported for cyanobiphenyl based odd methylene linked dimers (CBnCB).6–11 This new nematic-type phase is distinguished by unusual periodic patterns observed by polarising microscopy and very fast electro-optic switching in the microsecond regime.12,13 However, an unambiguous determination of the phase structure appears to be very difficult, since it exhibits no electron density modulation. Extensive studies8,10,11 suggested that this structure corresponds to a phase with a spontaneous conical twist-bend director distortion (Ntb), which was theoretically predicted to be driven by an elastic instability with the sign inversion of the bend elastic constant K33 for bent-shaped molecules.14 It was shown that only the odd parity of the flexible linking group of dimers gives rise to a predominant bent molecular conformation8,15,16 leading to unusually low K33 values in the classical nematic phase11,17,18 and nematics formed by bent-core mesogens.19 Alternatively, a flexoelectric instability may be responsible for a local polar helical order.20 Short-range smectic fluctuations and formation of interdigitated molecular clusters with twisted mesogenic conformations is yet another possibility to explain the structure of the new nematic phase.21 2H DNMR spectroscopy demonstrated local chiral order in the Ntb phase despite the fact that the mesogens do not possess any chiral groups.8,22–24 Measurements of the electroclinic effect in CB7CB25 suggested, and freeze-fracture transmission electron microscopy observations in thin films10,11 proved the presence of a very short pitch helix in the range of 8–12 nm. Recent resonant X-ray studies gave additional evidence in favour of the heliconical model.26 Despite the fact that the picture of a chiral nematic phase with a pitch of few molecular lengths where the director twists and bends is widely recalled, the mesophase structure still remains subject of debate.21,23,27,28 In addition, there have been great theoretical and simulation efforts towards the understating of the interactions and underlying mechanisms which account for the origin of such N–N transitions, with most recent results pointing towards steric interactions and the primary role of molecular shape as the driving force for the phase formation.21,29,30 For consistency with the remaining open questions, Nx notation will be employed in this contribution. Besides the fundamental interest of exploring new kinds of self-assembly, the unique combination of optical, dielectric and elastic properties of these new nematic phases makes them appealing for use in potential applications, such as tuneable diffraction gratings31 or full-colour electrically tuneable selective light reflection displays.32 Such findings have boosted the interest in liquid crystal dimers, with an increasing effort directed towards the understanding of the influence that molecular structure exerts on the occurrence of new nematic phases. Materials combining a variety of molecular modifications with respect to the original cyanobiphenyls have been reported, including studies of the combination of polar and apolar mesogens in the dimeric units, the influence of the nature of linking or terminal chains and their length,9,27,33–35 hydrogen-bonding driven dimers36 and asymmetric dimers with chiral groups, which show the cholesteric analogue of the Ntb phase and remarkably give rise to multiple sequential N–N transitions.36,37 This variety of new materials gave rise to richer mesomorphism which, in some cases, involve additional low temperature new smectic phases.27,35,38In this paper, we present polarizing microscopy, dielectric, elastic and small angle X-ray scattering studies of the structure of a six-ring compound 1 with laterally fluorinated terphenyl units, which exhibits an N–Nx transition and a low-temperature modulated phase.39 We demonstrate that the high-temperature nematic phase exhibits an anomaly of the bend elastic constant similar to that in the N phase of flexible dimers with underlying Ntb phase, and where the physical properties of the low-temperature nematic phase are similar to those of the known Ntb-materials. Freely suspended films (FSF) found in the Nx phase suggesting a strong tendency for smectic layering already in the Nx phase. We also discuss the structure and the properties of the low-temperature higher-ordered modulated phase exhibiting the labyrinthine instability in FSFs.
2. Experimental
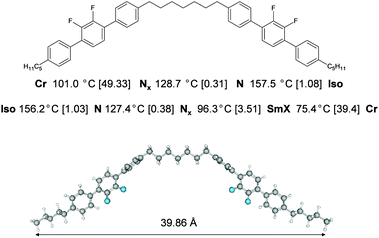
The investigated dimer 1,7-bis(2′,3′-difluoro-4′′-pentyl-[1,1′:4′,1′′-terphenyl]-4-yl)heptane was synthesized as described in the ESI,†![[thin space (1/6-em)]](https://www.rsc.org/images/entities/char_2009.gif) 39 and consists of two fluorinated mesogenic units connected via a spacer consisting of seven methylene units. The chemical structure of compound 1 is depicted in Fig. 1, together with the corresponding phase sequence as obtained by differential scanning calorimetry (DSC) from the second heating/cooling runs at scanning rates of 10 °C min−1.
39 and consists of two fluorinated mesogenic units connected via a spacer consisting of seven methylene units. The chemical structure of compound 1 is depicted in Fig. 1, together with the corresponding phase sequence as obtained by differential scanning calorimetry (DSC) from the second heating/cooling runs at scanning rates of 10 °C min−1.
Optical observations were made with a polarizing microscope (AxioImager Pol, Carl Zeiss, GmbH) equipped with a high-resolution cooled CCD camera AxioCam HR (Carl Zeiss, GmbH) in both transmission and reflection. Thin free-standing films were drawn across a 10 × 3 mm opening in a rectangular glass frame mounted in a Linkam LTS 350 heating stage. The temperature was controlled with an accuracy of ±0.1 °C. Measurements of the birefringence where made with a CRI Polscope polarimeter. Second-harmonic generation (SHG) measurements were performed using a linearly polarized Nd:YAG laser operating at λ = 1064 nm (10 ns pulse width and 10 Hz repetition rate) with a laser spot size of around 50 μm.
The perpendicular component of the dielectric permittivity was recorded in 7 μm planar aligned ITO glass cells with an Agilent Precision LRC meter E4890A. Dielectric spectra were investigated using an impedance analyzer HP4291A and gold-plated brass electrodes with 5 mm diameter separated by 50 μm thick silica spacers placed at the end of a coaxial line. As confirmed by subsequent data obtained under magnetic field alignment, in the metallic cells the material spontaneously aligned mostly homeotropically, allowing the measurement of the parallel component of the permittivity. Planar alignment was recovered by application of a dc bias field.
Small Angle X-ray Scattering (SAXS) was carried out on the beamline 7.3.3 of the Advanced Light Source of Lawrence Berkeley National Laboratory40 (10 keV incident beam energy, 1.24 Å wavelength, utilizing a Pilatus 2M detector). The liquid crystal was filled into 1 mm diameter quartz X-ray capillary tubes, which were then mounted into a custom-built aluminum cassette that allowed X-ray detection with a ±13.5° angular range. The cassette fits into a standard hot stage (Instec model HCS402) that allowed temperature control with ±0.1 °C precision. The stage also included two cylindrical neodymium iron boron magnets that supplied a magnetic induction of B = 1.5 T perpendicular to the incident X-ray beam. The analysis was performed in Igor Pro software with Nika package.41
3. Results and discussion
3.1 Optical textures
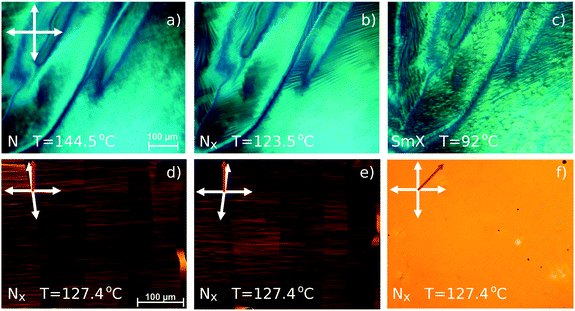
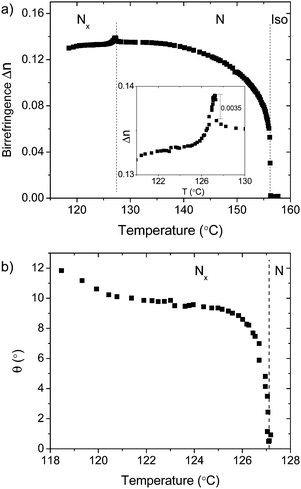
The high-temperature nematic phase on a bare glass substrate exhibits typical Schlieren textures in polarising microscopy. Strong flickering of the texture indicates pronounced director fluctuations typical for uniaxial nematic phases. In polyimide-treated sandwich cells, a planarly aligned uniform texture can be easily achieved. The transition into the low-temperature nematic phase (Nx) is marked by the appearance of fine wrinkles on the Schlieren texture (Fig. 2a and b). In case of thin films on a bare glass substrate with a free surface, the Schlieren texture transforms into the homeotropic one. When a uniform sample is prepared in the polyimide-treated planar cells (cell thickness: 6, 10 and 25 μm), the transition is accompanied by the formation of a periodic ribbon-like texture with the ribbons parallel to the rubbing direction (Fig. S1, ESI†), whereby the director field exhibits a splay deformation. The periodicity of the stripe pattern equals two times the cell thickness, as already described for other dimers exhibiting the twist-bend phase.7,31,42 It has recently been proposed that the underlying mechanism for the formation of such periodic texture corresponds to the Helfrich–Hurault-type instability.11,31 On further cooling, in thin-film samples on glass substrate, the smectic phase develops in the form of a uniformly aligned low-birefringent texture. The ribbon-texture continuously smears and becomes disordered. Only the Schlieren textures in thin films with a free surface remain polymorphic. The wrinkles on the Schlierens become more pronounced.Studies under very slow cooling rates (0.1 °C min−1) in very thin polyimide-treated planar cells (2.4 μm) show that the transition to the Nx phase leads to a quasi-uniform texture with domains of alternating handedness, which can be visualized from the contrast difference on uncrossing polarisers in opposite directions, as already observed for cyanobiphenyl based dimers and terphenyl systems by Panov et al.12,43 as well as for CB7CB by Meyer et al.25,44 (Fig. 2d–f), and which prevails over the striped texture till 10 degrees below the transition. With the rubbing direction at 45° with respect to the crossed polarizers, the texture appears uniform (Fig. 2f). The birefringence of the sample was measured by a CRI Abrio polarimeter in the nematic phase and in the quasi-uniform texture range of the Nx phase. As can be observed in Fig. 3a, the birefringence sharply increases at the onset of nematic ordering, but on approaching the N–Nx transition, it reaches a saturated value. At the transition to the low temperature nematic phase, a small jump in the birefringence δΔn could be detected, as expected for a weak first order transition. Assuming that the decrease of the birefringence is due to the Ntb-type heliconical director structure and following Meyer’s procedure, we estimate the temperature dependence of the conical angle θ using the expression ΔnTB(T) ≈ (ΔnNext(T) + δΔn)(3![[thin space (1/6-em)]](https://www.rsc.org/images/entities/char_2009.gif) cos2
cos2![[thin space (1/6-em)]](https://www.rsc.org/images/entities/char_2009.gif) θ(T) − 1)/2 (Fig. 3b). Compared to CB7CB, the nematic temperature range of 1 is broader and the Δn(T) behaviour deviates from Haller formula.45 For this reason the apparent saturated value of the birefringence in the nematic phase was used as the extrapolated value ΔnNext(T). The estimated θ value around 10° is approximately three times smaller than that reported for cyanobiphenyl based dimers.44,46 We should recall here that recently, based on 13C–{1H} NMR measurements at a magnetic field strength of 11.75 T, an unusual temperature dependence of the order parameter for the equivalent longer homologue (9 carbon chain) has been reported by Emsley et al.47 They showed that the order parameter exhibits a clear deviation from the Haller behaviour with a maximum in the N phase a few degrees before the transition to the Nx phase, which is followed by a smooth continuous decrease. The difference between the measured and the Haller extrapolated values is attributed to the presence of a tilt of the local director with respect to the magnetic field already in the N phase, which was accounted for in a similar way by the scaling factor P2(cos
θ(T) − 1)/2 (Fig. 3b). Compared to CB7CB, the nematic temperature range of 1 is broader and the Δn(T) behaviour deviates from Haller formula.45 For this reason the apparent saturated value of the birefringence in the nematic phase was used as the extrapolated value ΔnNext(T). The estimated θ value around 10° is approximately three times smaller than that reported for cyanobiphenyl based dimers.44,46 We should recall here that recently, based on 13C–{1H} NMR measurements at a magnetic field strength of 11.75 T, an unusual temperature dependence of the order parameter for the equivalent longer homologue (9 carbon chain) has been reported by Emsley et al.47 They showed that the order parameter exhibits a clear deviation from the Haller behaviour with a maximum in the N phase a few degrees before the transition to the Nx phase, which is followed by a smooth continuous decrease. The difference between the measured and the Haller extrapolated values is attributed to the presence of a tilt of the local director with respect to the magnetic field already in the N phase, which was accounted for in a similar way by the scaling factor P2(cos![[thin space (1/6-em)]](https://www.rsc.org/images/entities/char_2009.gif) θ(T)). If one applies the same procedure here, i.e. ΔnNext (T) is calculated from the Haller fit of Δn for temperatures between TNI and 140 °C, a different result will be obtained with the tilt steadily emerging already in the N phase below 140 °C and reaching a maximum value of around 20 degrees in the Nx phase. Emsley et al. argued47 that the appearance of such a tilt in the N phase results from entangled intercalated arrangements of few molecules as a consequence of the averaged bent molecular shape.
θ(T)). If one applies the same procedure here, i.e. ΔnNext (T) is calculated from the Haller fit of Δn for temperatures between TNI and 140 °C, a different result will be obtained with the tilt steadily emerging already in the N phase below 140 °C and reaching a maximum value of around 20 degrees in the Nx phase. Emsley et al. argued47 that the appearance of such a tilt in the N phase results from entangled intercalated arrangements of few molecules as a consequence of the averaged bent molecular shape.
3.2 Dielectric and elastic properties
Each mesogenic unit of compound 1 carries two identical dipole moments of about 1.5 D coming from each of the C–F bond. They give rise to a main component of the molecular dipole moment along the transversal direction. Thus, the dielectric anisotropy is negative and its magnitude slightly increases with increasing order parameter (Fig. 4). In all phases, both permittivities (parallel and perpendicular to the director) are rather small when compared to those obtained for other dimers with positive dielectric anisotropy42,46 and do not exceed 4.2. Upon the transition into the Nx and SmX phases, there are slight downward jumps of the values of both ε∥ and ε⊥, but Δε continues growing. Since the alignment is disturbed upon the transition to the Nx phase, the dielectric data cannot be easily interpreted in terms of parallel and perpendicular components of the dielectric permittivity. Interestingly, ε∥(f) and ε⊥(f) in the three phases are characterized by a single high frequency relaxation process (∼108 Hz) with very small thermal activation (Fig. S2, ESI†), which can be associated with the rotations around the long molecular axes. The lack of any appreciable contribution at low frequencies has two implications: first, the averaged molecular longitudinal dipole moment vanishes due to the molecular symmetry; and second, collective processes characteristic of polar phases are absent. The absence of polar order on a micrometre scale was also demonstrated by the absence of the optical Second Harmonic Generation: neither spontaneous nor field-induced SHG signals could be detected.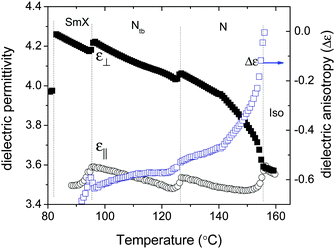 | ||
| Fig. 4 Temperature dependence of the dielectric permittivity (left axis) and the dielectric anisotropy (right axis). | ||
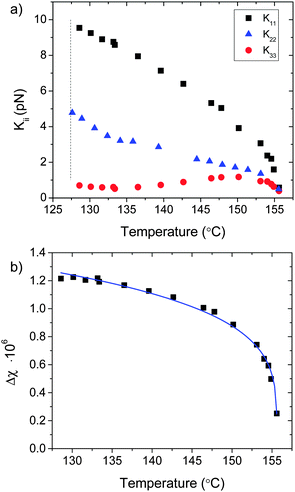
The splay (K11) and bend (K33) elastic constants in the conventional nematic phase were determined from the magnetic field dependence of the sample capacitance in the splay geometry. The magnetic field was varied between 0 and 700 mT with a waiting time of 30 seconds between the application of the field and the data acquisition, to allow an equilibration of the sample. While K11 can be determined directly from the Fréedericksz threshold  (d equals the cell thickness, 25 μm in our case), K33 can be deduced from the full fit of the capacitance curve (see ESI† for detailed description). The diamagnetic susceptibility anisotropy Δχ has been calculated from the change of the magnetic threshold field Bth under different applied voltages that tend to stabilize the planar alignment, given the negative dielectric anisotropy of the material (see ESI† for a detailed description of the method). The sample capacitance was measured with an Impedance Analyzer Solartron 1260 at the frequency of 5 kHz at different probe fields using the 4-wire technique. The twist elastic constant was measured in the high temperature nematic phase by studying the light transmission in the twist geometry (magnetic field in the cell plane, perpendicular to the alignment direction) with the sample positioned between crossed polarisers, initially at 0° and 90° with respect to the nematic director. The magnetic threshold field was determined from the intersection of the initial signal increase and that of the undistorted state (Fig. S4, ESI†) and K22 was obtained from the relation
  .
.
Fig. 5a shows the temperature dependence of K11, K22 and K33 in the high temperature nematic phase. Contrary to conventional nematics, K33 is significantly lower than K11 and decreases on cooling down to ∼0.6 pN before the transition to the modulated phase takes place. This is in agreement with the results reported for a variety of dimers with odd numbered spacers.11,17,18,42 On the other hand, K22 slowly increases on cooling down to 135 °C. Below this temperature and approaching the N–Nx transition, the increase becomes much steeper. The ratio of the elastic constants K11/K22 remains around 2.5 and slightly decreases close to the Nx phase. Despite the decrease, K11/K22 remains larger than 2 as expected for the stabilization of the twist-bend deformation opposed to the splay-bend deformation.14 Such ratio of around 2.5 was previously reported for a six component mixture of odd dimers,18 but is far from that of 1.4 recently discussed for CB7CB.48
The temperature dependence of the measured diamagnetic anisotropy Δχ shown in Fig. 5b enabled us to estimate the orientational order parameter S. By fitting the data with the Haller equation45 Δχ = Δχ0·S = Δχ0(1 − T/TC)β, we find β = 0.23 and Δχ0 = 1.88 × 10⁻⁶, implying an order parameter S that varies between 0.4 and 0.65. This is in agreement with other reported values as, for example, for CB7CB.8,46,49
3.3 Mesophase structure
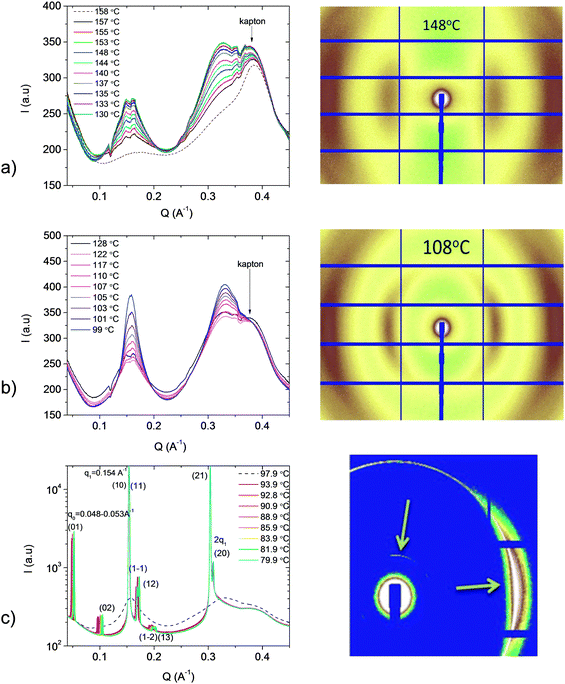
Nanoscale structures of the mesophases were investigated by synchrotron X-ray scattering on magnetically aligned samples. The azimuthally integrated intensities are plotted against the wavenumber q at various temperatures in Fig. 6. In the temperature range of both nematic phases, the scattering diagrams look very similar. They feature broad equatorial maxima in the wide-angle region and rather weak quasi-reflections in the small-angle region. High-resolution X-ray reveals a fine structure of SAXS data. In the nematic phase, three broad peaks can be distinguished oriented nearly parallel to the applied magnetic field: two of them are closely spaced at q1a ≈ 0.149 Å−1, q1b ≈ 0.157 Å−1 and the third is at q2 ≈ 0.328 Å−1 (Fig. 6a). They correspond to the d-values of d1a ≈ 42.4 Å, d1b ≈ 40.0 Å and d2 ≈ 19.1 Å, respectively. All these values are fairly independent of temperature and can be compared with the molecular size. The length of the extended molecule is about 43.28 Å, a single monomer (without a spacer) is 17.25 Å and the bent-conformer is about 39.69 Å in length (Fig. 1). Remarkably, the intensity of the SAXS peaks is very weak and is comparable to the wide-angle scattering intensity originated from the lateral order of the mesogens. Compared with the spacing observed in the X-ray experiments, we may conclude that d1a and d1b correspond to the bent conformers and d2 is about half of d1a,b. The correlation length estimated from the full width at half maximum (FWHM) is ξ ≈ 20 Å, which is significantly smaller than the molecular length in the extended conformation. Although both peaks are quite small, the intensity at q2 is remarkably larger than that at q1. These observations are in accord with results for a range of dimers containing laterally fluorinated groups where correlation lengths in the range of 10–20 Å were detected, using lab based instrumentation.27In the Nx phase, the q1a and q1b peaks merge to a single peak at q1 ≈ 0.158 Å−1 (Fig. 6b). Only two broad quasi-reflections can be distinguished in SAXS. The intensities of both peaks increase on lowering the temperature, but the q-values of the maxima do not change significantly. Importantly, while I(q2) increases only slightly (20%) on cooling, I(q1) increases by about 200%. The correlation lengths (ξ ≈ 10–100 Å) at the lowest temperature range of the Nx phase are larger than the molecular lengths indicating smectic cluster type correlations, similar to those typically observed in rigid bent-core materials.50 These data can be interpreted by the presence of smectic clusters with a strongly intercalated structure. The stability of the clusters is determined by the steric interactions favouring parallel alignment of the monomers and the tendency of aromatic and alkyl moieties to separate on the molecular scale. In the nematic phase, the dynamic equilibrium between these structures is established, which yields two SAXS peaks corresponding to the length of the bent dimer and about half of this length. As the temperature is lowered, the conformational landscape attained by the mesogens becomes smaller and the motion of the molecular moieties in an intercalated structure becomes constrained. This favours a long-term stability of twisted (chiral) conformers. As a result, a helical superstructure develops or, as new theoretical works demonstrate,21,51 a strongly intercalated chiral cluster structure with a nano-scale periodicity is stabilised.
The scattering pattern drastically changes upon the transition to the low-temperature higher-ordered phase (Fig. 6c). The broad nematic peaks condense into sharp quasi-Bragg reflections typical for smectic and columnar phases. New reflections appear in SAXS which indicate a 2D structure (columnar or modulated smectic). The primary peaks at q1 = 0.154 Å−1, corresponding to the length of the dimer (with a slightly more extended conformation than in Nx), become very sharp and show some preferred orientation in the same direction as in the Nx phase. The second-order reflection appears at q2 = 2q1. These peaks can be attributed to a smectic periodicity. The correlation length of the peaks is ξ1 > 500 Å, indicating well developed smectic layers. An additional peak at q0 = 0.048 Å−1 (d = 131 Å) appears in the direction nearly perpendicular to the magnetic field. This peak position increases on cooling, corresponding to a decrease of the periodicity from 131 Å to about 118 Å over the entire SmX temperature range (Fig. 7). Thus, the SmX phase can be described as a modulated structure with an oblique unit cell. This kind of pattern is very similar to that found in the B7 and B1 phases of rigid bent-core materials The observed peaks can be indexed as (01), (02), (10), (11), (1−1), (12), (1−2), (13), (21) and (20), as shown in Fig. 6c. The splitting of the (11), (1−1) and the (12) (1−2) peaks is in agreement with an oblique character of the unit cell. Fig. 8 represents the electron density map obtained for the SmX phase at 93 °C assuming all positive form factor phases. An overlay of the proposed packing is also given, showing a B1-type modulated structure with the layer spacing shifted by half a layer distance in periodicities of about 11 nm. Such a modulation period is in agreement with recent FF-TEM results obtained in the SmX phase of the investigated compound, that also showed its coexistence with the smectic layers. There it was found that the material forms stable free-standing filaments which is characteristic of the B7 materials.39
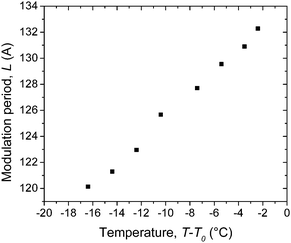 | ||
| Fig. 7 Modulation period as a function of the temperature. T0 = 96.3 °C is the Nx–SmX transition temperature. | ||
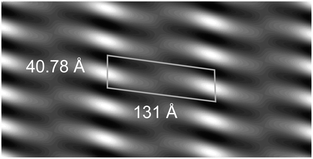 | ||
| Fig. 8 Electron density map with proposed overlaid molecular packing model. The map size is 40 × 20 nm2. | ||
Upon further cooling, a new phase, tentatively assigned to be a crystal phase, forms below SmX at 74 °C. This phase exhibits a very sharp peak at q1 = 0.212 Å−1, corresponding to d1 = 29.64 Å. This value is significantly smaller than the length of a dimer, suggesting either a tilted or an intercalated lamellar configuration.
In summary, the transformation of the mesophase can be described as following: the isotropic phase condenses into a nematic phase were mesogens are prone to organise into short-ranged intercalated clusters. As the temperature lowers, reaching the Nx phase, twisted molecular conformations persist for longer time and a chiral separation takes place. We note that these conformations can be unwound by strong external magnetic fields.52 The mesogens in the clusters adopt a tilted anticlinic configuration with neighbouring packs of mesogens shifted by half of the molecular length and exhibiting a helical arrangement.21 This gives an X-ray maximum corresponding to about half of the molecular length. At the Nx–SmX transition, the layers extend, but the competition between the tendency of the mesogens to intercalate and the excluded volume interactions favouring single layers results in a frustration, which is relieved by development of a periodic 2D modulation where the molecular blocks are shifted by about half of the molecular length.
3.4 Behaviour in freely-suspended films
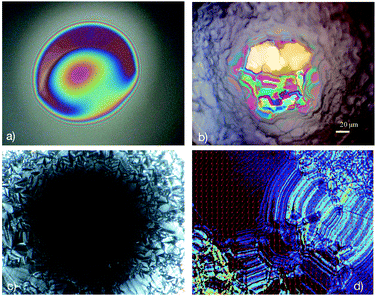
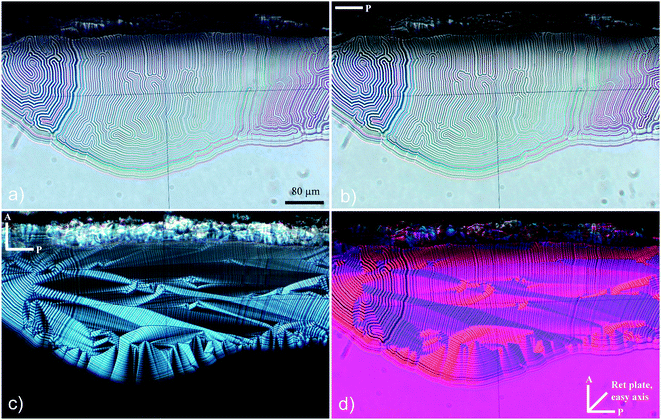
Stability of freely-suspended films is typical for most of the smectic materials. The investigated material is no exception. Films of thicknesses varying between 100 nm and 1000 nm could be easily prepared in the SmX phase. Surprisingly, the films could be prepared even in the Nx phase. Remarkably, the films remained stable upon heating up to 10 degrees above the bulk Nx–SmX transition. In the Nx phase, the films appear very turbid with continuous variation of the films thickness, which is often encountered in nematic phases (Fig. 9a). Surface-induced pre-smectic order is known to stabilize films in the nematic phase. Close to the Nx–SmX transition, layer steps appear, but the films remain very dynamic. This is a clear indication of the developing layer structure already in the Nx phase. Persistent advective motion in the films often results in their rupture. The films appear dark between crossed polarisers without any indication of the Schlieren textures in the Nx phase, which indicates that the optical axis is orthogonal to the film plane. Layer-steps appear close to the bulk transition temperature to the SmX phase. In the SmX phase, the motions in the film come to a halt often resulting in areas (islands) with a uniform film thickness (Fig. 9b). Films thinner than 50 nm remain uniform in the SmX phase. In the course of time, however, tong-like structures appear from the meniscus and grow into the film area (Fig. 10). Those structures exhibit labyrinth-type striped patterns, which are visible even without polarisers (Fig. 10a and b). Between crossed polarisers, these labyrinths appear birefringent, with the slow optical axis parallel to the stripes (Fig. 10d). The growth of the tongues from the film meniscus is initiated by the dislocation climb of a layer dislocation with a large Burgers number. The dislocation can go around the whole film or it may change its propagation direction forming a pin. Already formed dislocations elongate, fold and bifurcate, which drives further growth of the striped pattern. The labyrinthine pattern has coloured appearance in reflection and transmission without polarisers. These stripes are similar to the coloured stripes in freely suspended filaments and are attributed to an interference effect.53In 100–1000 nm thick films, the pattern formation is different. The boundaries of islands, which represent thickness steps, become unstable in the SmX phase (Fig. 9b) and they transform into finger-like structures, which grow and bifurcate. The final texture consists of traces of layer-steps and appears coloured in reflected light. The optical slow axis is aligned parallel to the layer dislocations (Fig. 9d). In thicker areas, where no colour can be distinguished, the labyrinth structures appear too, but the single stripes cannot be easily distinguished. The quasi focal conic texture observed in polarised light is a direct indication of a 1D periodic order in the SmX phase (Fig. 9b). The labyrinth texture is reversible and it disappears on heating in the vicinity of the SmX–Nx transition.
The mechanism responsible for the formation of the labyrinthine structure remains unclear. It appears that the spontaneous polarisation cannot drive the instability since non polar response to an in-plane electric field has been observed in freely-suspended films of various thicknesses, suggesting the absence of either a ferroelectric or antiferroelectric structure. In this respect, another kind of mechanism can be considered, which was suggested for intercalated dimeric SmC compounds.54 The broken layer structure of the SmX phase can be considered as effectively intercalated, but on a larger length scale (150 Å). In this structure, the LC/air interface layer would exhibit a density inhomogeneity. An undulation of the layers develops to compensate the inhomogeneity by tilting the smectic layers and splaying the director to balance the nonuniformity of the density. Such a splayed configuration is favoured in the vicinity of a layer dislocation. Thus, the undulation reduces the energy of the layer dislocations. In case of a negative line tension, the layer dislocations spontaneously grow forming a 1D periodic pattern of islands.54 Similar mechanisms can be envisioned for the formation of the 2D structure of the SmX phase in films. When the smectic layers are formed, they align parallel to the film surface. In freely suspended films, the free surface imposes a geometrical constraint on the order of the smectic layers. A transversal modulation of the smectic layers can be described by a complex order parameter ψ2 = ψ02eiφ(x,y), where ψ02 is the amplitude and φ(x,y) = qm·r is the phase with a modulation wave vector qm. This wave imposes a periodic inner stress on the smectic layers, which at the beginning is equilibrated by the surface stress. As the modulation amplitude increases, the inner stress leads to a dilation/compression of the smectic layers followed by the nucleation of edge dislocations similar to a Helfrich instability. Since the modulation length is comparable with the molecular scale (130 Å), the layers appear strongly interdigitated. As a result, the outer, half-filled layer has a reduced density, which favours the local curvature of the outer smectic layer. The curvature induced by the stress modulation can be relieved by introducing edge dislocations in the vicinity of the surface layer. Such a spontaneous curvature reduces the dislocation energy We per unit length. When We < 0, the dislocations start elongating and filling up the space.
4. Conclusions
In summary, we studied a dimeric mesogen with negative dielectric anisotropy which exhibits a nematic–nematic transition and an additional modulated smectic phase at lower temperatures. The classical uniaxial nematic phase at high temperatures shows very low values of the bend elastic constant and is followed by a low temperature nematic phase which exhibits properties similar to those of the Ntb phase, such as periodic striped textures in thick cells, quasi-uniform domains of opposite handedness in thin cells, and the absence of nonlinear optic activity in the bulk. At the same time, metastable freestanding (FS) films could be formed indicating a tendency to smectic ordering. The low-temperature SmX phase is found to be a modulated phase, which exhibits a labyrinthine instability in FS films and forms freely suspended fibres. This finding suggests that the modulated structure is responsible for the stabilisation of the fibres and labyrinths in films rather than the polarisation splay as in the B7 phase of bent-core LCs.Acknowledgements
Authors are specially grateful to Prof. O. D. Lavrentovich for stimulating discussions. This work was supported by the German Research Foundation (DFG ER 467/8), the US National Science Foundation (DMR No. 1307674) and the EPSRC projects EP/M015726 and EP/J004480. N. S thanks the Alexander von Humboldt Foundation for a Postdoctoral Research Fellowship at the Otto von Guericke University Magdeburg.References
- P. G. de Gennes and J. Prost, The Physics of Liquid Crystals, Clarendon Press, Oxford, 1995 Search PubMed.
- T. C. Lubensky and L. Radzihovsky, Phys. Rev. E, 2002, 66, 031704 CrossRef CAS PubMed.
- J. Harden, B. Mbanga, N. Eber, K. Fodor-Csorba, S. Sprunt, J. T. Gleeson and A. Jákli, Phys. Rev. Lett., 2006, 97, 157802 CrossRef CAS PubMed.
- T. Ostapenko, D. B. Wiant, S. N. Sprunt, A. Jákli and J. T. Gleeson, Phys. Rev. Lett., 2008, 101, 247801 CrossRef CAS PubMed.
- D. Wiant, K. Neupane, S. Sharma, J. T. Gleeson, S. Sprunt, A. Jákli, N. Pradhan and G. Iannacchione, Phys. Rev. E, 2008, 77, 061701 CrossRef CAS PubMed.
- C. S. P. Tripathi, P. Losada-Pérez, C. Glorieux, A. Kohlmeier, M. G. Tamba, G. H. Mehl and J. Leys, Phys. Rev. E, 2011, 84, 41707 CrossRef PubMed.
- V. P. Panov, M. Nagaraj, J. K. Vij, Y. P. Panarin, A. Kohlmeier, M. G. Tamba, R. A. Lewis and G. H. Mehl, Phys. Rev. Lett., 2010, 105, 167801 CrossRef CAS PubMed.
- M. Cestari, S. Diez-Berart, D. A. Dunmur, A. Ferrarini, M. R. de la Fuente, D. J. B. Jackson, D. O. Lopez, G. R. Luckhurst, M. A. Perez-Jubindo, R. M. Richardson, J. Salud, B. A. Timimi and H. Zimmermann, Phys. Rev. E, 2011, 84, 031704 CrossRef CAS PubMed.
- P. A. Henderson and C. T. Imrie, Liq. Cryst., 2011, 38, 1407–1414 CrossRef CAS.
- D. Chen, J. H. Porada, J. B. Hooper, A. Klittnick, Y. Shen, M. R. Tuchband, E. Korblova, D. Bedrov, D. M. Walba, M. A. Glaser, J. E. Maclennan and N. A. Clark, Proc. Natl. Acad. Sci. U. S. A., 2013, 110, 15931–15936 CrossRef CAS PubMed.
- V. Borshch, Y.-K. Kim, J. Xiang, M. Gao, A. Jákli, V. P. Panov, J. K. Vij, C. T. Imrie, M. G. Tamba, G. H. Mehl and O. D. Lavrentovich, Nat. Commun., 2013, 4, 2635 CAS.
- V. P. Panov, R. Balachandran, M. Nagaraj, J. K. Vij, M. G. Tamba, A. Kohlmeier and G. H. Mehl, Appl. Phys. Lett., 2011, 99, 261903 CrossRef.
- V. P. Panov, R. Balachandran, J. K. Vij, M. G. Tamba, a. Kohlmeier and G. H. Mehl, Appl. Phys. Lett., 2012, 101, 234106 CrossRef.
- I. Dozov, Europhys. Lett., 2001, 56, 247 CrossRef CAS.
- M. Cestari, E. Frezza, A. Ferrarini and G. R. Luckhurst, J. Mater. Chem., 2011, 21, 12303–12308 RSC.
- M. Stocchero, A. Ferrarini, G. J. Moro, D. A. Dunmur and G. R. Luckhurst, J. Chem. Phys., 2004, 121, 8079 CrossRef CAS PubMed.
- K. L. Atkinson, S. M. Morris, F. Castles, M. M. Qasim, D. J. Gardiner and H. J. Coles, Phys. Rev. E, 2012, 85, 12701 CrossRef PubMed.
- K. Adlem, M. Čopič, G. R. Luckhurst, A. Mertelj, O. Parri, R. M. Richardson, B. D. Snow, B. A. Timimi, R. P. Tuffin and D. Wilkes, Phys. Rev. E, 2013, 88, 22503 CrossRef CAS PubMed.
- B. Kundu, R. Pratibha and N. V Madhusudana, Phys. Rev. Lett., 2007, 99, 247802 CrossRef PubMed.
- S. M. Shamid, S. Dhakal and J. V Selinger, Phys. Rev. E, 2013, 87, 52503 CrossRef PubMed.
- N. Vaupotič, S. Curk, M. A. Osipov, M. Čepič, H. Takezoe and E. Gorecka, Phys. Rev. E, 2016, 93, 022704 CrossRef PubMed.
- J. P. Jokisaari, G. R. Luckhurst, B. A. Timimi, J. Zhu and H. Zimmermann, Liq. Cryst., 2015, 42, 708–721 CAS.
- A. Hoffmann, A. G. Vanakaras, A. Kohlmeier, G. H. Mehl and D. J. Photinos, Soft Matter, 2015, 11, 850–855 RSC.
- C. Greco, G. R. Luckhurst and A. Ferrarini, Phys. Chem. Chem. Phys., 2013, 15, 14961–14965 RSC.
- C. Meyer, G. R. Luckhurst and I. Dozov, Phys. Rev. Lett., 2013, 111, 067801 CrossRef CAS PubMed.
- C. Zhu, M. R. Tuchband, A. Young, M. Shuai, A. Scarbrough, D. M. Walba, J. E. Maclennan, C. Wang, A. Hexemer and N. A. Clark, Phys. Rev. Lett., 2016, 116, 147803 CrossRef PubMed.
- Z. Ahmed, C. Welch and G. H. Mehl, RSC Adv., 2015, 5, 93513–93521 RSC.
- E. Gorecka, M. Salamonczyk, A. Zep, D. Pociecha, C. Welch, Z. Ahmed and G. H. Mehl, Liq. Cryst., 2015, 42, 1–7 CrossRef CAS.
- A. G. Vanakaras and D. J. Photinos, Soft Matter, 2016, 12, 2208–2220 RSC.
- C. Greco and A. Ferrarini, Phys. Rev. Lett., 2015, 115, 147801 CrossRef PubMed.
- P. K. Challa, V. Borshch, O. Parri, C. T. Imrie, S. N. Sprunt, J. T. Gleeson, O. D. Lavrentovich and A. Jákli, Phys. Rev. E, 2014, 89, 060501 CrossRef CAS PubMed.
- J. Xiang, Y. Li, Q. Li, D. A. Paterson, J. M. D. Storey, C. T. Imrie and O. D. Lavrentovich, Adv. Mater., 2015, 27, 3014–3018 CrossRef CAS PubMed.
- R. J. Mandle, E. J. Davis, S. A. Lobato, C. C. A. Vol, S. J. Cowling and J. W. Goodby, Phys. Chem. Chem. Phys., 2014, 16, 6907–6915 RSC.
- R. J. Mandle, E. J. Davis, C.-C. A. Voll, C. T. Archbold, J. W. Goodby and S. J. Cowling, Liq. Cryst., 2015, 42, 688–703 CAS.
- R. J. Mandle, E. J. Davis, C. T. Archbold, C. C. A. Voll, J. L. Andrews, S. J. Cowling and J. W. Goodby, Chemistry, 2015, 21, 8158–8167 CrossRef CAS PubMed.
- S. M. Jansze, A. Martínez-Felipe, J. M. D. Storey, A. T. M. Marcelis and C. T. Imrie, Angew. Chem., Int. Ed., 2015, 54, 643–646 CAS.
- E. Gorecka, N. Vaupotič, A. Zep, D. Pociecha, J. Yoshioka, J. Yamamoto and H. Takezoe, Angew. Chem., Int. Ed., 2015, 54, 10155–10159 CrossRef CAS PubMed.
- R. J. Mandle and J. W. Goodby, Soft Matter, 2016, 12, 1436–1443 RSC.
- M. G. Tamba, S. M. Salili, C. Zhang, A. Jákli, G. H. Mehl, R. Stannarius and A. Eremin, RSC Adv., 2015, 5, 11207–11211 RSC.
- A. Hexemer, W. Bras, J. Glossinger, E. Schaible, E. Gann, R. Kirian, A. MacDowell, M. Church, B. Rude and H. Padmore, J. Phys.: Conf. Ser., 2010, 247, 012007 CrossRef.
- J. Ilavsky, J. Appl. Crystallogr., 2012, 45, 324–328 CrossRef CAS.
- N. Sebastián, D. O. López, B. Robles-Hernández, M. R. de la Fuente, J. Salud, M. A. Pérez-Jubindo, D. A. Dunmur, G. R. Luckhurst and D. J. B. Jackson, Phys. Chem. Chem. Phys., 2014, 16, 21391–21406 RSC.
- R. Balachandran, V. P. Panov, Y. P. Panarin, J. K. Vij, M. G. Tamba, G. H. Mehl and J. K. Song, J. Mater. Chem. C, 2014, 2, 8179–8184 RSC.
- C. Meyer, G. R. Luckhurst and I. Dozov, J. Mater. Chem. C, 2015, 3, 318–328 RSC.
- I. Haller, Prog. Solid State Chem., 1975, 10, 103–118 CrossRef.
- B. Robles-Hernández, N. Sebastián, M. R. de la Fuente, D. O. López, S. Diez-Berart, J. Salud, M. B. Ros, D. A. Dunmur, G. R. Luckhurst and B. A. Timimi, Phys. Rev. E, 2015, 92, 062505 CrossRef PubMed.
- J. W. Emsley, M. Lelli, H. Joy, M.-G. Tamba and G. H. Mehl, Phys. Chem. Chem. Phys., 2016, 18, 9419–9430 RSC.
- C.-J. Yun, M. R. Vengatesan, J. K. Vij and J.-K. Song, Appl. Phys. Lett., 2015, 106, 173102 CrossRef.
- Z. Zhang, V. P. Panov, M. Nagaraj, R. J. Mandle, J. W. Goodby, G. R. Luckhurst, J. C. Jones and H. F. Gleeson, J. Mater. Chem. C, 2015, 3, 10007–10016 RSC.
- A. Jákli, Liq. Cryst. Rev., 2013, 1, 65–82 CrossRef.
- E. Ramou, Z. Ahmed, C. Welch, P. K. Karahaliou and G. H. Mehl, Soft Matter, 2016, 12, 888–899 RSC.
- S. M. Salili, M. G. Tamba, S. N. Sprunt, C. Welch, G. H. Mehl, A. Jákli and J. T. Gleeson, Phys. Rev. Lett., 2016, 116, 217801 CrossRef CAS PubMed.
- A. Eremin, A. Nemeş, R. Stannarius, M. Schulz, H. Nádasi and W. Weissflog, Phys. Rev. E, 2005, 71, 031705 CrossRef PubMed.
- D. Pociecha, E. Gorecka, N. Vaupotič, M. Čepič and J. Mieczkowski, Phys. Rev. Lett., 2005, 95, 207801 CrossRef PubMed.
Footnote |
| † Electronic supplementary information (ESI) available. See DOI: 10.1039/c6cp03899a |
| This journal is © the Owner Societies 2016 |

