
 Open Access Article
 This Open Access Article is licensed under a
 Creative Commons Attribution 3.0 Unported Licence
Role of ion-pair states in the predissociation dynamics of Rydberg states of molecular iodine
J.
von Vangerow
a,
A. S.
Bogomolov
b,
N. V.
Dozmorov
b,
D.
Schomas
a,
F.
Stienkemeier
a,
A. V.
Baklanov
*bc and
M.
Mudrich
*a
aPhysikalisches Institut, Universität Freiburg, 79104 Freiburg, Germany. E-mail: mudrich@physik.uni-freiburg.de
bInstitute for Chemical Kinetics and Combustion, Institutskaya Str. 3, Novosibirsk 630090, Russia. E-mail: baklanov@kinetics.nsc.ru
cNovosibirsk State University, Pirogova Str. 2, Novosibirsk 630090, Russia
First published on 22nd June 2016
Abstract
Using femtosecond pump–probe ion imaging spectroscopy, we establish the key role of I+ + I− ion-pair (IP) states in the predissociation dynamics of molecular iodine I2 excited to Rydberg states. Two-photon excitation of Rydberg states lying above the lowest IP state dissociation threshold (1st tier) is found to be followed by direct parallel transitions into IP states of the 1st tier asymptotically correlating to a pair of I ions in their lowest states I+(3P2) + I−(1S0), of the 2nd tier correlating to I+(3P0) + I−(1S0), and of the 3rd tier correlating to I+(1D2) + I−(1S0). Predissociation via the 1st tier proceeds presumably with a delay of 1.6–1.7 ps which is close to the vibrational period in the 3rd tier state (3rd tier-mediated process). The 2nd tier IP state is concluded to be the main precursor for predissociation via lower lying Rydberg states proceeding with a characteristic time of 7–8 ps and giving rise to Rydberg atoms I(5s25p46s1). The channel generating I(2P3/2) + I(2P1/2) atoms with total kinetic energy corresponding to one-photon excitation is found to proceed via a pump – dump mechanism with dramatic change of angular anisotropy of this channel as compared with earlier nanosecond experiments.
Introduction
Molecular iodine I2 is a benchmarking molecule for studies of the photophysics of molecular Rydberg and IP states. The spectral features of many Rydberg and IP states of I2 are well characterized on the basis of experimental studies [ref. 1–3 and references therein]. In spite of the complexity of the electronic system of I2 substantial progress regarding the accuracy of non-empirical quantum-chemical calculations of its high-lying states is now being made.4,5The nature of these states can be elucidated by studying the mechanisms and dynamics of their decay. Photodissociation of highly excited I2 can give rise to either ionic species arising from the dissociation via IP states, or to Rydberg states of I atoms appearing in neutral channels. A very useful approach for the identification of dissociation channels is based on measuring the photofragments distribution as a function of kinetic energy release (KER), which has been applied to the study of I2 photodissociation via high-lying states.6,7 O'Keeffe and coauthors investigated photofragments appearing after two-photon excitation of I2 at 193 nm into superexcited Rydberg states converging to the excited electronic state of the molecular ion I2+(B2Σg+).6 Measurements of KER allowed these authors to conclude that these superexcited states dissociate via neutral channels giving rise to the pair I[R(3PJ)] + I(2P3/2), where I[R(3PJ)] are Rydberg atoms converging to the I+(3PJ) states of the ion with J = 2, 1, 0. Recently in the work by Bogomolov et al.,7 photodissociation of Rydberg states lying above the threshold for IP appearance has been studied. In that paper the velocity map imaging (VMI) technique was applied to identify the active photodissociation channels as well as to quantify their contributions. Predissociation of excited Rydberg states giving rise to the IP I+(3P2) + I−(1S0) and to Rydberg atoms I(5s25p46s1) was detected. The observed channels are
| I2 + 2hν → I2* |
| → I(2P3/2) + I((3P1)6s[1]3/2), Ethr = 9.207 eV | (C1) |
| → I(2P3/2) + I((3P0)6s[0]1/2), Ethr = 9.092 eV | (C2) |
| → I+(3P2) + I−(1S0), Ethr = 8.934 eV | (C3) |
| → I(2P3/2) + I((3P2)6s[2]3/2), Ethr = 8.497 eV | (C4) |
| → I(2P3/2) + I((3P2)6s[2]5/2), Ethr = 8.316 eV. | (C5) |
| I2 + hν → I(2P3/2) + I(2P1/2). | (C6) |
Here we present a time-resolved study of the photodissociation dynamics of molecular iodine in highly excited states, triggered by two-photon excitation in the same energy range as in our previous study.7 The fs pump–probe technique is applied in combination with VMI of photofragments. In particular, measuring the kinetic energy of I+ ions arising from the photodepletion of IP states by the fs probe pulse allows us to control the propagation of excited wavepackets in IP states.
Experimental
The experiments are performed using a molecular beam apparatus which has been described in detail previously.14 The laser system comprises a Ti:Sa-based oscillator (Tsunami by Spectra Physics) and a regenerative amplifier (Legend by Coherent) operated at 5 kHz repetition rate. The wavelength was held fixed at the third harmonic of the laser radiation (270 nm) which is generated by a homebuilt frequency conversion stage consisting of two BBO crystals, a calcite plate and a λ/2-wave plate. The third harmonic characteristics are a pulse energy of up to 20 μJ, a pulse length of about 230 fs, and a FWHM of the spectral profile of about 1 nm. The laser pulses are split into identical pump and probe pulses which are time-delayed using a mechanical delay line. Collinearly co-propagating pump and probe beams are focused by a lens with a focal length of 15 cm.A continuous supersonic expansion of a gas mixture of I2 seeded in helium takes place through a 50 μm continuous nozzle into vacuum at a stagnation pressure of 0.5 to 1 bar. The source chamber is pumped by a 1000 l s−1 turbomolecular pump to maintain a pressure of about 10−5 mbar in the source chamber. A 400 μm skimmer provides differential pumping between the source chamber and the laser interaction region. Ions are extracted from the interaction zone by a set of electrodes configured for VMI, as described by Eppink and Parker,15 and projected on the surface of a 2-D detector which is monitored by a charge coupled device (CCD) camera. The VMI spectrometer is oriented perpendicular to the molecular beam (off-axis arrangement). For each step of the time delay, 15![[thin space (1/6-em)]](https://www.rsc.org/images/entities/char_2009.gif) 000 camera frames are collected at a camera frame rate of 30 Hz. For each frame, the centroid coordinates of ion events are determined. The ion speed distributions are reconstructed from the recorded images using the pBasex algorithm.16
000 camera frames are collected at a camera frame rate of 30 Hz. For each frame, the centroid coordinates of ion events are determined. The ion speed distributions are reconstructed from the recorded images using the pBasex algorithm.16
Results and discussion
Images of I+ ions and their assignment
The fs pump–probe experiments have been carried out at delay times varied within the range of 0 to 2 ns. Fig. 1 shows selected velocity-mapped images of I+ ions for several values of the pump–probe delay. The various dissociation channels mentioned above are visible as discrete rings in the images as indicated by the arrows. Fig. 2 shows the results of Abel inversion and angular integration of these images. | ||
| Fig. 1 Velocity map images of I+ ions arising in pump–probe experiments at a wavelength of 270 nm with molecular iodine I2 (see text). The delay time is shown for each image. The red arrows show the identified channels (see text). The double sided blue arrow indicates the direction of polarization, the dashed black arrow that of the molecular beam. | ||
 | ||
| Fig. 2 Total Kinetic Energy Release (TKER) for photofragments arising from the photodissociation of I2 in the pump–probe experiments described in the text. The presented results are obtained by Abel inversion of the recorded images using the pBasex algorithm. All amplitudes are normalized to the signal of channel C3. Peaks corresponding to different channels are shown in different colors. | ||
The channels detected at sufficiently long delay times >15 ps, coincide with those detected in the nanosecond experiments7 for similar excitation levels. In these channels I+ ions appear directly via decay of an IP state (channel C3) or due to one-photon photoionization of Rydberg atoms I(5s25p46s1) by the probe pulse as it is shown in the schematic level diagram of Fig. 3. Fig. 3 also contains Total Kinetic Energy Release (TKER) values expected for these channels for two-photon excitation at 270 nm (hν = 4.59 eV). The values of TKER are calculated using the threshold excitation energies Ethr given above for processes C1–C5. Ethr for channels C1, C2, C4 and C5 is calculated using the bond energy value D0(I–I) = 1.542 eV and the energy values of the excited states of the I atom.17 For channel C3 the values of the atomic ionization potential EIP,I = 10.451 eV17 and of the electron affinity EEA,I = 3.059 eV18 are used.
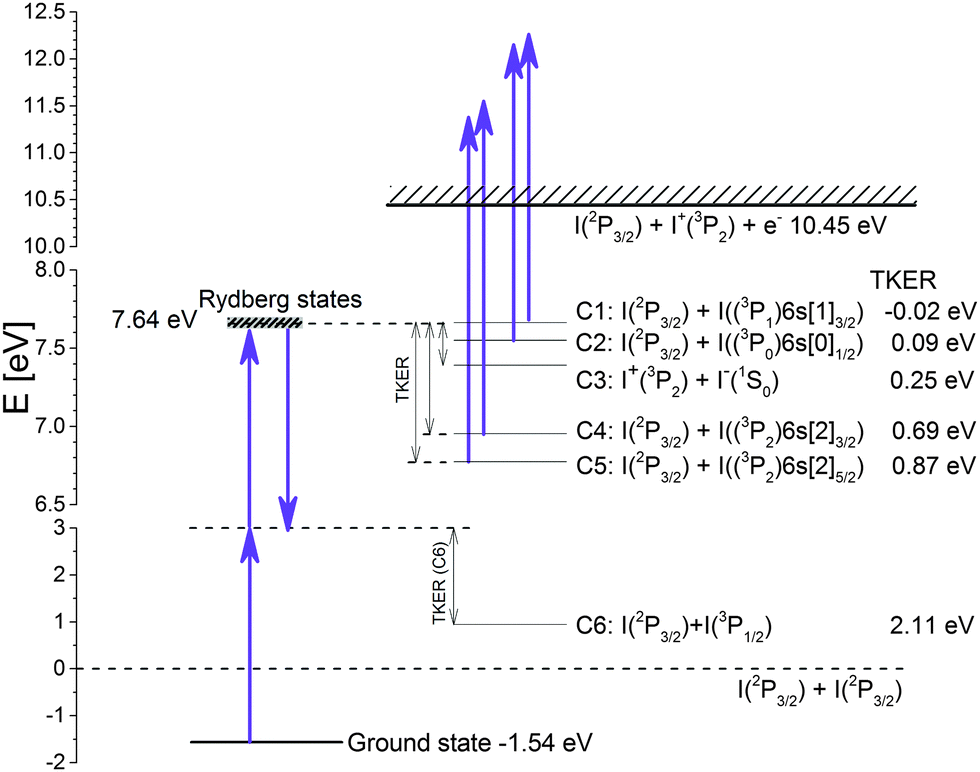 | ||
| Fig. 3 Scheme of dissociation channels of I2 excited by two photons into Rydberg states. The given values of TKER for photofragments arising from photodissociation via these channels are referenced to the two-photon excitation energy at 270 nm. Positive numbers correspond to states lying below the excitation energy and the negative number corresponds to the one higher lying state. The photodissociation channel C6 corresponding to a one-photon excitation or to a three-photon pump-dump process (see text) is also shown. | ||
Spectroscopy of I2 superexcited states
Fig. 4 shows the spectral dependence of the two-photon absorption of I2 in the region of interest. This spectrum is reproduced from ref. 7 where the spectral profile of the I+ yield resulting from two-photon excitation of I2 was recorded in a pulsed molecular beam. Also shown are data obtained by Donovan et al. which were measured at room temperature.2 Donovan et al. had assigned the bands in this region to transitions into vibrational states of the [2Π1/2]c8s;0g and [2Π1/2]c8s;1g Rydberg states as well as a number of REMPI lines of the I atom. Later, polarization studies as well as rotational contour analysis have been carried out by the same group for the (2 + 1) REMPI spectrum of the bromine molecule Br2 where similar Rydberg bands were assigned to transitions into the 6d-states.19 The similarity of the REMPI spectra for the halogens Cl2, Br2 and I2 based on the more accurately determined values of the ionization potentials for I2 allowed the authors of ref. 3 to reassign these vibrational progressions to transitions into [2Π1/2]c6d;2g and [2Π1/2]c6d;0g+ states, respectively. The labeling of the lines in Fig. 4 is consistent with this assignment and includes the vibronic lines (ν′,ν′′) taken from ref. 2. Here, ν′ and ν′′ denote the vibrational quantum numbers of upper and lower states of the transition, respectively. In the following we will abbreviate the involved Rydberg states by Ry. The spectral width of the fs laser pulses at 270 nm (measured FWHM ≈ 1 nm) determines the energy range of two-photon excitation to about 200 cm−1. Thus, from Fig. 4 we see that several transitions to vibronic Rydberg states are driven simultaneously. | ||
| Fig. 4 I+ ion yield arising from two-photon excitation of I2 (red lines).7 The grey background corresponds to the REMPI spectrum (right axis) measured in gaseous I2 at room temperature by Donovan et al.2 (reproduced from ref. 7). Labels 2g and 0g denote the upper states [2Π1/2]c6d;2g and [2Π1/2]c6d;0g+, respectively. The Gaussian contour with a FWHM of 200 cm−1 shown on the top of the figure represents the spectral profile of the two-photon excitation function of I2 provided by the fs pulses. The two grids on the top of that figure show the density of states in the neighboring manifolds of the IP states of 2nd and 3rd tiers in the considered energy range (see text). | ||
Dynamics: predissociation via the 2nd tier IP state
In addition to the channels discussed above, new features are observed in the present pump–probe experiments. In Fig. 1 we see a bright spot in the center of the image which first gains intensity at short delays and then fades out at long delays. Due to the off-axis arrangement of our VMI spectrometer this center spot is weakly distorted by the longitudinal kinetic energy spread of the I2 molecules along the molecular beam. In Fig. 2 the maximum of this signal (C1′, red line) is observed at 4 ps. Fig. 5 shows the temporal behavior of the integrated near-zero TKER contribution as a function of delay time. This new signal can be attributed to electron photodetachment of I2 molecules located near a turning point of the potential as discussed below. | ||
| Fig. 5 Delay-time dependence of the signal in the center of the ion images integrated within the TKER interval 0–0.02 eV. | ||
Fig. 6 depicts the two-photon excited Rydberg state denoted as Ry and the IP states of the 1st to 3rd tiers. The potential curve of the excited Rydberg state is represented by a Morse potential which is taken to be equal to that of the ionized molecule I2+ in the ground electronic state X[2Π1/2]g shifted in energy so as to match the spectral position of the 0g(0,0) band in Fig. 4. To construct the potentials of the IP states we take the potentials of the three lowest IP states of 0g+ symmetry which are better characterized in the literature than the others. These potentials are obtained by extrapolating the curves derived from spectroscopy by Wilson et al.20 The short distance part of the IP potentials is fitted to a modified Morse potential  . The constants Te and Re are given in the literature for the states E(0g+), f(0g+) and f′(0g+),20 and De and ai are fit parameters. For fitting of the long-range branch the Rittner potential is used in the form
 | (1) |
 | ||
| Fig. 6 Two-photon excited Rydberg state (red) coupled with IP states (blue, brown and green), shown together with ionized states represented by straight horizontal lines. The dashed horizontal line indicates the excitation level equal to twice the photon energy. The vertical dotted lines are at the outer turning points of 2nd and 3rd tier potentials. The purple arrows indicate the initial photoexcitation and subsequent one-photon photodetachment of an electron from 1st and 2nd tier IP states at intermediate I–I distances giving rise to channels C1′ and C3′. Et,N is the kinetic energy of I atoms which is distance dependent but conserved in the photodetachment process. | ||
Fig. 6 also illustrates the dependence of the kinetic energy of the photofragments (TKER) on the delay between pump and probe pulses. According to the Franck–Condon principle, photodetachment of an electron from an IP provides a pair I+ + I with a TKER value equal to the intramolecular kinetic energy Et,N of the IP I+–I− in the probed state at the moment of photodetachment. The electron recoil is negligible within our experimental uncertainty. Knowledge of the potential curve of the probed state allows one to control the interatomic distance evolution in time as suggested in ref. 21. Thus, when the electron is photodetached from the I+–I− pair located near a turning point of the potential one observes near-zero TKER values as we do for delay times around 5 ps (see Fig. 2).
The 1st tier IP state lies below the level of excitation. Therefore molecules predissociating via the 1st tier state propagate to infinity giving rise to an IP I+–I− with TKER = 0.25 eV corresponding to channel C3 in Fig. 1–3. The positions of the turning points in the 2nd and 3rd tier states are indicated by dotted lines in Fig. 6. The time necessary to propagate between left and right turning points is equal to half of a vibrational period (τ1/2) at our excitation energy. A classical trajectory simulation in these states gives the values τ1/2 = 3140 and 690 fs for the 2nd and 3rd tier states, respectively. The observed time of 4.0 ps is roughly 900 fs longer than predicted by the classical simulation for the 2nd tier state. This difference is attributed to the deviation of the 2nd tier potential curve from that shown in Fig. 6. This deviation is due to an avoided crossing of the diabatic 2nd tier state with the diabatic Rydberg state giving rise to channel C1 shown in Fig. 7b.
 | ||
| Fig. 7 (a) Crossings of IP states with molecular Rydberg states giving rise to channels C1, C2, C4 and C5. Rydberg states giving rise to channels C1, C2, C4 and C5 are shown as grey dashed lines. The purple arrows on the left hand side indicate the level of excitation. Colored dashed lines illustrate of the vibrational wavepacket propagation in IP states. (b) Close-up of the avoided crossing with the 2nd tier IP potential. The black lines represent adiabatic states arising from an avoided crossing of the two diabatic states. The brown arrow indicates the position of the turning point for the unmodified 2nd tier IP state; the black arrow indicates the lengthening of the distance of wavepacket propagation to the outer turning point due to the avoided crossing. | ||
Fig. 7 shows the crossings of diabatic IP states and molecular Rydberg states giving rise to channels C1, C2, C4 and C5. The potential energy curves of these Rydberg states are represented as Morse potentials. The parameters of this potential (Re = 2.59 Å, De = 61.8 kcal mole−1 = 21620 cm−1) for all these channels are taken to be equal to those calculated by Kalemos et al.4 for a molecular Rydberg state adiabatically correlating to the pair I(2P) + I*(4P). The electronic term values Te for these states are adjusted to the final state energies of I atoms arising in channels C1, C2, C4 and C5, respectively.
Fig. 7b shows the adiabatic states generated by the avoided crossing of the 2nd tier IP state with the Rydberg state giving rise to channel C1. Thus, the outer turning point of the potential is shifted to a larger distance by the presence of the avoided crossing. This shift induces an increase of the time necessary for the wavepacket to propagate from the Franck–Condon region to the outer turning point. A classical simulation is used to estimate the extra propagation time for different values of the coupling of the crossing diabatic states. The potentials of the adiabatic states are obtained from the equation
 | (2) |
Fig. 8 presents the low-energy part of the distribution of photofragments as a function of TKER at a delay time of 3.0 ps in comparison with the results of the classical simulation. In the simulation we assume that the population of the Rydberg state (Ry in Fig. 6) by the pump pulse follows a Gaussian time-profile with a FWHM of 160 fs corresponding to a two-photon excitation function. Decay from Ry due to the coupling to the IP states is assumed to be exponential with a characteristic time so as to fit the shape of the TKER distribution. This exponential decay is a phenomenological model assumption to describe the coupling dynamics including all possible pathways leading to the localization of the wavepacket at the outer turning point of the 2nd IP potential. It results in a time-distribution of the population of the IP state, which we subdivide in intervals of 1 fs. For each discrete time step the propagation in the IP state is calculated numerically by solving Newton's equation. The distribution of starting times in the IP state gives rise to a distribution over I–I distance values for all delay-times between pump and probe pulses. The latter distribution of I–I distances directly relates to a distribution of TKER values for the I+ + I pair generated by photodetachment. Thus we obtain a TKER distribution which matches the measured one best for a delay time of 2.85 ps which is close to the experimental delay time of 3 ps. This agreement confirms our conclusion that the dynamics in the 2nd tier state modified by the avoided crossing is responsible for the evolution of the TKER distribution shown in Fig. 2 (C1′, red line).
 | ||
| Fig. 8 Low-energy part of the TKER distribution measured at a delay time of 3.0 ps (black line) and obtained from a classical dynamics simulation (red and blue lines). | ||
The time profile of the low-energy part of the TKER distribution (channel C1′) has a long tail well seen in Fig. 5. We interpret this long tail as a spread in time of arrival to the turning point for different parts of the wavepacket in the 2nd tier state. Fig. 7b shows the lengthening of the propagation distance to the turning point in the region of the avoided crossing for the energy corresponding to the center of the wavepacket. At higher energy the lengthening is larger and therefore the time of arrival is longer. The spectral profile of the two-photon excitation function shown in Fig. 4 is sufficiently broad to overlap with the energy region where the increase of propagation distance and time is substantial.
Dynamics: predissociation via the 1st tier IP state
Another channel with a clearly visible evolution of the TKER distribution is designated in Fig. 1 and 2 as channel C3′. The TKER distribution for this channel shifts towards that of channel C3 with increasing delay time and finally coincides with channel C3 for long delay times. Channel C3 corresponds to free I+ ions which result from the propagation of a vibrational wavepacket to infinity along the 1st tier IP state. C3′ results from photodetachment of the same wavepacket by the probe pulse at intermediate distances R(I+–I−) as shown in Fig. 6. The potential V(R) for the long-range branch in this state is given by eqn (1). Since the intramolecular kinetic energy Et,N depends on the R(I+–I−) distance we can use our classical model to compute Et,N as a function of propagation time in this state.In particular we can compare the measured TKER value for this channel with the value expected for the case when propagation in the 1st tier state starts at the moment of excitation. For this analysis the data obtained at delay times varying from 5 to 7 ps are best suited because the TKER peak of channel C3′ does not overlap with the neighboring peaks.
Fig. 9 shows the TKER distribution observed at a delay time of 6.67 ps as an example. In the case of prompt predissociation via the 1st tier state the rising edge of the TKER distribution for channel C3′ should correspond to a propagation time close to the delay between pump and probe pulses (TKER = 0.4 eV). We see in Fig. 9 that indeed there is a contribution at his TKER value.
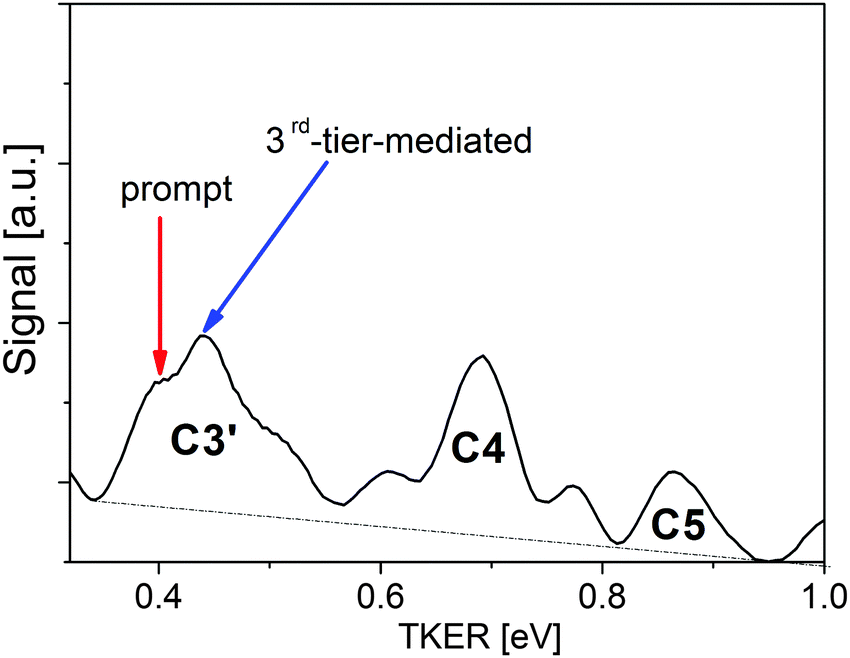 | ||
| Fig. 9 Example of the distribution of TKER values for I+ ions arising in channel C3′ due to electron photodetachment from a wavepacket propagating in the 1st tier IP state. The presented data are measured at a delay time of 6.67 ps. The red arrow indicates the maximum of TKER values expected for the case when wavepacket propagation in the 1st tier state starts at the moment of excitation (prompt predissociation via 1st tier state); the blue arrow shows the case of predissociation via the 1st tier state when propagation starts with a delay of 1600–1700 fs which roughly matches the oscillation period of the 3rd tier state (3rd-tier-mediated, see text). | ||
However, the maximum of the distribution is around TKER = 0.45 eV corresponding to a shifted starting time of the propagation by 1.6–1.7 ps. This shift in time is attributed to a coupling of the initial state with the 3rd tier state such that part of the population first undergoes wavepacket oscillations in the 3rd tier state prior to decaying into the 1st tier state. The value of the time shift roughly coincides with the period of oscillation in the 3rd tier IP state. At our excitation energy the oscillation time in the diabatic 3rd tier state with a long-range branch described by eqn (1) is about 1.38 ps. However, as it is seen in Fig. 7a, the outer turning point of the trajectory is close to the crossing region of the diabatic 3rd tier state and the Rydberg state giving rise to channel C1. The diabatic potential generated by the avoided crossing shifts the turning point to larger distances with a corresponding lengthening of the oscillation period similar to that shown in Fig. 7b for the 2nd tier state. Our classical simulation shows that coupling term values V = 180–230 cm−1 are sufficient to modify the potential so as to extend the oscillation period in the 3rd tier state to 1.6–1.7 ps. The transition from the 3rd tier to the 1st tier state can proceed due to the crossing of the Rydberg states with both IP states. The tail of the C3′ TKER distribution in Fig. 9 is attributed to minor contributions shifted by two or more periods of oscillation in the 3rd tier state. Contributions from lower lying IP states can be excluded because they would provide longer delay times. Unfortunately, direct probing of the dynamics in the 3rd tier state is impossible with our probe wavelength as the photon energy is not sufficient for photodetachment even at the turning point of the 3rd tier state, see Fig. 6.
We note that another indication for the participation of the 3rd tier state in the dynamics is given by the structure of the groups of lines observed in the excitation spectrum of the Rydberg state detected in ref. 7 and shown in Fig. 4. We attribute the splitting of the lines to the interaction of the excited Rydberg state with the vibrational manifold of the nearby IP states. Comparison of the observed structure with the calculated series of lines of the 2nd and 3rd tier states in the energy region under consideration confirms the contribution of the vibrational manifold of the 3rd tier IP state. The two grids of lines depicted on the top of Fig. 4 illustrate the vibrational states manifolds of the IP states of 2nd [f(0g+)] and 3rd tiers [f′(0g+)]. These are calculated using the program LEVEL by Le Roy24 with the IP states potentials constructed from literature values (see Eqn (1) and the related discussion) as an input. Thus, the results obtained allow us to conclude that IP states of all three accessible tiers participate in the predissociation of the high-lying Rydberg states under study.
Mechanism and dynamics of the appearance of Rydberg atoms I(5s25p46s1)
Fig. 10 shows the time-traces of yields of Rydberg atoms I(5s25p46s1) (channels C2, C4, C5). The characteristic time of their appearance is 7–8 ps. Direct predissociation of the initially excited state Ry via channels C1, C2, C4 and C5 is impossible because these states do not cross in the accessible energy region. However, the IP states cross both types of Rydberg states and thereby serve as intermediate states facilitating predissociation into Rydberg atoms I[R(3PJ)]. As we see in Fig. 7a there are many crossings of IP states with molecular Rydberg states giving rise to channels C2, C4 and C5. | ||
| Fig. 10 Dependence of the yield of Rydberg I(5s25p46s1) atoms arising in channels C2, C4, and C5. The data are obtained by integration of the corresponding peaks in the I+ TKER distribution. The solid lines show exponential fits of the data yielding characteristic lifetimes as indicated. | ||
The probability P for transitions between diabatic IP states of the 1st, 2nd and 3rd tiers with these Rydberg states in the regions of the avoided crossings can be estimated within the Landau–Zener approach22
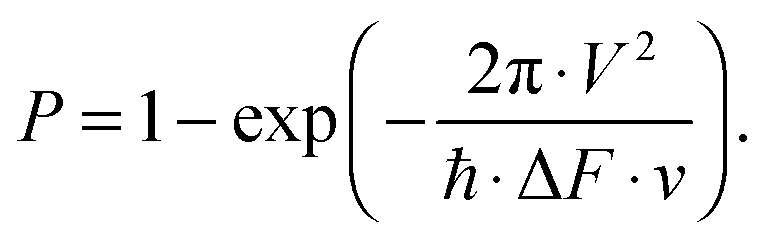 | (3) |
For estimations with formula (3) the speed ν and difference of the slopes of diabatic potentials ΔF in the crossing point are calculated for the potentials shown in Fig. 7a. For the probability of transitions from the 1st tier IP state to each of the Rydberg states under consideration we find about 1, 5 and 15% for the three values of V mentioned above, respectively. Crossings at longer distances with the right branch of the IP potentials can provide larger transition probability due to substantially smaller values of the slope difference ΔF.
As we see in Fig. 5 the population of the 2nd tier IP state drops between first and second maxima of oscillations by about a factor of e. This means that the 2nd tier lifetime is close to the oscillation period of 8 ps. The appearance time of Rydberg atoms (channels C2, C4 and C5) is also close to this value (see Fig. 10). This coincidence indicates that the generation of I(5s25p46s1) atoms results mainly from predissociation of the 2nd tier IP state via crossings with Rydberg states as shown in Fig. 7a.
Angular anisotropy of one- and two-photon excitation of I2
The angular distribution of recoil directions of I atoms and ions arising in channels C2–C5 discussed above is nearly isotropic (β = 0–0.1) in agreement with the nanosecond experiment.7 The absence of anisotropy in these channels was assumed to be due to the long lifetime of the two-photon excited state exceeding the period of rotation of the I2 molecule. The results of the present work allow us to test this conjecture. The present results indicate that photodissociation of the excited I2 molecules proceeds with a characteristic time of about 8 ps. The results of our classical simulation show that for all considered mechanisms of predissociation the angle of rotation of the excited molecule does not exceed 10 degrees even when assuming an unreasonably high rotational temperature Trot = 100 K. The reason for this small angle of rotation is that even in a bound IP state the molecule spends most of its time in configurations with large I–I elongation and low angular velocity. Therefore we conclude that the angular distribution of recoil directions of photofragments should be close to that measured for prompt dissociation.The observed nearly isotropic angular distribution probably results from direct two-photon excitation via multiple pathways involving intermediate states of different symmetry. According to ref. 25 these states are repulsive at I–I distance values close to the equilibrium geometry of groundstate I2 (Re = 2.67 Å). Several of these states are expected to contribute to the two-photon excitation of I2 in the spectral region of interest. The sum of these pathways results in a nearly isotropic distribution as observed experimentally.
Our hypothesis about the participation of intermediate states of different symmetries is supported by the results obtained for channel C6 which corresponds to photodissociation after excitation of I2 by one photon (6). Fig. 11 shows images of I(2P1/2) from this channel in our ns7 and fs experiments. In the fs experiments the excited atom I(2P1/2) is ionized by a (2 + 1)-REMPI process via a two-photon resonance accessible due to the spectrally broad fs pulses. This resonance at 2hν = 74109 cm−1 was observed before by Donovan et al.2Fig. 11 shows that the corresponding image displays a dramatically different angular anisotropy as compared with the ns experiment.
 | ||
| Fig. 11 Images displaying the difference in angular anisotropy of recoil directions for I(2P1/2) fragment atoms with a TKER value corresponding to process (6). (a) Nanosecond experiment (reproduced from ref. 7); (b) fs experiment (present work). | ||
The image recorded in the ns experiment indicates that ionization proceeds via the “perpendicular” one-photon transition C1u(3Σu+)←X0g+(1Σg+).7 The conspicuously different anisotropy of channel C6 in the fs experiment we interpret in terms of a two-photon pump and one-photon dump transition being the main process, as it is sketched in Fig. 3. The predominant contribution of a three-photon over a one-photon transition is attributed to the much higher light intensity of our fs pulses (∼5 × 10¹² W cm−2) as compared with the ns pulses (∼1010 W cm−2). The angular anisotropy of a three-photon pump-dump process is determined by the anisotropy of the sequence of direct two-photon pump and one-photon dump steps.
As we mentioned the combination of pathways driven in the two-photon pump step results in a nearly isotropic angular distribution. So we conclude that the observed anisotropy with β = 0.6–0.7 most probably results from a dominant contribution of a “parallel” dump transition. As Fig. 4 shows, two-photon excited states are of 0g and 2g symmetry. They can be coupled by radiation in a one-photon “parallel” process with states 0u and 2u, respectively. States of this symmetry exist among the repulsive valence-shell states of I2 correlating with the formation of a pair I(2P3/2) + I(2P1/2) in process (6).25 This further supports the interpretation that these states can act as intermediates in a direct two-photon excitation, as we have argued above.
Conclusions
The combination of the fs pump–probe technique with velocity map imaging of charged photofragments has been applied to study the dynamics of intramolecular motion and dissociation of iodine molecules I2 after two-photon excitation into Rydberg states at 270 nm. Probe pulses (270 nm) induce either one-photon photodetachment of an electron from the I2 molecule in an IP states or photoionization of the appearing iodine atoms. Photodetachment in the IP state gives rise to a pair I+ + I with total kinetic energy release (TKER) equal to the intramolecular kinetic energy in the IP state (I+–I−) at the moment of photodetachment. This value together with the knowledge of the shape of the potential in the IP state allows us to infer the interatomic distance in the IP state at the moment of photodetachment. This approach has been used to control the dynamics of excited I2 molecules in IP states as well as to measure the state-resolved dynamics of the appearance of iodine atoms.The channels of I2 photodissociation observed in fs experiments when probing at long delay-time are the same as those observed earlier in nanosecond experiments. These channels include predissociation via the 1st tier IP state, processes giving rise to accessible Rydberg states of I atoms as well as a channel giving rise to a pair I(2P3/2) + I(2P1/2) with TKER corresponding to one-photon excitation.
The results obtained clearly disclose the key role of the dynamics in IP states of the 1st, 2nd and 3rd tiers which are coupled with the Rydberg state initially excited by the laser pulses. On a picosecond time-scale there is a well-resolved evolution of the TKER distribution corresponding to the vibrational dynamics in the IP state of the 2nd tier. The population of this 2nd tier state drops with a characteristic time close to one oscillation period (∼8 ps) in this state.
The dynamics in the 1st tier IP state is also probed directly. Wavepackets propagating in the 1st tier state contain two contributions. The minor one appears promptly and is attributed to the direct predissociation of the excited Rydberg state via the 1st tier IP state. The major contribution appears with a delay of 1.6–1.7 ps which corresponds to the period of oscillation in the 3rd tier IP state. The participation of the 3rd tier state in the dynamics is also confirmed by the splitting of lines in the excitation spectrum of the Rydberg state which is similar to the spacing between states of the vibrational manifold of the 3rd tier IP state at the given excitation energy.
The formation of Rydberg atoms I(5s25p46s1) arising in the neutral dissociation channels proceeds on a picosecond time scale with a characteristic time of 7–8 ps for different channels. This time roughly corresponds to the lifetime of a wavepacket in the 2nd tier state. We conclude that the appearance of Rydberg atoms results mainly from predissociation of the 2nd tier IP state via crossings with the corresponding Rydberg states.
All channels leading to dissociation of two-photon excited I2 are characterized by an anisotropy parameter β ≈ 0 in the angular distribution of recoil directions similarly to the results of our previous nanosecond experiments. From a classical simulation we infer that this is not due to an averaging effect caused by the rotation of the excited molecule. To explain this value of the anisotropy parameter we suppose that direct two-photon excitation via multiple pathways involving intermediate states of different symmetry dominates over a stepwise process.
Drastically different angular anisotropy (β = 0.6–0.7) is observed for the atom pair I(2P3/2) + I(2P1/2) with TKER corresponding to one-photon excitation as compared to earlier nanosecond experiments (β = −1.05 ± 0.07). This difference is attributed to a three-photon (two-photon pump – one-photon dump) process dominating the dynamics in the fs experiments over one-photon excitation.
Acknowledgements
Financial support for this work by the Deutsche Forschungsgemeinschaft (Grant No. MU 2347/9-2 and IRTG 2079) and by the Russian Foundation for Basic Research (Grant No. 14-03-91331 and 15-03-03204) is gratefully acknowledged.References
- J. C. D. Brand and A. R. Hoy, Appl. Spectrosc. Rev., 1987, 23, 285 CrossRef CAS.
- R. J. Donovan, R. V. Flood, K. P. Lawley, A. J. Yencha and T. Ridley, Chem. Phys., 1992, 164, 439 CrossRef CAS.
- T. Ridley, D. A. Beattie, M. C. R. Cockett, K. P. Lawley and R. J. Donovan, Phys. Chem. Chem. Phys., 2002, 4, 1398 RSC.
- A. Kalemos, A. Valdes and R. Prosmiti, J. Phys. Chem. A, 2012, 116, 2366 CrossRef CAS PubMed.
- V. A. Alekseev, Opt. Spectrosc., 2014, 116, 329 CrossRef CAS.
- P. O'Keefe, D. Stranges and P. L. Houston, J. Chem. Phys., 2007, 127, 144309 CrossRef PubMed.
- A. S. Bogomolov, B. Gruener, S. A. Kochubei, M. Mudrich and A. V. Baklanov, J. Chem. Phys., 2014, 140, 124311 CrossRef PubMed.
- R. M. Bowman, M. Dantus and A. H. Zewail, Chem. Phys. Lett., 1989, 161, 297 CrossRef CAS.
- M. Dantus, M. H. M. Janssen and A. H. Zewail, Chem. Phys. Lett., 1991, 181, 281 CrossRef CAS.
- J. J. Larsen, N. J. Morkbak, J. Olesen, N. Bjerre, M. Machholm, S. R. Keiding and H. Stapelfeldt, J. Chem. Phys., 1998, 109, 8857 CrossRef.
- V. V. Lozovoy, S. A. Antipin, F. E. Gostev, A. A. Titov, D. G. Tovbin, O. M. Sarkisov, A. S. Vetchinkin and S. Y. Umanskii, Chem. Phys. Lett., 1998, 284, 221 CrossRef CAS.
- P. Farmanara, H. H. Ritze, V. Stert and W. Radloff, Chem. Phys. Lett., 1999, 307, 1 CrossRef CAS.
- A. Scaria, V. Namboodiri, J. Konradi and A. Materny, J. Chem. Phys., 2007, 127, 144305 CrossRef CAS PubMed.
- H. Schmidt, J. von Vangerow, F. Stienkemeier, A. S. Bogomolov, A. V. Baklanov, D. M. Reich, W. Skomorowski, C. P. Koch and M. Mudrich, J. Chem. Phys., 2015, 142, 044303 CrossRef CAS PubMed.
- A. T. J. B. Eppink and D. H. Parker, Rev. Sci. Instrum., 1997, 68, 3477 CrossRef CAS.
- G. A. Garcia, L. Nahon and I. Powis, Rev. Sci. Instrum., 2004, 75, 4989 CrossRef CAS.
- A. Kramida, Yu. Ralchenko, J. Reader, and NIST ASD Team (2014). NIST Atomic Spectra Database (ver. 5.2), [Online]. Available: http://physics.nist.gov/asd [2015, October 8]. National Institute of Standards and Technology, Gaithersburg, MD.
- D. Hanstorp and M. Gustafsson, J. Phys. B: At., Mol. Opt. Phys., 1992, 25, 1773 CrossRef CAS.
- R. J. Donovan, A. C. Flexen, K. P. Lawley and T. Ridley, Chem. Phys., 1998, 226, 217 CrossRef CAS.
- P. J. Wilson, T. Ridley, K. P. Lawley and R. J. Donovan, Chem. Phys., 1994, 182, 325 CrossRef CAS.
- A. V. Baklanov, L. M. C. Janssen, D. H. Parker, L. Poisson, B. Soep, J.-M. Mestdagh and O. Gobert, J. Chem. Phys., 2008, 129, 214306 CrossRef PubMed.
- L. D. Landau and E. M. Lifshitz, Quantum Mechanics: Non-Relativistic Theory, Pergamon Press, 3rd edn, 1977, vol. 3 Search PubMed.
- K. P. Lawley, T. Ridley, Z. Min, P. J. Wilson, M. S. N. Al-Kahali and R. J. Donovan, Chem. Phys., 1995, 197, 37 CrossRef CAS.
- R. J. Le Roy, Level 8.0: A Computer Program for Solving the Radial Schrodinger Equation for Bound and Quasibound Levels, University of Waterloo Chemical Physics Research Report CP-663, 2007.
- R. S. Mulliken, J. Chem. Phys., 1971, 55, 288 CrossRef CAS.
| This journal is © the Owner Societies 2016 |