DOI:
10.1039/C6CP01872F
(Communication)
Phys. Chem. Chem. Phys., 2016,
18, 13741-13745
Heat transport through a solid–solid junction: the interface as an autonomous thermodynamic system
Received
20th March 2016
, Accepted 25th April 2016
First published on 26th April 2016
Abstract
We perform computational experiments using nonequilibrium molecular dynamics simulations, showing that the interface between two solid materials can be described as an autonomous thermodynamic system. We verify the local equilibrium and give support to the Gibbs description of the interface also away from the global equilibrium. In doing so, we reconcile the common formulation of the thermal boundary resistance as the ratio between the temperature discontinuity at the interface and the heat flux with a more rigorous derivation from nonequilibrium thermodynamics. We also show that thermal boundary resistance of a junction between two pure solid materials can be regarded as an interface property, depending solely on the interface temperature, as implicitly assumed in some widely used continuum models, such as the acoustic mismatch model. Thermal rectification can be understood on the basis of different interface temperatures for the two flow directions.
Introduction
The autonomous or self-contained thermodynamic nature of the interface has long been a topic of discussion.1–4 This is not surprising as the interface between two material phases ceases to exist in the absence of the materials that make it up. While some studies5,6 support the idea that it is a two-dimensional thermodynamic system,1,4 others reject it.2,3
The discussion originates in the formulation first made by Gibbs.7 He proposed that the interface is an autonomous thermodynamic system, when described by excess densities, and that thermodynamic relationships can be written for these variables. The interface is autonomous in the sense that all its properties are univocally determined by such local variables. The description was developed under equilibrium conditions, but later it has been used successfully out of global equilibrium as well8 to model, in particular, the liquid–vapor phase transitions.5,6,9 In nonequilibrium, these assumptions imply that an interface can sustain a temperature, which is both compatible with its thermodynamic definition and is a local (i.e. different from the surroundings) property that follows from its autonomous character. All excess densities of an autonomous interface will depend on this temperature and not on the temperatures in the adjacent phases. The autonomous nature of a solid–solid interface provides a rigorous justification for tabulating the Kapitza resistance as a junction property, which is independent of the applied thermal bias and where the relevant variable is the interface temperature.
The reluctance in adopting this picture, rather than conceptual, was mostly due to the difficulty of measuring such an interface temperature. Accordingly, under nonequilibrium conditions it was natural to assign to the interface an average temperature, hiding its autonomous nature and hinting that its properties depend on the overall thermodynamic conditions, e.g. the thermal bias, rather than on its own thermodynamic variables.
Numerical simulations have supported the formulation of Gibbs, which implies a local equilibrium at the interface.5,6,9 Support has also been obtained from diffuse interface theories.10–12 However, all these results were obtained for the liquid–vapor interface. In this paper we provide evidence that this property also holds for solid–solid interfaces by performing a controlled set with computational experiments of the Si/Ge interface, namely the prototypical semiconductor heterojunction in many nanotechnology applications of current interest. In doing so, we also give a rigorous theoretical foundation to the common formulation of the Kapitza resistance.
Computational methods
We perform nonequilibrium molecular dynamics (NEMD) simulations of a Si/Ge interface with a bond-order potential.13,14 We use a timestep of 0.7 fs and run the simulation for 5.25 ns. The nonequilibrium conditions when performing our investigation are achieved by connecting the ends of the computational cell with two Nosé–Hoover thermostats at temperatures TH and TC, with TH > TC, and letting the rest of the system evolve without additional constraints. In this way, a temperature gradient builds up along the transport direction15 and the steady state is reached after approximately 1 ns. The heat current is calculated as the energy per unit time that each thermostat exchanges with the rest of the system. The fact that these quantities are equal in magnitude and opposite in sign for the two thermostats, i.e. the hot reservoir injects the same amount of energy that the cold reservoir extracts, is taken as an additional proof that a robust steady state is reached. Heat flows along the [100] crystallographic direction, which we take to be the x-axis (see Fig. 1a for a sketch of the computational setup).16 We study a sample made by 110 × 5 × 5 replicas of the 8-atom unit cell of a diamond crystal with a pseudomorphic lattice parameter a0 = (aSi + aGe)/2 = 5.54 Å. A 5 × 5 cross-section has been previously shown to yield a converged value for Si bulk systems.17 The selected cell length Lx along the transport direction, on the other hand, is well below the maximum mean free path of microscopic heat carriers in the corresponding bulk systems. Systematic studies showed that large cells are indeed needed as well to obtain a quantitative estimate of interface properties,18 despite their rather local character.15 Nevertheless, here we are concerned with a proof of concept investigation on the character of the interface as a system, rather than with predicting exact values for some specific interface quantity. Therefore, while the absolute numbers that we here calculate and discuss are likely system-dependent, the general conclusions drawn about the autonomous thermodynamic nature of the Si/Ge interface will be robust.
 |
| | Fig. 1 (a) Computational setup. The central region, where a thermal gradient builds up and all magnitudes are averaged, is sandwiched by the thermostats and by two frozen regions. Periodic boundary conditions are applied along the direction perpendicular to heat flow. (b) Average first-neighbor distances as a function of x. The inset shows a magnified view of the interface region; the interface is displayed as a shaded region and the boundary between Si and Ge is indicated by a dashed line. More than two standard deviations from the bulk values (horizontal dashed lines) are taken as an indicator of being in the interface region. In these sketches Si lies to the left of the interface and Ge to the right. (c) A typical temperature profile, T(x), along the heat transport direction (TH = 500 K and TC = 100 K, in this case). The interface temperature, Ts, is calculated from the average kinetic energy of the atoms belonging to the interface region; Ti and To (see the text) are estimated by extrapolating the linear fit of T(x) in the Si and Ge regions up to the interface boundaries (see the magnified views of the insets). | |
Definition of the interface
The first step of our study is the definition of the interface. For a solid–solid interface the actual implementation of the above Gibbs formulation can be simply recast in terms of a suitable structural property P(x), assuming different bulk-like values in the left and right lead far away from the interface. We therefore proceed as follows. We carried out a structural relaxation to find the optimal internal geometry of the Si/Ge heterojunction, at constant volume. Periodic boundary conditions were applied along the directions perpendicular to the heat transport. We used a standard conjugate gradient algorithm and considered that the system was relaxed when all the forces on the atoms were lower than 0.001 eV Å−1. Next we calculated the average first nearest-neighbor distance in regions of thickness a0 as a function of x and used its variation across the Si/Ge boundary to define the Gibbs interface. The results are plotted in Fig. 1b. Far enough from the ends and from the interface the density is constant and, in each of the halves, has the same value as in bulk Si and bulk Ge. A segment of material whose average first next-neighbor distance deviates more than two standard deviations from the reference value is considered as belonging to the interface.
This procedure gives an estimate of the interface thickness of 16.6 Å, i.e. 12 layers of the diamond lattice. It also leads to the interesting result that the interface region lies entirely in the Si half of the system, i.e. the last Ge bilayer, right before the heterojunction, has the same structural features as bulk Ge and relaxation effects all take place in Si. Therefore, the chemical interface (where the chemical identity of the atoms that occupy the zinc-blende lattice changes, dashed line in Fig. 1b) and the thermodynamic interface (defined through the variation of a suitable property P(x), shaded area in Fig. 1b) do not match. Notice that this conclusion is not general and depends on specific conditions (choice of lattice parameter, constant volume), which nevertheless reflect a possible experimental situation, of these calculations. Yet, these results show that such a decoupling is at least in principle possible.
Thermodynamic autonomy of the interface
Once the interface has been defined, we verify the hypothesis of local equilibrium. We have studied the internal energy Us under different thermodynamic conditions. We first run a series of equilibrium MD runs. In order to allow comparisons with nonequilibrium calculations we use the NEMD configuration illustrated in Fig. 1a also at equilibrium, but set both thermostats at the same temperature. Next, we perform a similar set of calculations, but this time we apply ΔT = 200 K. The values of the mean temperature (TH + TC)/2 are then set the same as in the equilibrium calculations. In both cases we calculate the average internal energy of the interface:where Esk and Esp are obtained by summing the kinetic and potential energies per atom over all the atoms that we established belonged to the interface region, thus obtaining the kinetic and potential energies of the interface region. The temperature of the interface region, Ts, is determined from the average kinetic energy 〈Esk〉 of the atoms therein as:| |  | (2) |
where kB is the Boltzmann constant (of course in the equilibrium calculations Ts = TH = TC, within numerical errors). All time averages are taken over the last 3 ns of the simulation.
In Fig. 2 we plot the internal energy of the interface as a function of the interface temperature for both the equilibrium and nonequilibrium conditions, which result in a qualitative and quantitative agreement, within the accuracy of the calculation. This result strongly supports the view of the solid–solid interface as an autonomous thermodynamic system. Our calculations show that no matter what the overall thermodynamic conditions of the system are, and we tested this hypothesis under conditions as different as equilibrium and nonequilibrium, the internal energy of the interface only depends on its temperature and not on the overall thermal bias conditions. These results also support that the local equilibrium, one of the underlying assumptions of nonequilibrium thermodynamics and thermodynamic modeling at large, holds. In other words, one can define a small enough piece of material which can be considered in equilibrium and assign to it a temperature, obeying T = (∂U/∂S)V,N, even under considerably out-of-equilibrium conditions. In what follows, to further test the hypothesis of local equilibrium, we calculate the thermal boundary resistance under different nonequilibrium conditions. Notice that the derivative of the internal energy with respect to the temperature at constant volume is the heat capacity, i.e. the amount of heat required to change the temperature of a given system by one degree. We can therefore define and calculate the heat capacity of the interface as
| |  | (3) |
 |
| | Fig. 2 Internal energy of the interface as a function of the interface temperature under equilibrium and non-equilibrium conditions. | |
We found that the heat capacity of the interface was the same at equilibrium and nonequilibrium, and for the system studied, we estimated CsV to be 29 J K−1 mol−1. We performed the same calculation, but restricting this time to a region of Si sufficiently far from the interface and the cell boundary, obtaining a value of 33 J K−1 mol−1. We understand that both values of the heat capacity calculated at the interface and far away from it are not accurate since the present simulations do not have any quantum features, unlike that included in the more precise prediction in ref. 19 for bulk-like Si. Furthermore, the structure investigated here has, by construction, a pseudomorphic lattice meaning that both Si and Ge slabs are in fact under strain, so that the actual value of their heat capacity is expected to differ from the bulk-like one. Nevertheless, we remark that their relative difference (as large as 15%) is in fact meaningful, carrying important qualitative information, namely, the additional proof of the thermodynamic autonomy of the interface with respect to the neighboring bulk-like regions.
If the interface is an autonomous thermodynamic system, its thermal resistance can be treated as a system variable that depends solely on the interface temperature. To calculate the interface thermal resistance we need the temperature discontinuity across the interface. We then extrapolate the linear dependence of T(x) in the Si and Ge regions to the interface boundaries and obtain Ti and To (see Fig. 1c); the linear fits are performed conveniently far from the thermostats and from the interface. The ratio of the temperature jump
and the heat flux is the Kapitza resistance and it is customarily used as a measure of interface thermal resistance.
20–23
The present nonequilibrium thermodynamics approach proceeds along a different path. At the interface, the entropy production associated with the transport of heat9 is
| |  | (5) |
where
Ji(
Jo) is the heat flux entering (exiting) the interface and
Ti and
To are the temperatures of the boundaries of the interface, as defined in
Fig. 1c. In the stationary state
Ji =
Jo =
J and the resulting force–flux relations read
| |  | (6) |
| |  | (7) |
The coefficients in these equations are interface resistivity coefficients and have the dimensionality of a resistivity of a bulk homogeneous phase times a length (the interface thickness);
rs,i(
rs,o) is the resistivity to heat flux between the material on the left (right) side and the interface. It follows that the interface thermal resistance is
| |  | (8) |
emphasizing the fact that the actual thermal driving force is the inverse temperature.
9
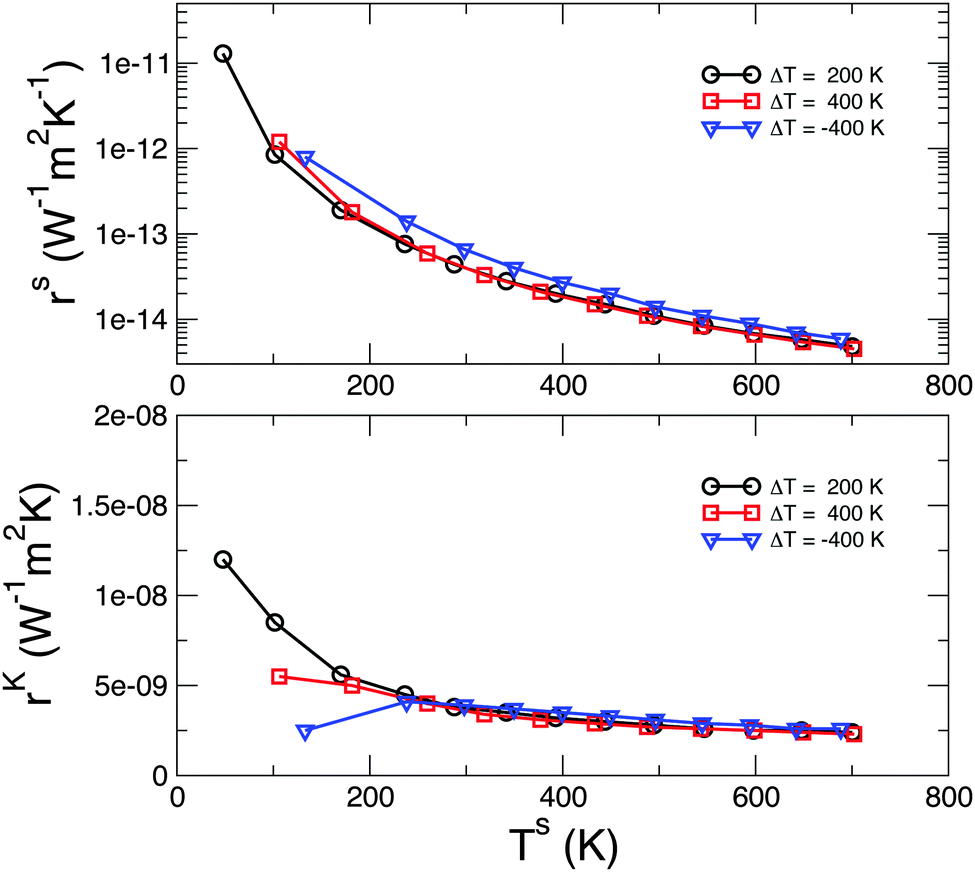
We use eqn (8) to calculate rs for different nonequilibrium conditions. We apply ΔT of 200 and 400 K and a reverse bias of ΔT = −400 K. In each case we consider several average temperatures (TH + TC)/2 in order to sample many interface temperatures, Ts. In Fig. 3 we plot rs as a function of Ts. This plot shows clearly that rs indeed depends only on Ts: irrespective of the overall thermodynamic conditions, each value of Ts is associated with a corresponding rs. We make the same plot for the more common Kapitza resistance, rK = ΔTs/J (bottom panel), and obtain very similar conclusions. Indeed, rK can be obtained, to the lowest order in the temperature difference, from rs by multiplying it by (Ts)2, as shown in Table 1.
 |
| | Fig. 3 (Top) Interface thermal resistance calculated from eqn (8). (Bottom) Kapitza resistance calculated as ΔTs/J. The need for better statistics at low temperature results in minor discrepancies for Ts > 200 K (not appreciable in the log-scale of the upper panel). | |
Table 1 Comparison between the Kapitza resistance and the renormalized interface thermal resistance of eqn (8) in the case of ΔT = 200 K. A renormalization factor of TiTo would yield strictly the same values. Here we use (Ts)2, a more consistent choice within the formalism of nonequilibrium thermodynamics, which gives only an approximate (in general  ) though excellent, agreement (unless at the lowest temperature studied). Resistance units are in m2 K W−1
|
T
s
|
r
K
|
r
s(Ts)2 |
| 47.7 |
1.2 × 10⁻⁸ |
3.0 × 10⁻⁸ |
| 101.4 |
8.5 × 10⁻⁹ |
8.7 × 10⁻⁹ |
| 169.8 |
5.6 × 10⁻⁹ |
5.4 × 10⁻⁹ |
| 236.3 |
4.5 × 10⁻⁹ |
4.3 × 10⁻⁹ |
| 287.5 |
3.8 × 10⁻⁹ |
3.6 × 10⁻⁹ |
| 341.4 |
3.5 × 10⁻⁹ |
3.3 × 10⁻⁹ |
| 392.7 |
3.2 × 10⁻⁹ |
3.1 × 10⁻⁹ |
| 443.7 |
3.0 × 10⁻⁹ |
2.9 × 10⁻⁹ |
| 494.6 |
2.8 × 10⁻⁹ |
2.7 × 10⁻⁹ |
| 546.7 |
2.6 × 10⁻⁹ |
2.5 × 10⁻⁹ |
| 597.8 |
2.5 × 10⁻⁹ |
2.4 × 10⁻⁹ |
| 647.7 |
2.5 × 10⁻⁹ |
2.4 × 10⁻⁹ |
| 700.2 |
2.4 × 10⁻⁹ |
2.4 × 10⁻⁹ |
If one writes Fourier's law, in its integral form, for the entire system
| | ΔT = −![[scr R, script letter R]](https://www.rsc.org/images/entities/char_e531.gif) totSJ totSJ | (9) |
where
tot is the total thermal resistance and
S the cross-section, and compares it with
eqn (8), it is straightforward to show that
| |  | (10) |
Hence the temperature discontinuity, Δ
Ts, should be linear in the applied temperature bias, Δ
T, for a given value of the interface temperature
Ts (notice that
TiTo ∼ (
Ts)
2). For this purpose we performed an additional series of NEMD calculations where, for (
TH +
TC)/2 = 300 K, we varied Δ
T =
TH −
TC. The results, displayed in
Fig. 4b, also confirmed that these additional conditions were nicely fulfilled. Notice, however, that the interface temperature is only approximately constant throughout the investigated range of Δ
T (see
Fig. 4a); consequently, Δ
Ts exhibits a small, but non-negligible superlinearity.
 |
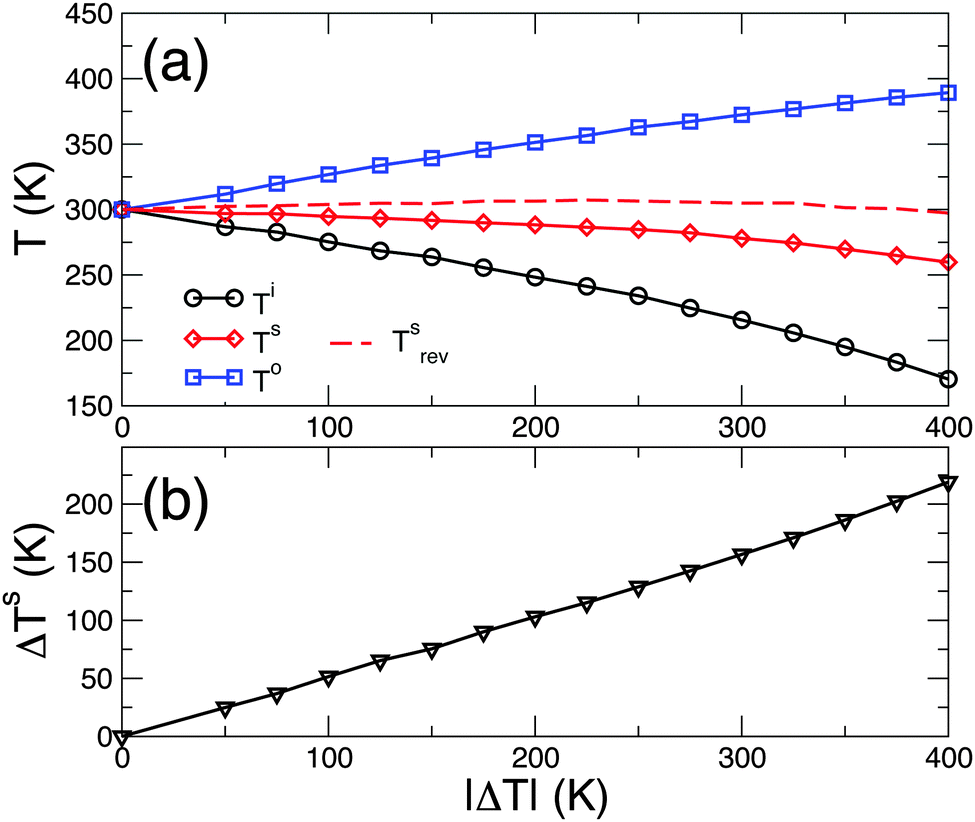
| | Fig. 4 Temperature of the interface, Ts, and the interface boundaries, Ti and To, (top) and temperature discontinuity, ΔTs, as a function of the applied thermal bias (bottom). The applied bias is such that (TH + TC)/2 = 300 K. Tsrev in the top panel is the interface temperature in the case of reverse thermal bias, i.e. negative ΔT. | |
We conclude our study with a final remark on thermal rectification, i.e. the preferential flow of heat in one direction.24 Previous studies have demonstrated that the different temperature dependences of the thermal conductivity of two materials result in some degree of rectification when they are brought together and form a junction.15,25–28 The role of the interface itself in the rectification, however, has thus far been neglected. Here we have shown that rs depends univocally on Ts. The latter, nonetheless, depends on how the overall thermal bias TH − TC is split between the two materials: the more their thermal resistances differ, the farther Ts will be from the mean temperature (TH + TC)/2 (see ref. 28 for a simple model). Consequently, a different temperature dependence of the thermal conductivity of the two materials results also in a different Ts upon forward or reverse bias. This is clearly seen in Fig. 4, where we have plotted Ts also in the case of a reverse bias ΔT = −400 K: the interface temperatures are different, when compared with the case of forward bias ΔT = 400 K, thus the interface resistances rs(Ts) will also be different and will contribute to the thermal rectification.
Conclusions
In summary, we have shown that a Si–Ge solid–solid interface can be regarded as an autonomous thermodynamic system, with interface properties that depend solely on the interface temperature. On the basis of structural relaxation it was possible to identify the interfacial region as a 16.6 Å thick layer in the Si adjacent to the chemical junction between Si and Ge. The interface temperature is obtained from the average kinetic energy of this region. The results follow from application of the thermodynamic driving forces as defined in nonequilibrium thermodynamics for this region. We have also shown that the commonly used Kapitza resistance can be related to the thermal boundary resistance rigorously derived within nonequilibrium thermodynamics.
Acknowledgements
We acknowledge financial support from the Ministerio de Economía y Competitividad (MINECO) under grant no. FIS2012-37549-C05-02, MAT2013-40581-P, TEC2012-31330 and TEC2015-67462-C2-1-R (co-funded by the EU under the FEDER program), the Generalitat de Catalunya under grant no. 2014 SGR 301 and 2014 SGR 384, and the Spanish MINECO through the Severo Ochoa Centres of Excellence Program under grant no. SEV-2013-0295 and SEV-2015-0496 and from the Research Council of Norway under Project no. 221672. The Department of Chemistry, Faculty of Science and Technology, Norwegian University of Science and Technology supported ØW, TT, DB, and SK.
References
-
G. Bakker, Handbuch der Experimentalphysik, Akad. Verlag, Leipzig, Germany, 1928, vol. 6, ch. 10 Search PubMed.
-
R. Defay and I. Prigogine, Surface Tension and Absorption, Longmans and Green, London, 1966 Search PubMed.
-
J. S. Rowlinson and B. Widom, Molecular Theory of Capillarity, Oxford University Press, Oxford, 1982 Search PubMed.
-
E. A. Guggenheim, Thermodynamics, North-Holland, Amsterdam, 7th edn, 1985 Search PubMed.
- A. Rosjorde, D. W. Fossmo, D. Bedeaux, S. Kjelstrup and B. Hafskjold, J. Colloid Interface Sci., 2000, 232, 178–185 CrossRef CAS PubMed.
- E. Johannessen and D. Bedeaux, Physica A, 2003, 330, 354–372 CrossRef.
-
J. W. Gibbs, The Scientific Papers of J. W. Gibbs, Dover, New York, 1961 Search PubMed.
- D. Bedeaux, A. M. Albano and P. Mazur, Physica A, 1976, 82, 438–462 CrossRef.
-
S. Kjelstrup and D. Bedeaux, Non-Equilibrium Thermodynamics of Heterogeneous Systems, World Scientific, Singapore, 2008 Search PubMed.
- K. S. Glavatskiy and D. Bedeaux, Phys. Rev. E, 2009, 79, 031608 CrossRef CAS PubMed.
- E. Magnanelli, Ø. Wilhelmsen, D. Bedeaux and S. Kjelstrup, Phys. Rev. E, 2014, 90, 032402 CrossRef PubMed.
- Ø. Wilhelmsen, T. T. Trinh, A. Lervik, V. K. Badam, S. Kjelstrup and D. Bedeaux, Phys. Rev. E, 2016, 93, 032801 CrossRef PubMed.
- J. Tersoff, Phys. Rev. B, 1989, 39, 5566–5568 CrossRef.
- S. Plimpton, J. Comput. Phys., 1995, 117, 1–19 CrossRef CAS.
- R. Rurali, X. Cartoixà and L. Colombo, Phys. Rev. B, 2014, 90, 041408 CrossRef.
- In this case study we do not consider dislocations or other line defects that often form in Si/Ge interfaces to release the stress induced by the lattice mismatch. Atomically abrupt, defect-free Si/Ge interfaces, however, can be obtained in nanowire axial junctions.29,30.
- C. Melis, R. Dettori, S. Vandermeulen and L. Colombo, Eur. Phys. J. B, 2014, 87, 96 CrossRef.
- K. R. Hahn, M. Puligheddu and L. Colombo, Phys. Rev. B, 2015, 91, 195313 CrossRef.
- L. J. Porter, S. Yip, M. Yamaguchi, H. Kaburaki and M. Tang, J. Appl. Phys., 1997, 81, 96–106 CrossRef CAS.
- P. L. Kapitza, J. Phys., 1941, 4, 181–210 Search PubMed.
- G. L. Pollack, Rev. Mod. Phys., 1969, 41, 48–81 CrossRef CAS.
- M. E. Lumpkin, W. M. Saslow and W. M. Visscher, Phys. Rev. B, 1978, 17, 4295–4302 CrossRef CAS.
- D. G. Cahill, W. K. Ford, K. E. Goodson, G. D. Mahan, A. Majumdar, H. J. Maris, R. Merlin and S. R. Phillpot, J. Appl. Phys., 2003, 93, 793–818 CrossRef CAS.
- M. Terraneo, M. Peyrard and G. Casati, Phys. Rev. Lett., 2002, 88, 094302 CrossRef CAS PubMed.
- C. Marucha, J. Mucha and J. Rafałowicz, Phys. Status Solidi A, 1975, 31, 269–273 CrossRef CAS.
- K. Balcerek and T. Tyc, Phys. Status Solidi A, 1978, 47, K125–K128 CrossRef CAS.
- C. Dames, J. Heat Transfer, 2009, 131, 061301 CrossRef.
- X. Cartoixà, L. Colombo and R. Rurali, Nano Lett., 2015, 15, 8255–8259 CrossRef PubMed.
- H. Geaney, E. Mullane, Q. M. Ramasse and K. M. Ryan, Nano Lett., 2013, 13, 1675–1680 CrossRef CAS PubMed.
- M. Amato, M. Palummo, R. Rurali and S. Ossicini, Chem. Rev., 2014, 114, 1371–1412 CrossRef CAS PubMed.
|
| This journal is © the Owner Societies 2016 |
Click here to see how this site uses Cookies. View our privacy policy here. 
 Open Access Article
 This Open Access Article is licensed under a
  *a,
Luciano
Colombo
abc,
Xavier
Cartoixà
d,
Øivind
Wilhelmsen
ef,
Thuat T.
Trinh
e,
Dick
Bedeaux
e and
Signe
Kjelstrup
*e
*a,
Luciano
Colombo
abc,
Xavier
Cartoixà
d,
Øivind
Wilhelmsen
ef,
Thuat T.
Trinh
e,
Dick
Bedeaux
e and
Signe
Kjelstrup
*e


 ) though excellent, agreement (unless at the lowest temperature studied). Resistance units are in m2 K W−1