
 Open Access Article
 This Open Access Article is licensed under a
 Creative Commons Attribution 3.0 Unported Licence
Correlating structure and electronic band-edge properties in organolead halide perovskites nanoparticles†
Qiushi
Zhu
a,
Kaibo
Zheng
bc,
Mohamed
Abdellah
bd,
Alexander
Generalov
e,
Dörthe
Haase
e,
Stefan
Carlson
e,
Yuran
Niu
e,
Jimmy
Heimdal
e,
Anders
Engdahl
e,
Maria E.
Messing
f,
Tonu
Pullerits
*b and
Sophie E.
Canton
*gh
aDepartment of Synchrotron Radiation Instrumentation, Lund University, Box 118, 22100, Lund, Sweden
bDepartment of Chemical Physics, Lund University, Box 124, 22100, Lund, Sweden. E-mail: tonu.pullerits@chemphys.lu.se
cGas Processing Center, College of Engineering, Qatar University, P.O. Box 2713, Doha, Qatar
dDepartment of Chemistry, Qena Faculty of Science, South Valley University, Qena 83523, Egypt
eMAX IV Laboratory, Lund University, Box 118, 22100, Lund, Sweden
fDepartment of Solid State Physics, Lund University, Box 118, 22100, Lund, Sweden
gIFG Structural Dynamics of (Bio)chemical Systems, Max Planck Institute for Biophysical Chemistry, Am Fassberg 11, D-37077 Goettingen, Germany. E-mail: sophie.canton@desy.de
hFS-SCS, Structural Dynamics with Ultra-short Pulsed X-rays, Deutsches Elektronensynchrotron DESY, Notkestrasse 85, D-22607 Hamburg, Germany
First published on 10th May 2016
Abstract
After having emerged as primary contenders in the race for highly efficient optoelectronics materials, organolead halide perovskites (OHLP) are now being investigated in the nanoscale regime as promising building blocks with unique properties. For example, unlike their bulk counterpart, quantum dots of OHLP are brightly luminescent, owing to large exciton binding energies that cannot be rationalized solely on the basis of quantum confinement. Here, we establish the direct correlation between the structure and the electronic band-edge properties of CH3NH3PbBr3 nanoparticles. Complementary structural and spectroscopic measurements probing long-range and local order reveal that lattice strain influences the nature of the valence band and modifies the subtle stereochemical activity of the Pb2+ lone-pair. More generally, this work demonstrates that the stereochemical activity of the lone-pair at the metal site is a specific physicochemical parameter coupled to composition, size and strain, which can be employed to engineer novel functionalities in OHLP nanomaterials.
Introduction
Organolead halide perovskites (OLHP) encompass a family of emerging hybrid materials where the basic structural motif consists of a lead (Pb) cation and six halide anions X (X = Br, I, Cl) that form a corner-sharing network of inorganic [PbX6]4− octahedra, with the organic moieties occupying the voids. Combining the highly-tunable properties of inorganic semiconductors with the chemical versatility of organic components,1–12 OLHPs have been enabling drastic progress in the rapidly expanding field of nanoscale optoelectronics. Their introduction in the novel generations of photovoltaic, LED, and lasing devices has resulted in remarkable boosts of photoconversion efficiency.13–26 A primary bottleneck to further optimization, especially in lighting applications, has been clearly identified as their low photoluminescence (PL) quantum yields (QY) under moderate illumination at room temperature.27 A significant breakthrough was achieved with the synthesis of stabilized 6 nm MAPbBr3 (MA = CH3NH3+) nanoparticles (NPs) by adapting the hot-injection method routinely employed for preparing various II–VI quantum dots (QDs).28,29 The PLQY of these free-standing colloids was increased to 17%, indicating that the systematic exploration of the nanoscale in OLHP building blocks should uncover innovative routes for improving their performances. With the recent development of a ligand-assisted reprecipitation technique, brightly-luminescent QDs of MAPbX3 have been synthesized.30 Their unprecedented PLQY reaching 70% has been ascribed to a large exciton binding energy (EBE), which has been itself related to their very small size (∼3.3 nm). Although quantum confinement can certainly be expected upon size reduction on the basis of the particle-in-a-box model, the EBE values reported so far are surprisingly high.28,31–33 This is quite remarkable in 6–10 nm OLHPs NPs of MAPbBr3 and MAPbI3, which have respective Bohr radius of 1.45–2.0 nm and 2.2–2.8 nm.4,30,34 Such an observation strongly suggests that a specific mechanism other than quantum confinement is at play in OLHP NPs. The present work demonstrates that the electronic band-edge properties and the resulting high EBE of these nanostructures are governed by a strain-induced shift of the valence band and a concurrent reduction of the stereochemical activity of the Pb2+ s2 lone-pair. In a first step, the crystalline structure and the short-range order in microcrystals (MCs) and NPs (∼8.2 nm) of MAPbBr3 are investigated with TEM, X-ray diffraction (XRD), X-ray absorption spectroscopy (XAS) and Fourier transform infrared (FTIR) spectroscopy. These measurements give direct evidence for a global lattice compression and a reduced local intra-octahedron distortion within the NPs as compared to the MCs. In a second step, the electronic band edge characteristics of the MCs and NPs are extracted using XAS and high energy X-ray photoemission spectroscopy (XPS). The coupling between the various structural and electronic parameters is analyzed in the frame of the so-called revised lone-pair model for the stereochemical activity at the cation site. The multiscale structure of the NPs can be readily correlated to the nature and position of the valence band and to the enhanced localization of the Pb2+ s2 lone-pair, which both have a direct impact on their electronic and optical properties. The consequences of these particular instances of strain-induced band edge modifications are outlined and generalized for the future optimization of OLHP nanomaterials.Results
Comparing morphology and structures of MAPbBr3 MCs and NPs
The MCs and NPs of MAPbBr3 were synthesized according to the published protocols.28 In the NP synthesis, the concentration of precursors was specifically optimized so as to minimize the formation of unwanted 2D nanoplatelet impurities (for details about the synthesis see ESI1†).In the SEM image of Fig. 1(a), the MCs appear as polygonic disks with thickness of 1.6 μm and mean diameter 15 μm. As shown in the TEM image of Fig. 1(b), the NPs exhibit spherical morphologies. The histogram of size distribution extracted for 100 NPs can be fitted by a Gaussian function and indicates a mean diameter of 8.2 nm, with a FWHM of 6.9 nm.
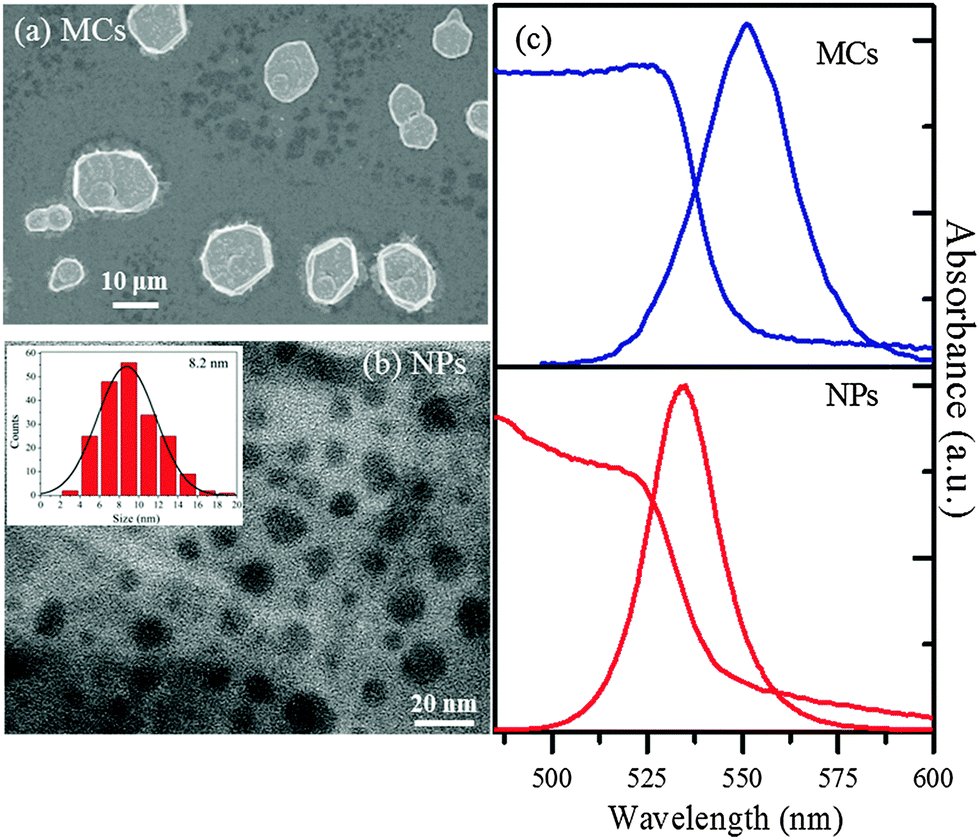 | ||
| Fig. 1 (a) SEM image of the MCs on a glass substrate. (b) TEM image of the as-obtained NPs. (Inset) Size distribution histogram of the NPs fitted with a Gaussian curve. (c) Ground state UV-Vis absorption and photoluminescence spectra of the MAPbBr3 MCs and NPs. | ||
The steady-state UV-vis spectrum of the MCs (Fig. 1(c)) displays an absorption edge at 530 nm (2.340 eV), while the emission is centered at 551 nm, yielding a Stokes shift of 13 nm. In contrast, the absorption edge of the NPs is found at 522 nm (2.375 eV), i.e. 8 nm blue shifted compared to the MCs. The emission spectrum is centered at around 530 nm, with a Stokes shift of about 8 nm. The small blue shifts in the NPs absorption and emission spectra indicate a relatively weak confinement.
The XRD patterns of the MCs and the NPs are shown in Fig. 2(a). Both curves display the typical perovskite-type crystal structure.1,5,8,35 The XRD pattern of the MCs differs from the one reported for MAPbBr3 single crystal belonging to the perfect cubic Pm![[3 with combining macron]](https://www.rsc.org/images/entities/char_0033_0304.gif) m symmetry, as demonstrated by the significant intensity in the (110) and (211) peaks (details see ESI2†).1,5,8,35 Considering that the intensity of peak (210) is larger than that of (200), it can be proposed that the crystalline structure of the MCs belongs to the non-centrosymmetric pseudocubic tetragonal P4mm space group. This means that the micrometer-sized MCs are already slightly strained when compared to the single crystals. A similar symmetry lowering of the unit cell from cubic Pmm to pseudocubic P4mm has been reported in the α-phase of bulk MAPbI3 when this material is subjected to pressure or temperature changes.36
m symmetry, as demonstrated by the significant intensity in the (110) and (211) peaks (details see ESI2†).1,5,8,35 Considering that the intensity of peak (210) is larger than that of (200), it can be proposed that the crystalline structure of the MCs belongs to the non-centrosymmetric pseudocubic tetragonal P4mm space group. This means that the micrometer-sized MCs are already slightly strained when compared to the single crystals. A similar symmetry lowering of the unit cell from cubic Pmm to pseudocubic P4mm has been reported in the α-phase of bulk MAPbI3 when this material is subjected to pressure or temperature changes.36
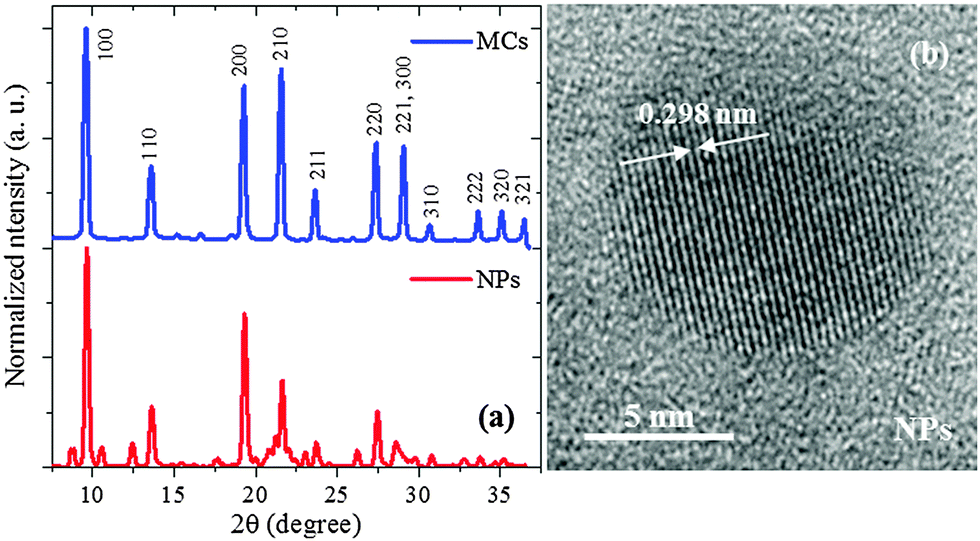 | ||
| Fig. 2 (a) XRD patterns obtained for the MCs and NPs. (b) HRTEM of one NP, showing the atomic layer alignment of the (002) planes separated by 2.98 Å. | ||
The Rietveld refinement of the MCs XRD pattern confirms the assignment to the P4mm group and yields the lattice constants a = b = c = 5.912(2) Å as shown in Fig. 3a. The details of the refinement are given in ESI3 and ESI4.† This structural analysis is in agreement with a previous study of similar powder MCs material.35 Hereafter, this refined structure is referred to as Structure 1 (Fig. 3b). Considering now the XRD pattern of the NPs, the absence of significant broadening indicates good crystalline order, which is also supported by the clear interference fringes from the lattice planes in the HRTEM image (Fig. 2(b)). Since the positions of the diffraction peaks match the ones of the MCs, it can be assumed as a first approximation that the crystalline structure exhibited by the NPs also belongs to the P4mm group. The lattice constants are fitted to a = b = c = 5.898(2) Å, i.e. they are reduced by 3.5% as compared to the ones of the MCs. This indicates a considerable compression of the unit cell, which would be equivalent to the application of a hydrostatic pressure of 0.3 GPa (for details see ESI5†). It should be noted here that lattice strain has been widely reported in semiconductor NPs, where it can be induced by numerous and often interrelated factors such as formation of core–shell heterostructures or influence of the capping agent.37,38
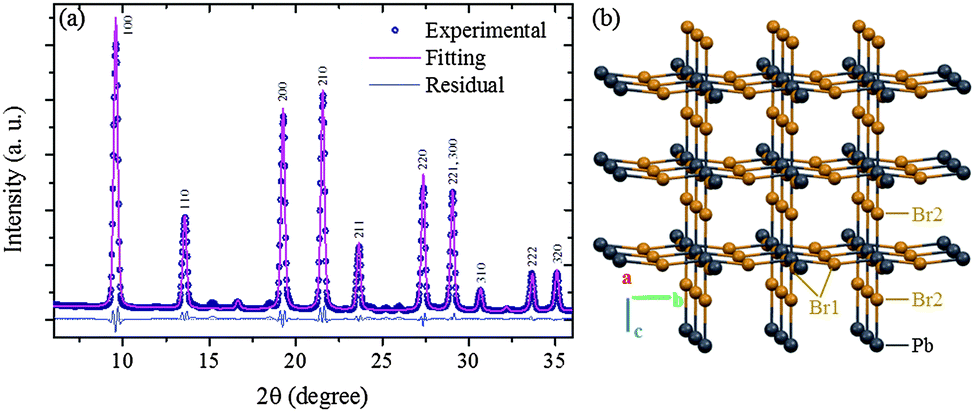 | ||
| Fig. 3 (a) Rietveld refinement performed on the experimental XRD of the MCs. The hkl indices assigned to each diffraction peak are indicated (for details of the refinement see ESI3 and ESI4†). (b) Refined lattice framework of the MCs (Structure 1), the MA moieties are omitted for clarity. | ||
It is well-known that the crystalline structure detected in OHLP materials with XRD might not always reflect the short-range order due to the critical influence of the organic moiety. For example, in most OHLP samples (e.g. MAPbBr3, MAPbI3, MAPbCl3, MASnCl3), the long-range structures are usually classified as ideal Pmm, although the materials exhibit significant short-range octahedral tilting and intra-octahedron deformations.39 These distortions can be characterized by transverse and parallel displacements of X along the Pb–X–Pb bonds and of Pb along the X–Pb–X bonds, respectively. This is why, in the present work, complementary information was obtained with XAS, which is an element sensitive technique that probes the local bonding environment around a specific absorbing atom.
Fig. 4a shows the normalized X-ray absorption coefficient μ(E) at the Br K edge, corresponding to the ionization of a 1s core electron. The Fourier transform (FT) of the EXAFS oscillation χ weighted by k2 (where k is the photoelectron wavevector, Fig. 4b) is shown in Fig. 4c. Considering the structure of the MCs obtained from XRD (Fig. 3(b)), the local environment of Pb can be described as quasi-octahedral with two different Pb–Br2 bonding distances along the c axis and four equal Pb–Br1 distances in the ab plane. The Pb is off-centered, with a Br1–Pb–Br1 angle of 167.15(38) degree in the (110) plane. Taking this structural motif (denoted O1) as the initial guess of the XAS fitting, the extracted bond distances are 2.627 ± 0.02, 3.067 ± 0.02 and 2.924 ± 0.02 Å in excellent agreement with the ones obtained from XRD (the details of the fitting procedure are given in the ESI6†). For the NPs, μ(E) (Fig. 4a), and FT of k2·χ (Fig. 4b) are very similar to the ones of the MCs, indicating that the local bonding environments of Pb are closely related in the two materials. The peak observed around 5–6 Å in the FT arises from the multiple scattering of the photoelectron within the higher coordination shells. It has distinctively larger amplitude for the NPs than for the MCs. Since the two measurements were performed at the same temperature, the difference can be ascribed to an apparent reduction of the structural disorder in the NPs. It should be emphasized here that the expected presence of defects in the NPs would actually increase the structural disorder, hence contribute to a decrease of the 5–6 Å feature. Considering the extreme dependency of the multiple scattering amplitudes upon departure of atomic arrangements from linearity,40 the Br1–Pb–Br1 angle should be closer to 180° in the NPs. This yields to the proposition of motif O2 for the local geometry of [PbX6]4− (Fig. 4c). The global Structure 2 (details see ESI7†) is built by assembling motif O2 in the P4mm phase, as suggested by XRD.
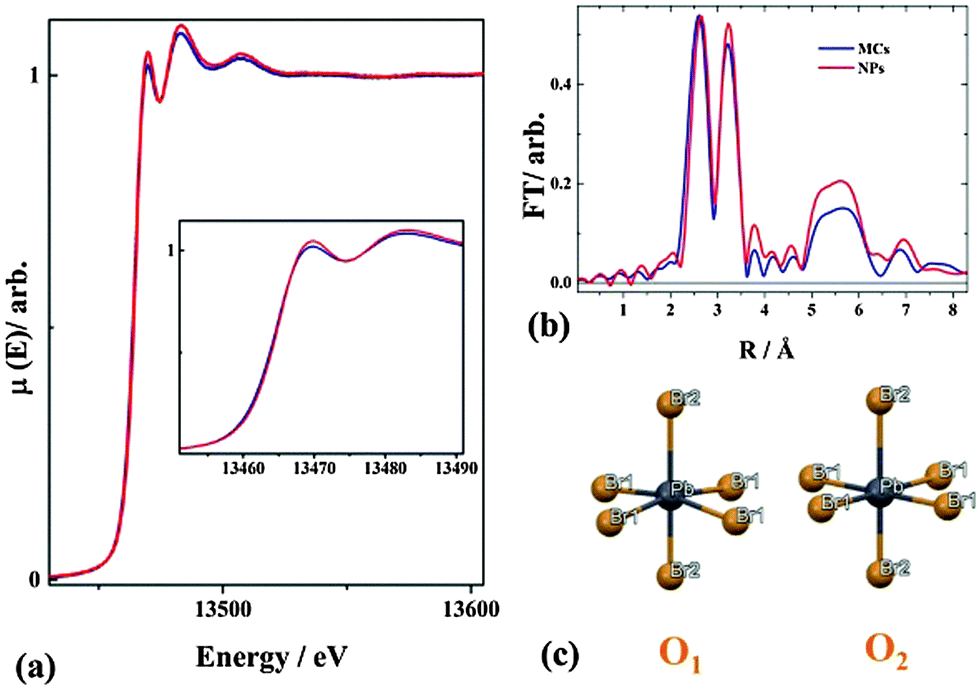 | ||
| Fig. 4 (a) Normalized X-ray absorption coefficient at the Br K edge for the MCs and the NPs. The inset zooms on the near-edge region (b) Fourier transform amplitudes of k2 weighted EXAFS oscillation χ as a function of the photoelectron wavevector k. (c) Proposed structural motif for the MCs (O1), and the NPs (O2). | ||
Additional support for the proposed Structure 2 can be obtained by examining the XANES regions at the Br-K edge and Pb-L3 edge, which are very sensitive to the coupling between electronic and geometric structures. The features appearing at the Pb-L3 absorption edge can be assigned to the dipole-allowed transition from 2p to empty 6d orbitals in the Pb2+ ions. The features at the Br-K absorption edge are attributed to the transition from a 1s electron to empty 4p (pre-edge) and 5p (near-edge) orbitals in the Br− ion. At both edges, the spectra of the NPs show no obvious energy shift when compared to the MCs, indicating that the formal oxidation state remains the same. Whereas no alteration is observed in the XANES region at the Pb edge, the white line of Br-K spectrum (indicated by the arrow in Fig. 5(b)) is clearly higher for the NPs than for the MCs.
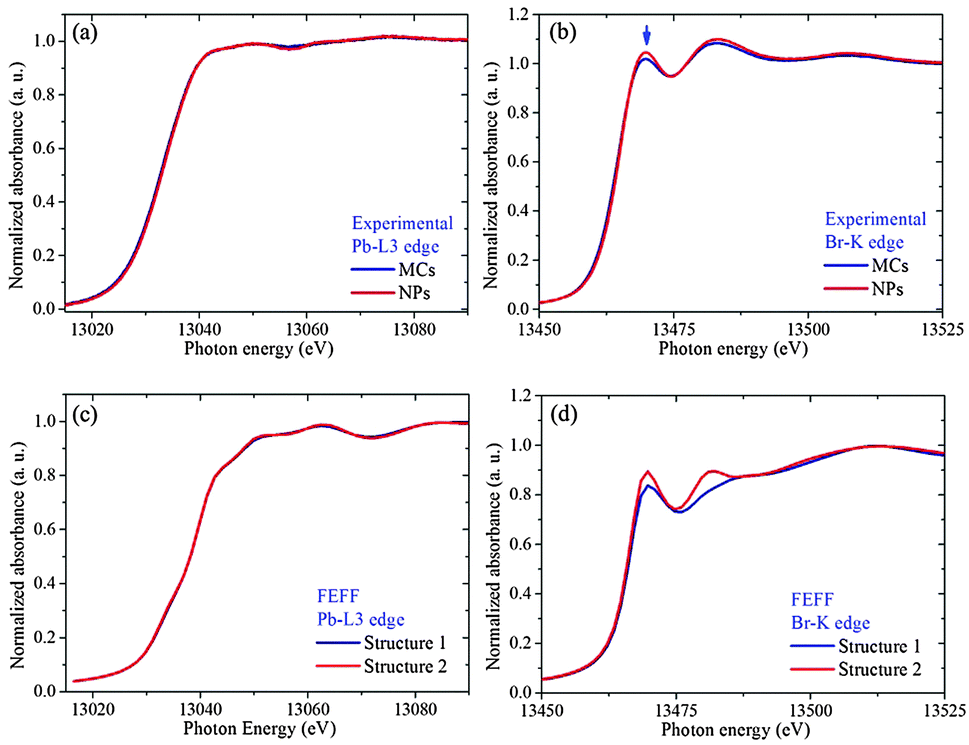 | ||
| Fig. 5 Experimental XANES spectra of MCs and NPs at Br-K (a) and Pb-L3 (b) edges, with the FEFF9.0 calculation (c) and (d) based on Structure 1 Br1–Pb–Br1 angle 167.15°, based on the more distorted octahedron O1, and Structure 2 Br1–Pb–Br1 angle 180°, based on the less distorted octahedron O2. | ||
In order to establish that this difference can be related to the change in Br1–Pb–Br1 angle suggested by the EXAFS and XRD results, the local densities of states (lDOS) have been calculated using FEFF 9.0.41 The simulated results based on Structure 1 and 2 at the Pb-L3 and Br-K edges are displayed in Fig. 5(c) and (d), respectively. The Pb-L3 edge shows no obvious difference between the two structures, while Structure 2 gives a higher white line than Structure 1. This confirms that the decrease in Pb off-centering [PbX6]4− can account for the subtle but reproducible differences in the XANES fingerprints.
In addition, the XRD pattern simulated for Structure 2 further illustrates that the slight reduction in transverse displacement of Pb along the Br–Pb–Br bond can explain the observed trends. In particular, the intensity of the (200) peak is now becoming slightly larger than that of the (210) peak (see ESI3†). It should also be noted that according to the combined XAS and XRD fitting results, the two Br2 and Pb atoms are always found on a single line, i.e. no octahedral tilting occurs along the a or b axis. In addition, all Br1 atoms along the b direction and the Pb atoms are in the same plane, i.e. no octahedral tilting occurs along the c axis. (For details about bond distances and angles in two structures, see ESI4†). In terms of electronic structure, the pre-edge at the Br K edge monitors the density of Br 4p holes, which is known to be influenced by the degree of covalendy with Pb2+. The higher intensity in the NCs as compared to the MCs indicates that the Br center is overall less negatively charged. In other words, when the Pb–Br–Pb is close to 180°, hybridization between Pb 6s, 6p an Br 4p orbitals does not take place, and the overall charge sharing between Pb and Br is more extensive (see below for additional arguments).
Finally, it is well-documented that the complex interaction between the organic unit and inorganic octahedra also influences the lattice parameters.12 The interplay is partly governed by the hydrogen bonding between the NH3+ group of the MA cation and the electronegative halide atoms.36,42 Information about the quasi rigid organic moiety can be obtained with FTIR spectroscopy.35Fig. 6 shows the spectra of MAPbBr3 MCs and NPs. The bands at 1712 cm−1 solely observed in the spectrum of the NPs can be assigned to the C![[double bond, length as m-dash]](https://www.rsc.org/images/entities/char_e001.gif) O stretch within the oleic acid (OA) capping agent, while the bands at 2854 and 2925 cm−1 are ascribed to the stretching of CH2 in OA and octadecylammonium (OTA) for the NPs. The characteristic lines of the C–N stretching (969 cm−1) and N–CH3 stretching (1466, 1480 cm−1) in the organic MA ion are shifted to lower wavenumbers in the NPs spectrum, indicating a weakening of the corresponding bonds. The broad band at 3150–3200 cm−1 is attributed to the N–H stretching mode of the NH3+ group in MA once H is bonded.43 The positions of the N–H stretch bands are very sensitive to the strength of the hydrogen bonding in MA salts N+–H⋯X.44,45 The relative intensity ratio between this N–H stretching band and the characteristic N–CH3 and C–N stretching bands is much lower in the NPs than in the MCs, while its position shifts to lower wavenumber. This means that both the contribution and the strength of the hydrogen bonds in the NPs are reduced when compared to the MCs sample.
O stretch within the oleic acid (OA) capping agent, while the bands at 2854 and 2925 cm−1 are ascribed to the stretching of CH2 in OA and octadecylammonium (OTA) for the NPs. The characteristic lines of the C–N stretching (969 cm−1) and N–CH3 stretching (1466, 1480 cm−1) in the organic MA ion are shifted to lower wavenumbers in the NPs spectrum, indicating a weakening of the corresponding bonds. The broad band at 3150–3200 cm−1 is attributed to the N–H stretching mode of the NH3+ group in MA once H is bonded.43 The positions of the N–H stretch bands are very sensitive to the strength of the hydrogen bonding in MA salts N+–H⋯X.44,45 The relative intensity ratio between this N–H stretching band and the characteristic N–CH3 and C–N stretching bands is much lower in the NPs than in the MCs, while its position shifts to lower wavenumber. This means that both the contribution and the strength of the hydrogen bonds in the NPs are reduced when compared to the MCs sample.
 | ||
| Fig. 6 FTIR spectra of MAPbBr3 MCs and NPs. | ||
To summarize, the detailed study of the long-range and short-range order in the MCs and NPs reveals significant structural differences, which can be characterized by considerable lattice compression and reduced intra-octahedron Pb2+ off-centering in the nanomaterial. This is accompanied by an overall decrease in hydrogen bonding of the MA cations. This basic information can be employed to analyze the electronic structures, as outlined in the next section.
Comparing the electronic structure of MAPbBr3 MCs and NPs
The energy positions of the valence band (VB) are established for the MCs and the NPs from the XPS spectra displayed in Fig. 7. The surface sensitivity of the measurement was minimized by using an incident X-ray photon energy of 1000 eV and a normal photoemission geometry, which both guarantee an escape depth of ∼2.4 nm for the outgoing electrons. The photoionization cross-sections of the orbitals that contribute at the chosen photon energy reinforce the dominance of Br and Pb characters over minor C and O from possible surface contamination (for details about photoionization cross section, see ESI8†).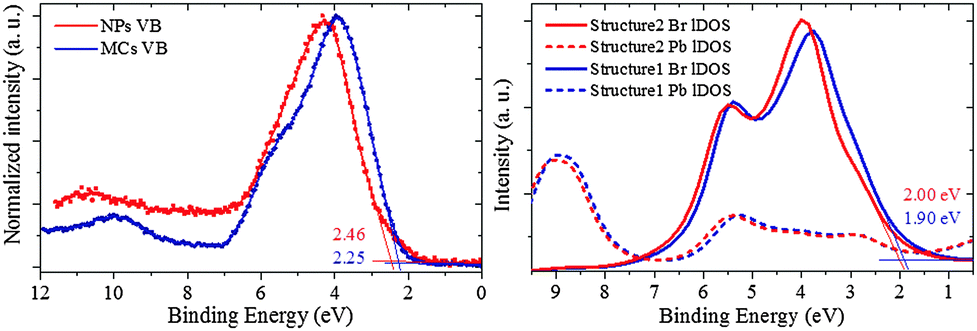 | ||
| Fig. 7 (left) VB spectrum of MCs and NPs for an incident X-ray photon energy 1000 eV. The VBM is obtained from the intersection point between the extrapolation of the linear region of the rising edge and the base line, as indicated by the blue straight lines of NPs. (right) Density of state calculation in the VB region for the MCs and the NPs on proposed Structure 1 and 2 using FEFF 9.0. | ||
The VB of the NPs exhibits a clear shift towards higher binding energy. The VB maximum (VBM) of the NPs is 2.46 ± 0.05 eV, i.e. 0.21 eV larger than that of the MCs (here, the error bar was estimated from repeated measurements on different spots of the sample area). Additional XPS measurements at a PEEM instrument with microscopy capability confirmed that the VB features can be attributed to the main NPs phase without any contribution from the sparse 2D nanoplatelets impurities (for details, see ESI9†). Moreover, the VB of the MCs displays a two-component-profile, with a main peak at ∼3.8 eV, and a shoulder at ∼5.7 eV. In the NPs, this shoulder is not observed. The VBM shift is qualitatively reproduced with lDOS calculations based on the Structure 1 and 2 shown in Fig. 7(b) using FEFF9.0. It should be noted that, aside from the reorganization of Structure 1 into Structure 2 driven by size reduction and strain, other factors are expected to contribute to the absolute shift of the VBM, such as dielectric confinement and additional compression originating from the capping agent at the surface, as will be discussed below.
A complementary view into the charge redistribution that takes place in the NPs is obtained through XPS experiments probing the photoemission from the Pb and Br core levels. Fig. 8(a) presents the well-resolved Pb 4f emission lines. For both samples, Pb 4f7/2 is located at 139.00 ± 0.05 eV, and Pb 4f5/2 at 143.90 ± 0.05 eV, with a spin–orbit splitting of 4.9 eV. The respective Br 3d3/2 and 3d5/2 lines are displayed in Fig. 8(b). They exhibit well-resolved spin–orbit structure, with a constant splitting value of ∼1.0 eV. The photoemission spectrum of the NPs is shifted by 0.15 eV towards higher binding energy (BE) compared to the MCs, indicating that the Br ions are more effectively charged (i.e. with a reduced electron density). A constant BE for the Pb lines and an increased BE for the Br lines is the signature of a bonding rearrangement at the Pb ion from non-spherical (i.e. hemidirected) to quasi-spherical (i.e. holodirected), which is in agreement with an evolution from Structure 1 to Structure 2 as discussed below. This finding can be linked to the increased intensity of the pre-edge feature at the Br K edge, which has evidenced a more efficient charge transfer between the Pb and the Br centers in the NPs.
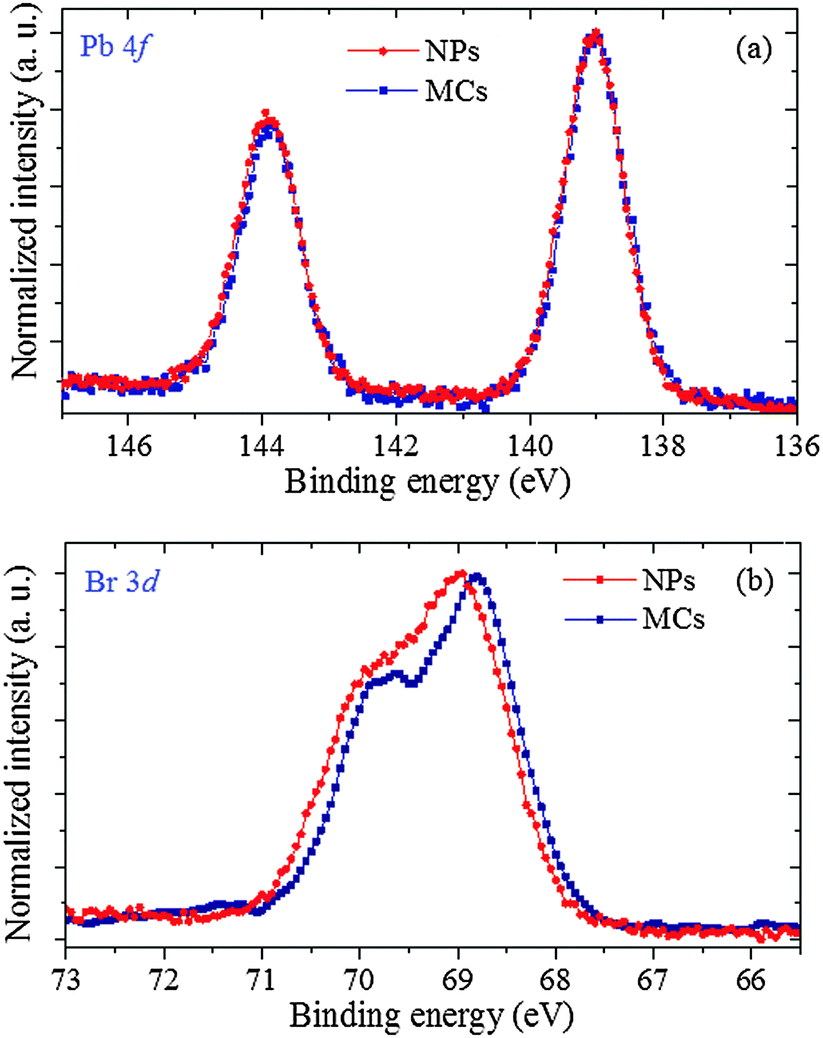 | ||
| Fig. 8 XPS core emission of Pb 4f doublet (a) and Br 3d doublet (b). | ||
The coupling between the electronic and geometric structures of the MCs and NPs can now be examined in a more general framework as described in this section. For the particular case of a [PbBr6]4− unit, the HOMO should mainly consist in the antibonding combination of Pb 6s and Br 4p orbitals. In a perfect MX6 octahedron, the s and p orbitals of M cannot mix, owing to stringent selection rules associated to symmetry upon inversion. However, when the metal possesses a pair of ns2 electrons in the valence shell (the so-called lone-pair), as does Pb2+ and the divalent elements of group 14, M is usually observed to be off-centered within the X6 cage. A long-standing explanation for this distortion has been associated to the stereochemical activity of the lone-pair: covalent hybridization of the metal s and p orbitals causes a non-spherical electronic distribution (i.e. hemidirected) and a resulting coordination distortion at the cation site. More recently, this model has been revised to rationalize the widely differing structural trends reported, e.g. for bulk perovskites. The p orbitals of the anion X are actually participating in the creation of a stereochemically active lone-pair.40,46–48
This revised lone-pair model is illustrated in Fig. 9(a). The strong interaction between the cation s and anion p orbitals induces the formation of a high-lying energy anti-bonding state with a considerable degree of cation s character. Local symmetry lowering allows for further interaction with the previously unoccupied cation p orbital so that the overall bonding combination is stabilized, while the asymmetric electron density drives the metal off-centering (Fig. 9(b)) with alternating long and short bonds within the octahedron.40 The hybridized lone-pair can be seen preferentially opposite to the short Pb bonds.
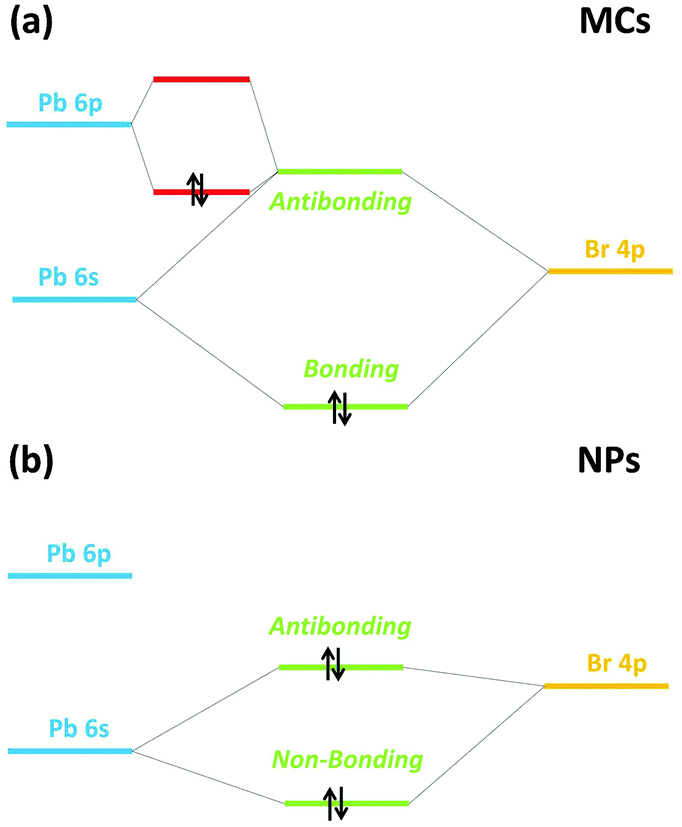 | ||
| Fig. 9 Revised lone-pair model (a) with stereochemical activity of the s2 electrons as in the MCs (b) without stereochemical activity of the s2 electrons as in the NPs. | ||
Generally, the lone-pair of Pb2+ in octahedral coordination is not stereochemically active, as seen in bulk MAPbBr3.6 Nevertheless, the off-centering observed in the XRD patterns of the MCs shows that the lone-pair has been weakly activated.
Comparing the experimental VB profile of the MCs in Fig. 7(a) with the simple molecular orbital diagram in Fig. 9(a) evidences that the band at ∼3.8 eV correlates with the HOMO of a [PbBr6]4− unit, which mainly consists in a combination of Pb 6s, Pb 6p and Br 4p orbitals (Fig. 9(a)) when the lone-pair is stereochemically active and the Pb is off-centered. Upon lattice compression triggered by size reduction and chemical pressure by the capping agent, the s2 electron density gets localized, diminishing its interaction with the anion p orbital so that the stereochemical activity of the lone-pair is suppressed (Fig. 7). This causes an overall energy lowering of the HOMO (Fig. 9(b)).
It should be noted that the effect of strain-induced pressure is very dependent upon the initial microscopic structure of the samples. For single crystal MAPbBr3 in the α-phase that belongs to the cubic Pmm space group,49 a strain-induced red shift of the band gap excitonic level has been observed. This phenomenon can be attributed to the fact that the [PbBr6]4− octahedra are centrosymmetric, with the Pb2+ ion found at the center of the halide cage, indicating that the lone-pair of Pb2+ is stereochemically inactive. Therefore, the VBM consists of the antibonding state of Pb 6s and Br 4p, and thus, the compressive strain only induces a red shift of the VBM without changing the nature of the hybridization, as proved by the calculation results presented in ref. 36. On the other hand, the pressure-induced blue shift of the band gap in the β-phase of bulk MAPbBr3 (tetragonal I4/mcm space group) measured in ref. 43 cannot be explained by the simulations in ref. 36. However, this could be considered as an indication of the contribution of the Pb 6p orbital to the VBM due to the stereochemical activity of the lone-pair in the lattice-distorted structure.
Discussion
The present work has demonstrated that the coupling between the electronic and geometric structures of the MAPbBr3 NPs can be traced back to a pronounced lattice compression and a switching-off of the Pb lone-pair activity as compared to the MCs. This reveals that the optoelectronic properties of OHLP NPs can be tailored through variations in morphology or micro- and nanostructure, even in the very weak quantum confinement regime. It is well-known that the band-edge electronic properties of type I and type II core–shell QDs can be tuned by composition and strain. For example, the choice of anion and cation governs the relative energy position of the valence and conduction bands. They both can be further modified by structural changes induced by external pressure or lattice mismatch in core–shell objects. Similar dependencies can be expected for the OHLP NPs, with additional impact from the stereochemical activity of the lone-pair, which is also influenced by these exact same physicochemical parameters. As seen in Fig. 9(a), the HOMO, the LUMO and the nature of the stereochemically active lone-pair depend upon the relative energy position of three levels, namely the s and p orbitals of the cation and p orbital of the anion, and their level of hybridization. The present work shows that the degree of stereochemical activity, which can be altered through composition and strain also balances the structural distortion, and consequently the energetics. As in all semiconductor core–shell QDs, the lattice compression observed for the OHLP NPs presented in this work originates concurrently from size reduction and influence from the capping agent. However, this interaction is expected to be much more complex in the OHLP NPs due to the possible local replacement of the organic cation by the capping agent.11 Since the organic shell can also be envisaged as an interfacial layer, it can further affect the net dielectric confinement, hence the electronic and conduction properties.Finally, the EBE is clearly governed by the structure-dependent VB maximum and CB minimum, by the formation of defects with associated trapping sites and by the limited quantum confinement induced by size reduction itself. As such, the larger EBE reported for the NPs can be satisfactorily explained by the structural and energetic correlations established in this work, including the compression induced deactivation of Pb lone-pair activity.29,50
Conclusions
In conclusion, the present study has elucidated the interplay between the structure and the band-edge properties of MAPbBr3 NPs. Collectively, the measurements and simulations have demonstrated that the large EBE of these NPs can be attributed to a strain-induced compression and a concurrent s2 electron density localization evidenced by a more regular coordination of the basic octahedral motif. This work also shows that large EBE should be expected to arise not only from the size reduction induced confinement, which exists in most QDs, but also when the size is not necessarily smaller or comparable to the Bohr radius, as a direct consequence of complex stereochemical interactions on several length scales. Establishing clear correspondences between the physicochemical trends exhibited at the nanoscale opens up for various strategies to design OHLP NPs with improved properties tailored towards specific applications.As the first study of the correlation between structural distortion, stereochemical activity of the s2 metal lone-pair, and electronic band edge structure, this work is paving the way for the realization of strain induced tuning of the band gap in OHLP NPs by replacing capping agent or by forming various core–shell structures.
Acknowledgements
The study was financially supported by the Knut and Alice Wallenberg Foundation and the Swedish Research Council. Collaboration within the NanoLund consortium is acknowledged. Q. Z. and K. Z. acknowledge support from by NPRP grant # NPRP7-227-1-034 from the Qatar National Research Fund (a member of Qatar Foundation). S. E. C. acknowledges funding from SFB 1073. The help from Dr Trudy Bolin at the 9-BM beamline of APS, USA is also greatfully acknowledged.References
- O. Knop and R. Wasylishen, Can. J. Chem., 1990, 68, 412–422 CrossRef CAS.
- K. Jackson, Phys. Rev. B: Condens. Matter Mater. Phys., 1993, 44, 889–893 Search PubMed.
- T. Ishihara, J. Lumin., 1994, 61, 269–274 CrossRef.
- I. Koutselas, J. Phys.: Condens. Matter, 1996, 5953, 8–9 Search PubMed.
- H. Mashiyama and Y. Kurihara, J. Korean Phys. Soc., 1998, 32, 156–158 Search PubMed.
- I. P. P. Swainson, R. P. P. Hammond, C. Soullière, O. Knop and W. Massa, J. Solid State Chem., 2003, 176, 97–104 CrossRef CAS.
- L. Chi, I. Swainson, L. Cranswick, J.-H. Her, P. Stephens and O. Knop, J. Solid State Chem., 2005, 178, 1376–1385 CrossRef CAS.
- C. C. Stoumpos, C. D. Malliakas and M. G. Kanatzidis, Inorg. Chem., 2013, 52, 9019–9038 CrossRef CAS PubMed.
- J. Even, L. Pedesseau, J.-M. Jancu and C. Katan, J. Phys. Chem. Lett., 2013, 4, 2999–3005 CrossRef CAS.
- F. Brivio, A. B. Walker and A. Walsh, APL Mater., 2013, 1, 042111 CrossRef.
- C. Wehrenfennig, M. Liu, H. J. Snaith, M. B. Johnston and L. M. Herz, APL Mater., 2014, 2, 081513 CrossRef.
- J. M. Frost, K. T. Butler, F. Brivio, C. H. Hendon, M. van Schilfgaarde and A. Walsh, Nano Lett., 2014, 14, 2584–2590 CrossRef CAS PubMed.
- H.-S. Kim, C.-R. Lee, J.-H. Im, K.-B. Lee, T. Moehl, A. Marchioro, S.-J. Moon, R. Humphry-Baker, J.-H. Yum, J. E. Moser, M. Grätzel and N.-G. Park, Sci. Rep., 2012, 2, 591 Search PubMed.
- G. Hodes, Science, 2013, 342, 317–319 CrossRef CAS PubMed.
- S. D. Stranks, G. E. Eperon, G. Grancini, C. Menelaou, M. J. P. Alcocer, T. Leijtens, L. M. Herz, A. Petrozza and H. J. Snaith, Science, 2013, 342, 341–344 CrossRef CAS PubMed.
- J. Burschka, N. Pellet, S.-J. Moon, R. Humphry-Baker, P. Gao, M. K. Nazeeruddin and M. Grätzel, Nature, 2013, 499, 316–319 CrossRef CAS PubMed.
- I. Grinberg, D. V. West, M. Torres, G. Gou, D. M. Stein, L. Wu, G. Chen, E. M. Gallo, A. R. Akbashev, P. K. Davies, J. E. Spanier and A. M. Rappe, Nature, 2013, 503, 509–512 CrossRef CAS PubMed.
- M. Liu, M. B. Johnston and H. J. Snaith, Nature, 2013, 501, 395–398 CrossRef CAS PubMed.
- P. Docampo, J. M. Ball, M. Darwich, G. E. Eperon and H. J. Snaith, Nat. Commun., 2013, 4, 2761 Search PubMed.
- O. Malinkiewicz, A. Yella, Y. H. Lee, G. M. Espallargas, M. Graetzel, M. K. Nazeeruddin and H. J. Bolink, Nat. Photonics, 2013, 8, 128–132 CrossRef.
- Q. Chen, H. Zhou, Z. Hong, S. Luo, H. Duan, H. Wang, Y. Liu, G. Li and Y. Yang, J. Am. Chem. Soc., 2014, 136, 622–625 CrossRef CAS PubMed.
- V. Gonzalez-Pedro and E. Juarez-Perez, Nano Lett., 2014, 14, 888–893 CrossRef CAS PubMed.
- H. P. Zhou, Q. Chen, G. Li, S. Luo, T.-b. B. Song, H.-S. S. Duan, Z. R. Hong, J. B. You, Y. S. Liu and Y. Yang, Science, 2014, 345, 542–546 CrossRef CAS PubMed.
- Z.-K. Tan, R. S. Moghaddam, M. L. Lai, P. Docampo, R. Higler, F. Deschler, M. Price, A. Sadhanala, L. M. Pazos, D. Credgington, F. Hanusch, T. Bein, H. J. Snaith and R. H. Friend, Nat. Nanotechnol., 2014, 9, 687–692 CrossRef CAS PubMed.
- G. Xing, N. Mathews, S. S. S. Lim, N. Yantara, X. Liu, D. Sabba, M. Grätzel, S. Mhaisalkar and T. C. Sum, Nat. Mater., 2014, 13, 476–480 CrossRef CAS PubMed.
- E. Dohner and A. Jaffe, J. Am. Chem. Soc., 2014, 136, 2–5 Search PubMed.
- A. Kojima, M. Ikegami, K. Teshima and T. Miyasaka, Chem. Lett., 2012, 41, 397–399 CrossRef CAS.
- L. Schmidt, A. Pertegas, S. Gonzalez-Carrero, O. Malinkiewicz, S. Agouram, G. M. Espallargas, H. J. Bolink, R. E. Galian and J. Perez-Prieto, J. Am. Chem. Soc., 2014, 136, 850–853 CrossRef CAS PubMed.
- L. Protesescu, S. Yakunin, M. I. Bodnarchuk, F. Krieg, R. Caputo, C. H. Hendon, R. X. Yang, A. Walsh and M. V. Kovalenko, Nano Lett., 2015, 15, 3692–3696 CrossRef CAS PubMed.
- F. Zhang, H. Zhong, C. Chen, X. Wu and X. Hu, ACS Nano, 2015, 3, 4533–4542 CrossRef PubMed.
- D. Di, K. P. Musselman, G. Li, A. Sadhanala, Y. Ievskaya, Q. Song, Z.-K. Tan, M. L. Lai, J. L. MacManus-Driscoll, N. C. Greenham and R. H. Friend, J. Phys. Chem. Lett., 2015, 6, 446–450 CrossRef CAS PubMed.
- R. E. Galian, S. G. Carrero and J. Perez-Prieto, J. Mater. Chem. A, 2014, 3, 9187–9193 Search PubMed.
- K. Zheng, Q. Zhu, M. Abdellah, M. E. Messing, W. Zhang, A. Generalov, Y. Niu, L. Ribaud, S. E. Canton and T. Pullerits, J. Phys. Chem. Lett., 2015, 6, 2969–2975 CrossRef CAS PubMed.
- K. Tanaka, T. Takahashi, T. Ban, T. Kondo, K. Uchida and N. Miura, Solid State Commun., 2003, 127, 619–623 CrossRef CAS.
- N. Onoda-Yamamuro, T. Matsuo and H. Suga, J. Phys. Chem. Solids, 1990, 51, 1383–1395 CrossRef CAS.
- M. T. Weller, O. J. Weber, P. F. Henry, A. M. Di Pumpo and T. C. Hansen, Chem. Commun., 2015, 51, 4180–4183 RSC.
- A. M. Smith, A. M. Mohs and S. Nie, Nat. Nanotechnol., 2009, 4, 56–63 CrossRef CAS PubMed.
- S. Wuister, J. Am. Chem. Soc., 2004, 126, 10397–10402 CrossRef CAS PubMed.
- R. Worhatch and H. Kim, Chem. Mater., 2008, 3, 1272–1277 CrossRef.
- U. V. Waghmare, N. a. Spaldin, H. C. Kandpal and R. Seshadri, Phys. Rev. B: Condens. Matter Mater. Phys., 2003, 67, 125111 CrossRef.
- J. J. Rehr, J. J. Kas, F. D. Vila, M. P. Prange and K. Jorissen, Phys. Chem. Chem. Phys., 2010, 12, 5503–5513 RSC.
- E. Mosconi, C. Quarti, T. Ivanovska, G. Ruani and F. De Angelis, Phys. Chem. Chem. Phys., 2014, 16, 16137–16144 RSC.
- K. Wang, R. Liu, Y. Qiao, J. Cui, B. Song and B. Liu, Arxiv, 2015.
- I. Oxton, O. Knop and J. Duncan, J. Mol. Struct., 1977, 38, 25–32 CrossRef CAS.
- A. Cabana and C. Sandorfy, Spectrochim. Acta, 1962, 18, 843–861 CrossRef CAS.
- D. J. Payne, R. G. Egdell, A. Walsh, G. W. Watson, J. Guo, P. Glans, T. Learmonth and K. E. Smith, Phys. Rev. Lett., 2006, 96, 157403 CrossRef CAS PubMed.
- A. Walsh, D. J. Payne, R. G. Egdell and G. W. Watson, Chem. Soc. Rev., 2011, 40, 4455–4463 RSC.
- L. Shimoni-Livny, J. Glusker and C. Bock, Inorg. Chem., 1998, 37, 1853–1867 CrossRef CAS.
- K. Matsuishi, T. Ishihara, S. Onari, Y. H. Chang and C. H. Park, Phys. Status Solidi, 2004, 241, 3328–3333 CrossRef CAS.
- N. Sestu, M. Cadelano, V. Sarritzu, F. Chen, D. Marongiu, R. Piras, M. Manias, F. Quochi, M. Saba, A. Mura and G. Bongiovanni, J. Phys. Chem. Lett., 2015, 6, 4566–4572 CrossRef CAS PubMed.
Footnote |
| † Electronic supplementary information (ESI) available: Detailed information of sample preparation, experimental procedure, XRD Rietveld refinement, XAS fitting. See DOI: 10.1039/c6cp01843b |
| This journal is © the Owner Societies 2016 |