 Open Access Article
Creative Commons Attribution 3.0 Unported Licence
Understanding the anomalous behavior of Vegard's law in Ce1−xMxO2 (M = Sn and Ti; 0 < x ≤ 0.5) solid solutions†
Tinku
Baidya‡
*ab,
Parthasarathi
Bera
*c,
Oliver
Kröcher
bd,
Olga
Safonova
b,
Paula M.
Abdala
e,
Birgit
Gerke
f,
Rainer
Pöttgen
f,
Kaustubh R.
Priolkar
g and
Tapas Kumar
Mandal
h
aSolid State and Structural Chemistry Unit, Indian Institute of Science, Bangalore 560012, India
bPaul Scherrer Institut, 5253 Villigen, Switzerland
cSurface Engineering Division, CSIR − National Aerospace Laboratories, Bangalore 560017, India. E-mail: partho@nal.res.in
dEcole Polytechnique Fédérale de Lausanne (EPFL), 1015 Lausanne, Switzerland
eSNBL, European Synchrotron Radiation Facility, 38043 Grenoble, France
fInstitut für Anorganische und Analytische Chemie, Universität Münster, Corrensstrasse 30, 48149 Münster, Germany
gDepartment of Physics, Goa University, Taleigao Plateau, Goa 403206, India
hDepartment of Chemistry and Centre of Nanotechnology, Indian Institute of Technology Roorkee, Roorkee 247667, India
First published on 15th April 2016
Abstract
The dependence of the lattice parameter on dopant concentration in Ce1−xMxO2 (M = Sn and Ti) solid solutions is not linear. A change towards a steeper slope is observed around x ∼ 0.35, though the fluorite structure (space group Fm3m) is preserved up to x = 0.5. This phenomenon has not been observed for Ce1−xZrxO2 solid solutions showing a perfectly linear decrease of the lattice parameter up to x = 0.5. In order to understand this behavior, the oxidation state of the metal ions, the disorder in the oxygen substructure and the nature of metal–oxygen bonds have been analyzed by XPS, 119Sn Mössbauer spectroscopy and X-ray absorption spectroscopy. It is observed that the first Sn–O coordination shell in Ce1−xSnxO2 is more compact and less flexible than that of Ce–O. The Sn coordination remains symmetric with eight equivalent, shorter Sn–O bonds, while Ce–O coordination gradually splits into a range of eight non-equivalent bonds compensating for the difference in the ionic radii of Ce4+ and Sn4+. Thus, a long-range effect of Sn doping is hardly extended throughout the lattice in Ce1−xSnxO2. In contrast, for Ce1−xZrxO2 solid solutions, both Ce and Zr have similar local coordination creating similar rearrangement of the oxygen substructure and showing a linear lattice parameter decrease up to 50% Zr substitution. We suggest that the localized effect of Sn substitution due to its higher electronegativity may be responsible for the deviation from Vegard's law in Ce1−xSnxO2 solid solutions.
Introduction
CeO2 has been extensively studied in the last few years with respect to its manifold functionalities. It is an attractive material for various catalytic, electronic, optical, electrical, electrochemical, gas sensing, and corrosion resistant applications.1–14 CeO2 based materials have been useful in auto-exhaust catalysis, hydrogen production, H2–O2 recombination, or electrodes in fuel cells.1–7,15–19 In auto-exhaust catalysis, CeO2 has been recognized as an important material because of its unique redox properties. Due to their excellent oxygen storage/release properties, CeO2 based oxides have been used as excellent supports for noble as well as transition metals promoting various catalytic reactions. The oxygen storage capacity (OSC) of CeO2 plays a unique role in mediating crucial oxygen exchange processes during catalytic reactions in auto-exhaust catalysis.1,20 In the efforts to enhance the OSC of CeO2 by various cation substitution reactions, the tetravalent cations such as Ti4+, Sn4+, and Zr4+ have been found to be effective in creating more labile oxygen through structural changes in the Ce1−xMxO2 solid solutions.4,21,22 Such substitutions of isovalent as well as aliovalent transition metals into the CeO2 matrix enhance the reducibility, thermal stability, oxygen storage capacity and catalytic activities of CeO2.4 The above-mentioned solid solutions have been used as supports for noble metals like Pt, Pd, Rh, and Ru leading to a better catalytic activity for a variety of reactions at comparatively low temperatures.4Hegde and coworkers have intensively investigated the structural and redox properties of Ce1−xMxO2 (M = Sn, Ti and Zr) solid solutions both experimentally and theoretically.23–27 It has been demonstrated that the substitution of isovalent cations in CeO2 creates significant distortions in the anion substructure, splitting eight equidistant oxygen neighbors in fluorite type CeO2 into 4 + 4 neighbors with different distances. The extent of dissolution of foreign cations forming solid solutions is confirmed by a linear change of the lattice parameter of the parent oxide as postulated by Vegard's law.28 However, careful examination of the lattice parameters at different concentrations of Ti, Zr and Sn have demonstrated unusual behavior. Although all these substituents are tetravalent, the change in the lattice parameter with the increase of Ti or Sn concentration deviates from linearity, while for Zr it is perfectly linear up to x = 0.5. This observation certainly questions the universal validity of Vegard's law in the present solid solutions and has motivated us to investigate this phenomenon in more detail.
Deviations from Vegard's law in solid solutions of ionic salts and ionic oxides have previously been discussed in the literature.29,30 The main explanations are related to limited solubility and microscopic cluster formation. Similar deviations from Vegard's type behavior have been observed for thin films of various solids.31,32 The present study is focused on the understanding of the anomalous behavior of the lattice parameter with the dopant concentration in Ce1−xSnxO2 solid solutions. The detailed characterization of these solutions has been done by X-ray powder diffraction (XRD), UV-Vis spectroscopy, X-ray photoelectron spectroscopy (XPS), 119Sn Mössbauer spectroscopy and X-ray absorption spectroscopy (XAS).
Experimental details
Ce1−xSnxO2 (x = 0.1–0.5) oxides were prepared by the solution combustion method using ceric ammonium nitrate ((NH4)2Ce(NO3)6·6H2O), tin oxalate (SnC2O4), and glycine (C2H5NO2) as precursors. The detailed method of preparation has been reported earlier.23 Similarly, Ce1−xZrxO2 oxides have been prepared by using stoichiometric amounts of ceric ammonium nitrate, zirconium nitrate (Zr(NO3)4·xH2O) and glycine.27 Using a similar method, Ce1−xTixO2 (x = 0.1–0.4) oxides were prepared by taking stoichiometric amounts of ceric ammonium nitrate, titanyl nitrate (TiO(NO3)2), and glycine.25Transmission electron microscopy (TEM) images were collected using a Hitachi HD-2700CS electron microscope with a cold field emission gun operated at 200 kV, a CEOS corrector system and an EDXS detector. For Ce and Sn elemental analysis, respective CeLα and SnLα emission lines were considered.
All bulk samples of the Ce1−xMxO2 (M = Sn, Ti and Zr) solid solutions were characterized by powder XRD employing a PANalytical X'Pert PRO X-Ray diffractometer operated under CuKα radiation of 1.5418 Å wavelength at 40 kV and 30 mA in the 2θ range 20–80°.
UV-Vis diffuse reflectance spectra (DRS) of Ce1−xMxO2 (M = Sn) solid solutions were recorded using a Shimadzu UV-2450 UV-Vis spectrophotometer in the wavelength range of 200–800 nm. For the UV-Vis DRS measurements, samples were mixed with BaSO4 in the sample to the BaSO4 ratio of 1![[thin space (1/6-em)]](https://www.rsc.org/images/entities/char_2009.gif) :
:![[thin space (1/6-em)]](https://www.rsc.org/images/entities/char_2009.gif) 100. The recorded reflectance data were converted to absorbance using the Kubelka–Munk (K–M)33 function. For the estimation of band gaps, a direct transition was considered in a Tauc plot34 with (αhν)2vs. hν.
100. The recorded reflectance data were converted to absorbance using the Kubelka–Munk (K–M)33 function. For the estimation of band gaps, a direct transition was considered in a Tauc plot34 with (αhν)2vs. hν.
The XPS of Ce1−xMxO2 (M = Sn and Ti) solid solutions were recorded using a SPECS spectrometer non-monochromatic AlKα radiation (1486.6 eV) as an X-ray source operated at 150 W (12.5 kV and 12 mA). All the spectra were obtained with a pass energy of 25 eV and a step increase of 0.05 eV. The CasaXPS program was employed for curve-fitting of the Ce3d core level spectra into several components with Gaussian–Lorentzian peaks after Shirley background subtraction. Peak positions, spin–orbit splitting, doublet intensity ratios, and full width at half maximum (FWHM) were fixed as given in the literature.35
A Ca119mSnO3 source was used for the Mössbauer spectroscopic experiments. The measurements were carried out at ambient temperature. A palladium foil of 0.05 mm thickness was used to reduce the Sn K X-rays concurrently emitted by this source. The samples were enclosed in small PMMA containers at a thickness corresponding to about 10 mg Sn per cm2. Fitting of the data was done by using the Normos-90 program package.36
X-ray absorption spectra at Sn and Ce K-edges were measured at SNBL (BM01B, European Synchrotron Radiation Facility, Grenoble, France) using the Si(111) double crystal monochromator. The sizes of the X-ray beam in the horizontal and vertical directions were 8 mm and 0.6 mm, respectively, giving the total beam intensity on the sample of about 1010 ph per s. Three ionization chambers were used and they were filled with Ar and Kr to produce the absorption of 20% for Io, 50% for It and Iref, where Io, It and Iref are intensities of incident, transmitted and reference beams, respectively. An optimal amount of sample powders was mixed with cellulose and pressed into pellets of 1.3 cm in diameter to measure the spectra in the transmission mode. The XAS were acquired in the continuous scanning mode. The as-recorded Ce and Sn K edge XAS data were reduced following the standard procedures in the Demeter program package.37
Ce L3-edge X-ray absorption near edge spectroscopy (XANES) measurements were performed at SuperXAS beamline of the Swiss Light Source (PSI, Villigen, Switzerland). The incident photon beam was selected using a Si(111) double crystal monochromator and the rejection of higher harmonics and focusing were achieved using a Si-coated collimating mirror at 2.8 mrad and a Rh-coated toroidal mirror at 2.8 mrad. The beamline was calibrated using a V foil (V K-edge at 5465 eV). The resulting spectra were reduced following standard procedures in the Demeter program package.37
Results
TEM–EDXS studies
All Ce1−xMxO2 (M = Sn, Ti, Zr) solid solutions crystallize in a single-phase with the fluorite structure. All of them are exceptionally homogeneous down to the nanometer scale, most probably at the atomic level. A typical example of the elemental maps of Ce and Sn in Ce0.5Sn0.5O2 obtained by TEM–EDXS is shown in Fig. 1.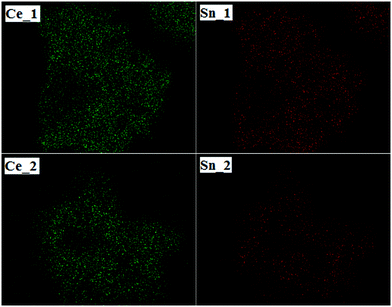 | ||
| Fig. 1 Elemental maps of Ce and Sn obtained by TEM analysis in different regions (900k magnification; image size −0.0001 × 0.0001 mm). | ||
XRD studies
The detailed structural characterizations and Rietveld refinements are presented in earlier reports.23,25,27 The dependence of the lattice parameter vs. the Sn concentration in the Ce1−xSnxO2 solid solution is shown in Fig. 2a. The lattice parameter decreases monotonically until the Sn concentration reaches 35 at% followed by a linear decrease but with a steeper slope. Similar behavior occurs for the Ti substitution with a change of the slope at ∼30 at%. In contrast, in Ce1−xZrxO2 solid solution, the lattice parameter decreases with a constant linear slope up to at least 50 at% of Zr (Fig. 2c), clearly indicating that Sn4+ and Ti4+ are responsible for the observed anomalies. In the following discussion, we will focus only on a comparison of Sn and Zr substitutions.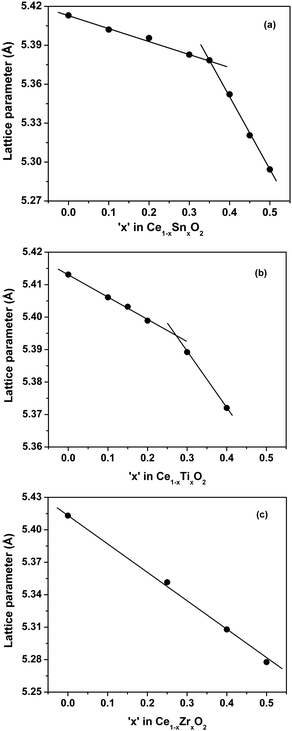 | ||
| Fig. 2 Lattice parameter vs. substituent concentration in (a) Ce1−xSnxO2, (b) Ce1−xTixO2 and (c) Ce1−xZrxO2 solid solutions. | ||
UV-Vis DRS studies
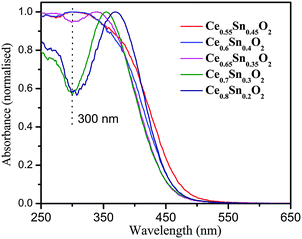
The changes in the electronic structure of the Ce1−xSnxO2 oxides determined by UV-Vis spectra are presented in Fig. 3. It demonstrates that absorption edge is not significantly shifted, although, a major change is observed at ∼300 nm. The new electronic transition peak fills up the valley with increasing Sn concentration, which is a clear indication of electronic transition due to charge transfer from O2p to Sn5s. Thus, there is a change in the metal–oxygen bonding nature gaining more covalency with increasing Sn concentration. However, the band gaps (2.81–2.92 eV) in these materials are slightly lower than pure CeO2 and largely remain unaltered with progressive Sn-substitution (see Fig. S1, ESI†). A small change in the band gaps of the solid solutions can be originated from the changes in the nature of metal–oxygen bonding.XPS studies
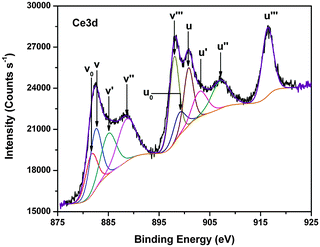
According to XRD, the fluorite-type structure remains preserved for both Ce1−xSnxO2 and Ce1−xZrxO2 solid solutions though they have different behaviors towards lattice parameter vs. Sn/Zr concentration. Consequently, the important question arises about the oxidation states of the constituent elements, especially for Ce. For this purpose, detailed XPS studies have been carried out.The Ce3d core level spectra of Ce1−xSnxO2 and Ce1−xZrxO2 oxides are presented in Fig. 4(a and b). The spectral envelops indicate that the oxides contain both Ce4+ and Ce3+ species and they can be curve-fitted into several component peaks related to Ce4+ and Ce3+, along with the corresponding satellites. Fig. 5 represents a typical curve-fitted Ce3d core level spectrum of Ce0.65Sn0.35O2. In the figure, peaks labeled as v correspond to 3d5/2 photoemissions, whereas u peaks stand for related 3d3/2 photoemissions. The u′′′ peak is relatively well separated from the rest of the spectrum and is characteristic of the presence of tetravalent cerium. In the case of Ce0.65Sn0.35O2, v′′′ and u′′′ spin–orbit peaks at 898.0 and 916.5 eV, respectively, with 18.5 eV separation are assigned for the primary photoionization from Ce4+ with the Ce3d94f0O2p6 final state. Lower binding energy states of v′′–u′′ (888.6 and 907.1 eV) and v–u (882.5 and 900.8 eV) correspond to the shake-down satellite features of Ce3d94f1O2p5 and Ce3d94f2O2p4 final states, respectively.38–43 Peaks labeled as v0, v′ and u0, u′ at 881.6, 885.1 and 899.1, 903.2 eV, respectively, are related to the Ce3+ final states. It is to be noted that v′–u′ spin orbit doublet peaks correspond to main photoionization from the Ce3d94f1O2p6 final state, whereas lower binding energy v0–u0 peaks are assigned to characteristic shake-down satellites of the Ce3d94f2O2p5 final state. Relative surface concentrations of Ce4+ and Ce3+ species present in the Ce1−xSnxO2 and Ce1−xZrxO2 solid solutions have been calculated from curve-fitted spectra that are summarized in Table 1. Peak areas (A) of Ce4+ and Ce3+ components are commonly used to estimate their relative concentrations (C) in the oxides using the following equations:38
| ACe4+ = Av + Au + Av′′ + Au′′ + Av′′′ + Au′′′ | (1) |
| ACe3+ = Av0 + Au0 + Av′ + Au′ | (2) |
 | (3) |
| Ce1−xSnxO2 | Ce3+/(Ce3+ + Ce4+) (%) | Ce3+/(Ce + Sn) (%) |
|---|---|---|
| CeO2 | 12 | — |
| Ce0.8Sn0.2O2 | 22 | 17.6 |
| Ce0.75Sn0.25O2 | 24 | 18.0 |
| Ce0.7Sn0.3O2 | 26 | 18.2 |
| Ce0.65Sn0.35O2 | 30 | 19.5 |
| Ce0.6Sn0.4O2 | 27 | 16.2 |
| Ce0.55Sn0.45O2 | 30 | 16.5 |
| Ce0.5Sn0.5O2 | 29 | 14.5 |
| Ce1−xZrxO2 | Ce3+/(Ce3+ + Ce4+) (%) | Ce3+/(Ce + Zr) (%) |
|---|---|---|
| Ce0.9Zr0.1O2 | 24 | 21.6 |
| Ce0.8Zr0.2O2 | 24 | 19.2 |
| Ce0.7Zr0.3O2 | 18 | 12.6 |
| Ce0.6Zr0.4O2 | 17 | 10.2 |
| Ce0.5Zr0.5O2 | 14 | 5.0 |
About 12% Ce exists in +3 oxidation state on the surface of pure CeO2 in line with the literature reports.44–46 With increasing Sn concentrations, the concentration of Ce3+ (Ce3+/(Ce4+ + Ce3+)) gradually increases to 30% in Ce1−xSnxO2. Although, an apparent increase in the relative concentration of Ce3+ occurs, the relative concentration of Ce3+ with respect to the total number of atoms (Ce + Sn) have been found at an almost constant value of ∼18%. However, the relative surface concentration of Ce3+ with respect to the total one (Ce + Zr) in Ce1−xZrxO2 increases initially at 10% Zr substitution and then gradually decreases with increasing Zr concentration.
Sn3d and Zr3d core level spectra of samples from the Ce1−xSnxO2 and Ce1−xZrxO2 solid solutions are presented in Fig. S2 (ESI†). In Fig. S2 (ESI†), Sn3d5/2,3/2 core level peaks at 486.1 and 494.4 eV observed in Ce1−xSnxO2 correspond to Sn4+. However, if Sn is present with mixed oxidation states (Sn4+ and Sn2+) in these oxides XPS cannot distinguish between these two oxidation states because of the very small core level binding energy difference. This issue is addressed in more detail by 119Sn Mössbauer spectroscopy (vide infra). Zr3d5/2,3/2 core level peaks in the Ce1−xZrxO2 solid solutions as presented in Fig. S2 (ESI†) remain constant at 182.3 and 184.6 eV, indicating the presence of only the +4 oxidation state of Zr in these oxides. This is expected because Zr4+ is normally irreducible in such oxidic materials.
O1s core level spectra have also been analyzed carefully to check for a change of the nature of the oxygen species in the solid solutions due to the difference in electronegativity of Sn and Zr as substituents. Fig. 6 shows the O1s core level spectra of Ce1−xSnxO2 and Ce1−xZrxO2 samples. Interestingly, the peak positions of the O1s core levels in Ce1−xSnxO2 gradually shift towards higher binding energy. For example, the O1s core level binding energies in pure CeO2 and SnO2 are 529.5 and 530.4 eV, respectively (Fig. 6a). Therefore, while they form solid solutions, the O1s binding energy increases gradually with increasing Sn substitution. The change is indeed significant and detectable. Thus, the binding energy is shifted from 529.5 eV in CeO2 to 530.0 eV in Ce0.55Sn0.45O2. On the other hand, no significant shift in the O1s binding energy position in the Ce1−xZrxO2 samples is observed, which remains almost constant at 529.6 eV (Fig. 6b). This shows that the presence of Sn in CeO2 makes Ce/Sn–O bonding more covalent as compared to the Zr substitution.
Mössbauer spectroscopic studies
Since XPS is unable to explicitly distinguish the Sn4+ and Sn2+ states in the solid solution of Ce1−xSnxO2, 119Sn Mössbauer spectroscopy is very helpful to separate them. Fig. 7 shows the experimental spectra along with transmission integral fits. The corresponding fitting parameters are listed in Table 2. For comparison, the corresponding samples of SnO2 and SnO (with a contamination of SnO2) have also been measured. Both Sn species can be clearly distinguished by their isomer shifts in 119Sn Mössbauer spectroscopy. The lone-pair character of divalent Sn is additionally expressed in a strong quadrupole splitting parameter.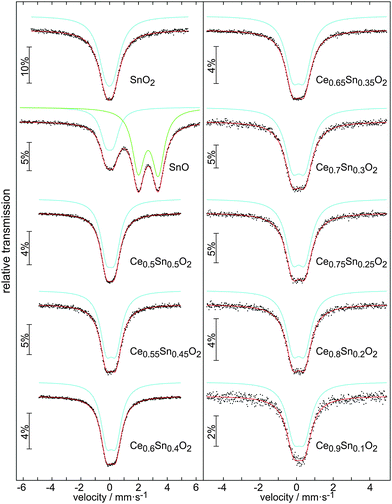 | ||
| Fig. 7 119Sn Mössbauer spectra of various samples from the Ce1−xSnxO2 solid solutions along with spectra of SnO2 and SnO samples. | ||
| Sample | δ (mm s−1) | ΔEQ (mm s−1) | Γ (mm s−1) | ratio (%) |
|---|---|---|---|---|
| SnO2 | −0.02(1) | 0.54(1) | 1.26(1) | 100 |
| SnO | 2.68(1) | 1.38(1) | 1.02(1) | 70(1) |
| 0.00(1) | 0.53(1) | 0.96(1) | 30(1) | |
| Ce0.5Sn0.5O2 | 0.06(1) | 0.59(1) | 0.97(1) | 100 |
| Ce0.55Sn0.45O2 | 0.09(1) | 0.68(1) | 1.00(1) | 100 |
| Ce0.6Sn0.4O2 | 0.10(1) | 0.65(1) | 0.97(1) | 100 |
| Ce0.65Sn0.35O2 | 0.10(1) | 0.64(1) | 0.95(1) | 100 |
| Ce0.7Sn0.3O2 | 0.12(1) | 0.69(1) | 0.99(1) | 100 |
| Ce0.75Sn0.25O2 | 0.12(1) | 0.68(1) | 0.95(1) | 100 |
| Ce0.8Sn0.2O2 | 0.12(1) | 0.64(1) | 0.92(1) | 100 |
| Ce0.9Sn0.1O2 | 0.13(1) | 0.60(1) | 0.94(1) | 100 |
All samples of the Ce1−xSnxO2 solid solutions exclusively show Sn(IV) resonances. The isomer shift shows a small but continuous decrease from 0.13(1) mm s−1 in Ce0.9Sn0.1O2 to 0.06(1) mm s−1 in Ce0.5Sn0.5O2, indicating a weak decrease of the electron density at the Sn nuclei.47 This is in close agreement with the end member of the solid solution, rutile type SnO2, which shows an isomer shift of −0.02 mm s−1. All spectra show a slightly increased line width parameter, a consequence of the statistical distribution of the Sn atoms. The local non-cubic site symmetry of the Sn atoms (a consequence of the Sn–O substructure distortions discussed below) is expressed in a weak quadrupole splitting of ∼0.65 mm s−1.
XANES and EXAFS studies
In order to explore the possible presence of Ce3+ in the bulk of Sn substituted CeO2, Ce L3-edge XANES spectra were recorded in all the samples along with CeO2 and Ce(NO3)3 as standards of Ce4+ and Ce3+, respectively. Fig. 8 shows Ce L3-edge XANES in the two end members, Ce0.8Sn0.2O2 and Ce0.5Sn0.5O2, as typical examples. Both compounds exhibit similar features as compared to the CeO2 reference and no shift in the edge position is observed, while the Ce3+ standard shows a massive edge shift towards lower energies (∼2 eV). The results do not exclude the presence of small amounts (below 5%) of Ce3+ in the bulk of CeO248–51 and also in the Ce1−xSnxO2 solid solutions. However, they clearly indicate that Ce3+ concentration in the bulk of solids is lower than that on the surface determined by XPS under vacuum.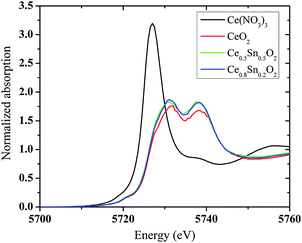 | ||
| Fig. 8 XANES spectra at the Ce L3-edge in Ce1−xSnxO2 solid solutions together with the reference samples. | ||
EXAFS analysis at the Sn K- and Ce K-edges was performed to study the changes in the local structure around these ions with increasing Sn concentration. The magnitude of Fourier transform (FT) of the EXAFS data along with fitted curves is presented in Fig. 9 and 10, respectively. The coordination number, bond distances and mean square disorder in bond distances are listed in Table S1 (ESI†).
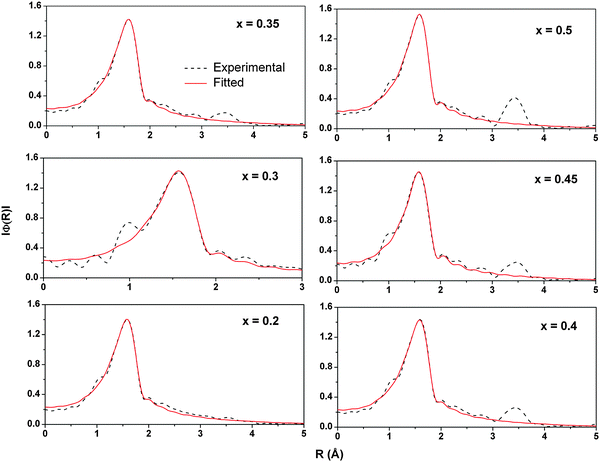 | ||
| Fig. 9 Magnitude of Fourier transform and its fitting for the Sn K-edge EXAFS in Ce1−xSnxO2 solid solutions. | ||
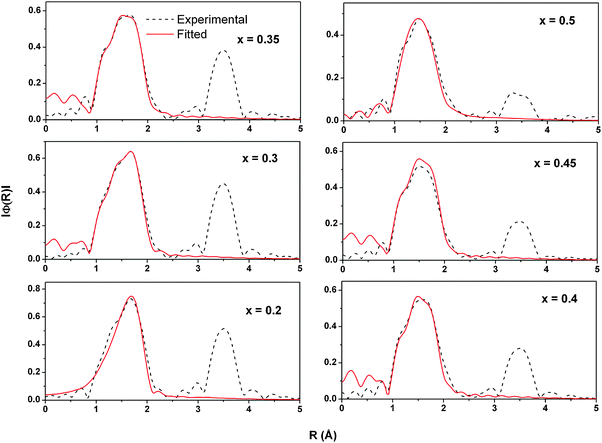 | ||
| Fig. 10 Magnitude of Fourier transform and its fitting for the Ce K-edge EXAFS in Ce1−xSnxO2 solid solutions. | ||
As can be seen from Fig. 9, there is hardly any change in either the position or the height of the first peak in magnitude of the FT of Sn K-edge EXAFS. The first peak corresponds to the Sn–O coordination shell and its unchanged behavior essentially indicates that the local structure around the Sn atoms remains quite stable with increasing tin content. A second peak at about 3.5 Å appears in the FT spectra with increasing Sn concentration. In Ce0.8Sn0.2O2 the second shell peak is hardly visible but a clear peak can be seen in Ce0.5Sn0.5O2. The absence of the peak in FT magnitude is generally ascribed to the presence of local disorder around the absorbing atom. This disorder may result in a destructive interference of EXAFS signals originating from the scattering of two different types of neighbors (Sn and Ce) placed at slightly different distances from the absorbing ion.
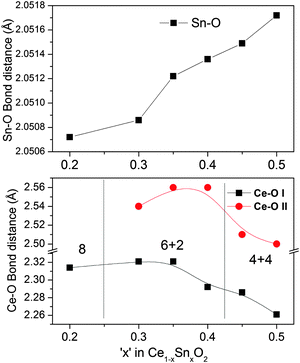
However, in the case of Ce K-edge EXAFS (Fig. 10) the position, the height as well as the shape of the Ce–O correlation peak (first peak) changes with increasing Sn concentration. These changes indicate that the oxygen coordination around Ce gets adjusted to the increasing number of tin neighbors in the second coordination shell. In pure CeO2, every cerium ion is surrounded symmetrically by 8 oxygen atoms. With the increase of Sn concentration, these 8 oxygen neighbors around Ce become non-equivalent in a way that some Ce–O bonds become longer and the others shorter. The changes in oxygen coordination are plotted in Fig. 11 (also see Table S1, ESI†). Interestingly, the bond distribution changes gradually from 6 shorter +2 longer Ce–O distances to 4 longer +4 shorter Ce–O distances when the Sn concentration increases above 40%. There is also a small change in the shorter Ce–O bond length. With increasing tin concentration, the shorter Ce–O bond decreases from 2.3 to 2.25 Å while the longer one decreases from 2.56 Å to around 2.5 Å. This behavior can be explained by the difference in the ionic radii of Ce4+ and Sn4+ ions in 8 fold coordination. Ce4+ has an ionic radius of 0.97 Å while that of Sn4+ is about 0.81 Å (Shannon radii52). The difference in ionic radii creates a strong disorder in the local structure around the cerium ions leading to a large distribution of Ce–O bond distances. In contrast, the oxygen coordination around Sn does not split into short and long bonds. All 8 Sn–O bond lengths remain close to 2.051 Å and only show a small isotropic expansion with the increase of Sn content.
The disorder around the Ce ions is also visible from the behavior of the peak corresponding to the second coordination shell in the FT of Ce K-edge EXAFS. With increasing Sn concentration, it gradually becomes less intensive, gets larger and changes from a single peak to a doublet. In Ce0.8Sn0.2O2, most of the second shell neighbors of Ce are Ce atoms, thus giving rise to a single peak in the FT spectra of Ce-edge EXAFS. With increasing Sn concentration, the number of Sn neighbors grows, Ce–O bonds become non-equivalent resulting in the large variety Ce–Sn and Ce–Ce bond distances, resulting in a doublet peak structure.
In contrast, according to the literature,27 EXAFS analysis shows that the oxygen coordination shell in the Ce1−xZrxO2 solid solutions is divided into 4 + 4 neighbors in the entire substitution range up to x = 0.5.
Discussion
This study compares the structure of Ce1−xSnxO2 and Ce1−xZrxO2 solid solutions. Despite similar ionic radii, oxidation state, and coordination number 8 (0.81 Å for Sn4+ and 0.84 Å for Zr4+), and a fluorite-type structure, substitution of tin and zirconium shows a distinctly different behavior of the lattice parameter as a function of x. There is a pronounced deviation from Vegard's law in the case of Ce1−xSnxO2.In order to understand this phenomenon, the oxidation states of the metals have been analyzed by XPS, 119Sn Mössbauer spectroscopy and Ce L3-edge XANES spectra. These techniques have confirmed that both Sn and Zr exist in the +4 oxidation state. XPS studies have indicated the presence of a significant amount (12%) of Ce3+ on the surface of pure ceria, which increases up to 20–30% for Ce1−xSnxO2 and Ce1−xZrxO2 solid solutions. This is suspected to be an overestimation of surface Ce3+ concentration and does not reflect the bulk concentration. Since XPS measurements have been carried out under high vacuum, which promotes the formation of Ce3+ due to low oxygen partial pressure, the concentration of Ce3+ in the bulk structure can be much smaller. Indeed, Ce L3- edge XANES measurements carried out in air demonstrate that bulk Ce3+ concentration in all solids is smaller and rather independent of the concentration of the Sn substituent. For this reason, the role of oxygen vacancies in a sudden change of the lattice parameter at x = 0.35 for Ce1−xSnxO2 solid solutions can be ruled out.
As Sn4+ is more electronegative than Zr4+, the Sn–O bond becomes more covalent in nature than the Zr–O bond (Pauling electronegativities are: 1.12 for Ce, 1.96 for Sn, and 1.33 for Zr). The higher covalency of the –Sn4+–O2−– bond is also evident from the increase of O1s core level binding energy in the Ce1–xSnxO2 solid solutions. A gradual color change from pale white of CeO2 to intense yellow color in solid solutions with increasing Sn content (Fig. S3, ESI†) gives an indication of higher covalency, probably due to charge transfer from O2p to Sn5s states. The absorbance data are consistent with the above fact probably due to increasing charge transfer (see Fig. 3) as indicated by the filling of valley with increasing Sn concentration. Therefore, all 8 oxygen atoms are drawn closer to the Sn atom, which is indicated by equal and shorter Sn–O bonds. As the oxygen shell around the Sn atom is shrinked and becomes more localized, it may not be able to create sufficient distortion on the Ce atom coordination shell until the Sn concentration reaches a critical value, x = 0.35. On the other hand, the coordination number of Ce changes from 8 (up to x = 0.2) to 6 + 2 (up to x = 0.35) to 4 + 4 (above x = 0.35) with increasing Sn concentration. The interesting feature is that the Ce–O bond length remains almost unchanged up to x = 0.2 and then slightly changed up to x ≤ 0.35 (see Fig. 11a). The reason can be that contraction of the SnO8 shell may facilitate the nearby CeO8 shells keeping the Ce–O bond length/shell volume almost unchanged in the cell with a reduced lattice parameter. Thus, the lattice parameter of Ce1−xSnxO2 decreases at a shallow slope up to 35 at% Sn substitution and above this concentration, the Sn–O bond becomes predominant throughout the lattice, forcing the local structure around cerium to change from 6 + 2 to 4 + 4, which allows the lattice parameter to decrease steeply up to 50 at% Sn substitution. In comparison, the Zr–O bond is more ionic in nature. The 4 + 4 coordination of the Ce–O shell leads to isotropic shrinking on the lattice parameter in the whole range of Ce1–xZrxO2 solid solution up to x = 0.5. Thus, Sn–O local coordination, as a consequence of higher electronegativity of Sn, leads to the deviation from Vegard's law for Ce1−xSnxO2 solid solutions.
Conclusions
The substitution of Ce4+ by the tetravalent cations such as Ti4+ and Sn4+ in Ce1−xMxO2 solid solutions does not result in a linear change of the lattice parameter up to x = 0.5. In both cases the lattice parameter decreases linearly with a shallow slope up to ∼35% substitution, followed by a steeper slope for higher concentrations. In contrast, Zr substitution results in a perfectly linear change in the lattice parameter up to 50%. The role of oxygen vacancies for this difference can be ruled out, because Zr and Sn remain in +4 oxidation state in all solids and the bulk concentration of Ce3+ is small and rather independent of the dopant content. On the other hand, we observe significant differences in the oxygen coordination shell around the metal as a function of dopant concentration. In Ce1–xSnxO2, the oxygen coordination shell around the Ce atoms splits into two sub-shells with shorter and longer bonds, while Sn–O coordination remains symmetric. In contrast, for Ce1–xZrxO2, both Ce–O and Zr–O shells split into different sub-shells and oxygen atoms are cooperatively adjusted to compensate for the size mismatch between Ce and Zr. The different lattice parameter vs. concentration behavior between Sn and Zr substituted CeO2 can be explained by higher electronegativity of Sn as compared to Zr, supported by XPS of the O1s core level resulting in the deviation from Vegard's law for Ce1–xSnxO2 solid solutions.Acknowledgements
We sincerely thank Professor M. S. Hegde, Solid State and Structural Chemistry Unit, Indian Institute of Science, Bangalore, India for access to the experimental facilities for this work. We thank Dr Frank Krumeich from ETH Zurich for TEM-EDXS measurements.References
- A. Trovarelli, Catalysis by Ceria and Related Materials, Imperial College Press, London, 2002 Search PubMed.
- A. Trovarelli and P. Fornasiero, Catalysis by Ceria and Related Materials, Imperial College Press, London, 2nd edn, 2013 Search PubMed.
- J. Kašpar, P. Fornasiero and M. Graziani, Catal. Today, 1999, 50, 285 CrossRef.
- P. Bera and M. S. Hegde, RSC Adv., 2015, 5, 94949 RSC.
- M. S. Hegde and P. Bera, Catal. Today, 2015, 253, 40 CrossRef CAS.
- P. Bera and M. S. Hegde, Catal. Surv. Asia, 2011, 15, 181 CrossRef CAS.
- P. Bera and M. S. Hegde, J. Indian Inst. Sci., 2010, 90, 299 CAS.
- C.-S. Oh, C.-I. Kim and K.-H. Kwon, J. Vac. Sci. Technol., A, 2001, 19, 1068 CAS.
- F.-C. Chiu and C.-M. Lai, J. Phys. D: Appl. Phys., 2010, 43, 075104 CrossRef.
- C. O. Avellaneda, M. A. C. Berton and L. O. S. Bulhões, Sol. Energy Mater. Sol. Cells, 2008, 92, 240 CrossRef CAS.
- M. Mogensen, N. M. Sammes and G. A. Tompsett, Solid State Ionics, 2000, 129, 63 CrossRef CAS.
- H. Inaba and H. Tagawa, Solid State Ionics, 1996, 83, 1 CrossRef CAS.
- M. R. Mohammadi and D. J. Fray, Sens. Actuators, B, 2010, 150, 631 CrossRef CAS.
- X. Zhong, Q. Li, J. Hu and Y. Lu, Corros. Sci., 2008, 50, 2304 CrossRef CAS.
- P. Y. Sheng, W. W. Chiu, A. Yee, S. J. Morrison and H. Idriss, Catal. Today, 2007, 129, 313 CrossRef CAS.
- B. Hariprakash, P. Bera, S. K. Martha, S. A. Gafoor, M. S. Hedge and A. K. Shukla, Electrochem. Solid-State Lett., 2001, 4, A23 CrossRef CAS.
- S. Y. Yao, W. Q. Xu, A. C. Johnston-Peck, F. Z. Zhao, Z. Y. Liu, S. Luo, S. D. Senanayake, A. Martínez-Arias, W. J. Liu and J. A. Rodriguez, Phys. Chem. Chem. Phys., 2014, 16, 17183 RSC.
- P. Bera, A. Hornés, A. López Cámara and A. Martínez-Arias, Catal. Today, 2010, 155, 184 CrossRef CAS.
- M. Václavů, I. Matolínová, J. Mysliveček, R. Fiala and V. Matolín, J. Electrochem. Soc., 2009, 156, B938 CrossRef.
- H. C. Yao and Y. F. Y. Yao, J. Catal., 1984, 86, 254 CrossRef CAS.
- A. Trovarelli, Catal. Rev.: Sci. Eng., 1996, 38, 439 CAS.
- A. Trovarelli, Comments Inorg. Chem., 1999, 20, 263 CrossRef CAS.
- T. Baidya, A. Gupta, P. A. Deshpandey, G. Madras and M. S. Hegde, J. Phys. Chem. C, 2009, 113, 4059 CAS.
- A. Gupta, M. S. Hegde, K. R. Priolkar, U. V. Waghmare, P. R. Sarode and S. Emura, Chem. Mater., 2009, 21, 5836 CrossRef CAS.
- T. Baidya, A. Gayen, M. S. Hegde, N. Ravishankar and L. Dupont, J. Phys. Chem. B, 2006, 110, 5262 CrossRef CAS PubMed.
- G. Dutta, U. V. Waghmare, T. Baidya, M. S. Hegde, K. R. Priolkar and P. R. Sarode, Chem. Mater., 2006, 18, 3249 CrossRef CAS.
- G. Dutta, U. V. Waghmare, T. Baidya, M. S. Hegde, K. R. Priolkar and P. R. Sarode, Catal. Lett., 2006, 108, 165 CrossRef CAS.
- L. Vegard, Z. Phys., 1921, 5, 17 CrossRef CAS.
- M. Castellanos and A. R. West, J. Chem. Soc., Faraday Trans. 1, 1980, 76, 2159 RSC.
- P. Ganguly, N. Shah, M. Phadke, V. Ramaswamy and I. S. Mulla, Phys. Rev. B: Condens. Matter Mater. Phys., 1993, 47, 991 CrossRef CAS.
- F. Germini, C. Bocchi, C. Ferrari, S. Franchi, A. Baraldi, R. Magnanini, D. De Salvador, M. Berti and A. V. Drigo, J. Phys. D: Appl. Phys., 1999, 32, A12 CrossRef CAS.
- S. Seppänen, L. Hultman, J. Birch, M. Beckers and U. Kreissig, J. Appl. Phys., 2007, 101, 043519 CrossRef.
- P. Kubelka and F. Munk, Z. Tech. Phys., 1931, 12, 593 Search PubMed.
- J. Tauc, R. Grigorovic and A. Vancu, Phys. Status Solidi, 1966, 15, 627 CrossRef CAS.
- D. Briggs and M. P. Seah, Practical Surface Analysis by Auger and X-ray Photoelectron Spectroscopy, Wiley, New York, 1984 Search PubMed.
- R. A. Brand, Normos Mössbauer Fitting Program, Universität Duisburg, Duisburg, Germany, 2007 Search PubMed.
- B. Ravel and M. Newville, J. Synchrotron Radiat., 2005, 12, 537 CrossRef CAS PubMed.
- C. Anandan and P. Bera, Appl. Surf. Sci., 2013, 283, 297 CrossRef CAS.
- A. Pfau and K. D. Schierbaum, Surf. Sci., 1994, 321, 71 CrossRef CAS.
- D. R. Mullins, S. H. Overbury and D. R. Huntley, Surf. Sci., 1998, 409, 307 CrossRef CAS.
- V. Chauvaut, V. Albin, H. Schneider, M. Cassir, H. Ardéléan and A. Galtayries, J. Appl. Electrochem., 2000, 30, 1405 CrossRef CAS.
- E. Beche, G. Peraudeau, V. Flaud and D. Perarnau, Surf. Interface Anal., 2012, 44, 1045 CrossRef CAS.
- E. J. Preisler, O. J. Marsh, R. A. Beach and T. C. McGill, J. Vac. Sci. Technol., B: Microelectron. Nanometer Struct.–Process., Meas., Phenom., 2001, 19, 1611 CrossRef CAS.
- M. Ricken, J. Nojlting and I. Riess, J. Solid State Chem., 1984, 54, 89 CrossRef CAS.
- R. J. Panlener, R. N. Blumenthal and J. E. Garnier, J. Phys. Chem. Solids, 1975, 36, 1213 CrossRef CAS.
- P. Dutta, S. Pal, M. S. Seehra, Y. Shi, E. M. Eyring and R. D. Ernst, Chem. Mater., 2006, 18, 5144 CrossRef CAS.
- P. E. Lippens, Phys. Rev. B: Condens. Matter Mater. Phys., 1999, 60, 4576 CrossRef CAS.
- P. Nachimuthu, W.-C. Shih, R.-S. Liu, L.-Y. Jang and J.-M. Chen, J. Solid State Chem., 2000, 149, 408 CrossRef CAS.
- A. M. Shahin, F. Grandjean, G. J. Long and T. P. Schuman, Chem. Mater., 2005, 17, 315 CrossRef CAS.
- C. Paun, O. V. Safonova, J. Szlachetko, P. M. Abdala, M. Nachtegaal, J. Sa, E. Kleymenov, A. Cervellino F. Krumeich and J. A. van Bokhoven, J. Phys. Chem. C, 2012, 116, 7312 CAS.
- C. Hennig, A. Ikeda-Ohno, W. Kraus, S. Weiss, P. Pattison, H. Emerich, P. M. Abdala and A. C. Scheinost, Inorg. Chem., 2013, 52, 11734 CrossRef CAS PubMed.
- R. D. Shannon, Acta Crystallogr., 1976, A32, 751 CrossRef CAS.
Footnotes |
| † Electronic supplementary information (ESI) available. See DOI: 10.1039/c6cp01525e |
| ‡ Present address: Department of Mechanical and Aerospace Engineering, University of California, 9500 Gilman Drive, San Diego, CA 92093, USA. Email: E-mail: tinku26@gmail.com |
| This journal is © the Owner Societies 2016 |

