 Open Access Article
Creative Commons Attribution 3.0 Unported Licence
Energetics, barriers and vibrational spectra of partially and fully hydrogenated hexagonal boron nitride†
J. M. H.
Kroes
*,
A.
Fasolino
and
M. I.
Katsnelson
Radboud University, Institute for Molecules and Materials, Heijendaalseweg 135, 6525 AJ Nijmegen, The Netherlands. E-mail: J.Kroes@science.ru.nl
First published on 28th June 2016
Abstract
We study hydrogen chemisorption at full coverage and low concentrations on hexagonal boron nitride (h-BN). Chemisorption trends reveal the complex nature of hydrogenation. Barriers for diffusion are found to be significantly altered by the presence of additional H atoms. Moreover, the presence of a Stone–Wales defect may dramatically enhance the bond strength of H to the h-BN surface. These findings provide new insights to understand and characterize hydrogenated boron nitride.
1 Introduction
Hexagonal boron nitride (h-BN) is a free-standing two-dimensional membrane closely related to graphene.1 The two materials can be combined to form van der Waals heterostructures,2 a new class of materials with specific applications to transistors.3–5 h-BN forms an ideal substrate for graphene to achieve the highest electron mobility due to its ripple-suppressing surface.2,6–12 Graphene and h-BN have many properties in common, e.g., a high mechanical strength, non-solubility in liquid water, and a relatively high room temperature thermal conductivity (0.2–0.4 kW mK−1 for h-BN13 compared to ∼5 kW mK−1 reported for graphene14). However, one key difference is that h-BN is an insulator with a 5.8 eV gap15 whereas graphene is a semi-metal.Of the many possible functionalizations of h-BN (see e.g.ref. 16 for a recent overview), one interesting case is hydrogenation. For graphene this has lead to the discovery of graphane,17 which is found to have a reduced lattice constant (2.42 Å) compared to graphene (2.46 Å), and is further characterized by the increased Raman D-peak intensity. Graphane is believed to have a strong tendency to structural disorder due to a low cohesive energy.17 Several works have considered the hydrogenation of monolayer h-BN by atomic hydrogen, both theoretically18–26 and experimentally.27 Theoretical works considered chemisorption of either one or two H atoms,18 half coverage22,25 or full coverage.19–24,26 Experiments performed by Zhang et al.27 considered few-layered h-BN on Mo wafers exposed to a H plasma, which was found to lead to a band gap reduction from 5.6 to 4.25 eV in 250 s.
Our motivation is two-fold. First, examine configurations with small number of chemisorbed H atoms which have not yet been considered. Such configurations make a logical intermediate between the chemisorption of a single H atom and a fully hydrogenated surface. It is moreover not evident that full (crystalline) hydrogenation is kinetically accessible at room temperature. Second, provide an atomistic description of the hydrogenated h-BN surface that may aid in experimental characterization of these surfaces. Here we present the structures of h-BN at increasing hydrogen concentrations and the electronic and vibrational spectra of the lowest energy structures.
2 Methods
Calculations were performed with CP2K28 when using a supercell approach and with Quantum Espresso (QE29) for unit-cell calculations with reciprocal space grids.For the supercell approach (C2PK), the Quickstep method is employed, with wave functions expanded onto a localized double-ζ-valence-polarized basis set and the electronic density expanded onto a plane-wave basis set with a kinetic energy cutoff of 500 Ry. Goedecker–Teter–Hutter pseudopotentials30 are used to describe the interactions with the core electrons. We use the PBE31,32 approximation of the exchange–correlation (xc) functional.
For the unit-cell calculations (QE), we used Martins–Troullier pseudopotentials,33 a 10 × 10 k-point grid and a plane wave basis set expanded up to 100 (400) Ry for the orbitals (density).
Binding energies are computed as
| Eb = (Eh-BN + nHEH − Etot)/nH, |
3 Structures and energetics
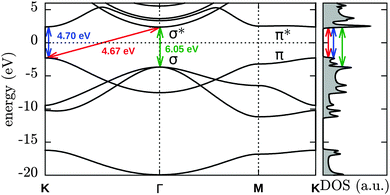
We start our investigation by evaluating several basic properties of hydrogen and h-BN. The binding energy and distance of the H2 molecule are given in Table 1. The electronic structure and density of states (DOS) of pristine h-BN are shown in Fig. 1. Experimentally a direct band gap 5.8 eV (215 nm) is observed for h-BN15 which is underestimated in our DFT-PBE calculations by approximately 1 eV and is moreover found to be almost degenerate with an indirect transition from K to Γ, indicated by the red arrow in Fig. 1. Calculations with the hybrid PBE0 functional (see ESI†) overestimate the gap with respect to its experimental value by ∼1 eV.Fully hydrogenated h-BN can occur in three non-equivalent ways when considering a double unit cell of h-BN (two B and two N atoms per unit cell) with an equal number of H atoms above and below the layer. These three structures (stirrup, boat and chair or fα, fβ and fγ in order of stability) are shown in Fig. 2 and are further characterized in Table 2. The stirrup configuration consists of alternating lines of H atoms below and above the membrane which follow the zigzag-lines of h-BN. The boat configuration has alternating pairs of H atoms above/below neighboring BN pairs, and the chair configuration has alternating H atoms above and below each atom of the pristine lattice.
| fα (stirrup) | fβ (boat) | fγ (chair) | |
|---|---|---|---|
| E b/eV | 2.26 (2.14) | 2.21 (2.20) | 2.18 (2.14) |
| r BN/Å | 1.59–1.62 | 1.56–1.60 | 1.59 |
| r HN/Å | 1.03 | 1.03 | 1.04 |
| r HB/Å | 1.23 | 1.23 | 1.21 |
| h BN/Å | 1.28 | 0.81 | 0.52 |
| h H/Å | 3.43 | 3.17 | 2.77 |
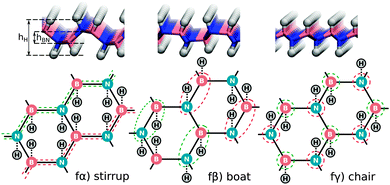 | ||
| Fig. 2 Side view and schematic illustration of fully hydrogenated h-BN configurations. Red (green) dashed lines indicate B or N atoms with H atoms above (below) the h-BN sheet. | ||
Full hydrogenation induces a significant pressure, resulting in changes of the equilibrium unit cell. For the chair configuration the unit cell remains hexagonal but the lattice constant expands from 2.50 to 2.58 Å. For the stirrup and boat configuration, however, the optimized unit cell is monoclinic, with eight atoms (2B, 2N, 4H) per unit cell. The lattice of the stirrup (boat) configuration is defined by |![[a with combining right harpoon above (vector)]](https://www.rsc.org/images/entities/i_char_0061_20d1.gif) 1| = 4.64 (5.06) Å, |
1| = 4.64 (5.06) Å, |![[a with combining right harpoon above (vector)]](https://www.rsc.org/images/entities/i_char_0061_20d1.gif) 2| = 2.60 (2.59) Å and γ = 124.1 (120.7)°, compared to the double unit cell of pristine h-BN where |
2| = 2.60 (2.59) Å and γ = 124.1 (120.7)°, compared to the double unit cell of pristine h-BN where |![[a with combining right harpoon above (vector)]](https://www.rsc.org/images/entities/i_char_0061_20d1.gif) 1| = 5.00 Å, |
1| = 5.00 Å, |![[a with combining right harpoon above (vector)]](https://www.rsc.org/images/entities/i_char_0061_20d1.gif) 2| = 2.50 Å, and γ = 120.0°. An unambiguous evaluation of these energy differences requires an unchanged basis set. Therefore the number of plane waves is kept fixed between the calculations at different volumes.
2| = 2.50 Å, and γ = 120.0°. An unambiguous evaluation of these energy differences requires an unchanged basis set. Therefore the number of plane waves is kept fixed between the calculations at different volumes.
For all three full coverage configurations the system becomes more sp3-like and strongly non-planar as seen from the values of hH and hBN in Table 2. From Table 2, one can also see that the energy gain due to these cell changes for the stirrup, boat and chair configurations are 0.12, 0.01 and 0.04 eV per H respectively. As a consequence, the stirrup becomes the most favourable configuration, whereas for the pristine cell the boat configuration was favoured.
The small energy difference‡ of 0.05 eV favouring the stirrup (fα) over the boat configuration (fβ) agree with previously published results of 0.0419,37 and 0.01 eV.26 The binding energy difference between the boat and chair configuration (fβ and fγ) of 0.07 eV is also in agreement with the 0.03 eV reported previously.26,37 Only the 0.27 eV energy difference between fβ and fγ, reported by Bhattacharya et al.,19 appears to be anomalously large. We note that, contrary to ground state properties, the calculated values of the unoccupied levels are dependent on the basis set and vacuum spacing as discussed in the ESI.†
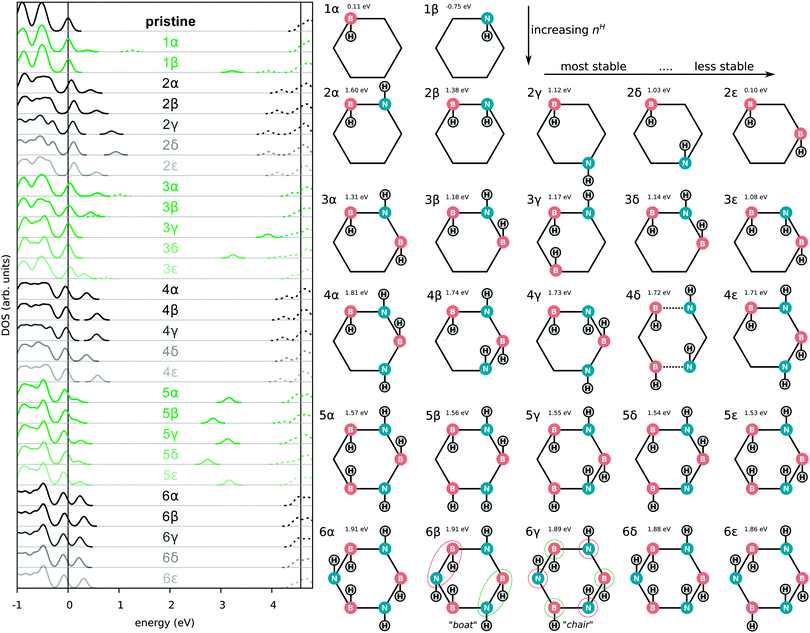
We also optimized all possible H chemisorption configurations on a single hexagon in a large supercell (90 B and 90 N atoms in a 21.85 × 22.71 × 15.0 Å3 cell with periodic boundary conditions) with at most one H per B/N site. This amounts to 84 configurations in total with nH between one and six of which 63 were found to correspond to local minima during the optimization. For each nH, the five most stable configurations are shown in Fig. 3. Note that in 4δ two BN bonds have been broken as can be seen more clearly in Fig. S1 (ESI†).
In the left part of Fig. 3 the dependence of the electronic band gap on nH is shown. For an odd nH we observe a spin-splitting leading to an occupied/unoccupied state pair in the gap of pristine h-BN. Upon adsorption of an even number of H atoms the system becomes spin-degenerate and (re)opens the gap, although the gap remains smaller than that of pristine h-BN. The most favourable configurations with nH = 2, 4 and 6 are those with the largest electronic gap (for more details see Table S4, ESI†). Considering the most stable configurations for each nH, the gap initially decreases from the pristine (0H) gap (4.7 eV), and then slowly reopens from 3.8 eV (2H) to 3.9 eV (4H) and finally 4.2 eV (6H).
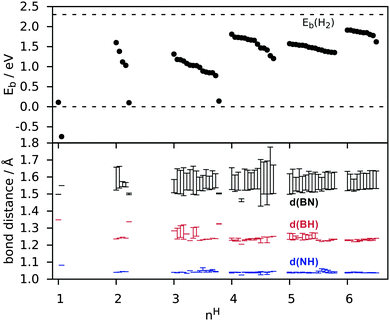
In Fig. 4 the nH dependence of Eb and bond distances is shown for all metastable configurations. It can be seen that electron pairing tends to favour configurations with H atoms in proximity rather than at infinite separation. Already for two H atoms the energy gain with respect to 1α is as much as 1.5 eV per H. Moreover, an even number of H atoms is strongly favoured (similarly to the case of BN nanotubes38) with the resulting configurations having a spin-degenerate ground-state. For three H atoms instead the binding energy is reduced, in contrast to what happens on carbon nanotubes,39 where odd numbers of H atoms (2N + 1) remain comparable in binding energy with the even (2N) chemisorbed atoms. As a result it may be preferable for hydrogen to chemisorb in pairs. With an increasing number of H atoms, the number of possible configurations increases rapidly and their binding energies tend to lie close. The binding energy (Eb) finally approaches that of H2 (2.30 eV) without surpassing it, reaching 1.91 eV for 6H and 2.26 eV for full hydrogenation. This finding implies that hydrogenation requires atomic hydrogen. The BH and NH bond lengths converge rapidly with the number of H atoms (roughly from nH = 2). BN bond distances converge more slowly to their value at full coverage (∼1.6 Å as seen in Table 2) and show a large range of values even for nH = 6. This is because some BN bonds will have two H atoms attached while others have only one, and because the finite number of H atoms creates alternating bond strengths in the BN structure.
We now consider in more detail the individual configurations with the aim of understanding trends in chemisorption.
For a single H atom (1α and 1β of Fig. 3), chemisorption on B or N leads to a locally sp3-like geometry. After adsorption the B (N) atom is raised out-of-plane by 0.4 (0.6) Å, with a pyramidalization angle40 (ΘP) of 10° (19°). The BN distances are correspondingly increased from 1.46 Å to 1.50 Å for H chemisorption on B and 1.55 Å on N. Bonding to B occurs with an unusually long BH bond distance of 1.35 Å, while the NH distance is 1.08 Å. Chemisorption on B is associated with a binding energy of Eb = 0.11 eV (ref. 18 and 41 report a binding energy of 0.05 and 0.02 eV). Chemisorption on N has Eb = −0.75 eV and is thus endothermic.
Two separate effects make H chemisorption on B favoured. First, the geometrical distortion is smaller. The distortion energy – defined as the energy difference of the BN atoms in this configuration compared to the pristine lattice – is 0.47 eV when bonded to B compared to 1.08 eV when bonded to N. Therefore less strain is exerted on the system when H is bonded to B. Second, the ionic nature of BN gives a relative excess charge on B (Mulliken population analysis42 gives a net excess charge of 0.35 e− on B), facilitating covalent binding.
Using ab initio (Born–Oppenheimer) molecular dynamics (MD) in the NVE ensemble we further examined the stability of a single chemisorbed H atom at finite temperatures. Simulations at several relevant temperatures are shown in Fig. 5. These short (1 ps) MD simulations start from the optimized structure with randomized initial velocities. The time-step for the velocity-Verlet integration scheme is 0.5 fs. In these simulations we find that H atoms remain bound to B or to N up to a temperature of ∼750 K (0.06 eV) or 500 K (0.04 eV) respectively.
The 2α structure (see Fig. 3), a neighbouring BN pair with one H above and one below, appears to be a building block for subsequent low-energy configurations. Different arrangements of it are found in all the most stable structures: 4α,β,δ and 6α,β,γ,ε can in principle all be considered as built up by putting together such blocks of neighbouring BN pairs. The small energy differences between different orientations of such blocks (i.e. the small differences between 6α,β,γ and ε) moreover indicate a relatively small interaction energy between them. The minimum-energy-state (6α) does not directly correspond to any of the fully hydrogenated structures (fα, fβ and fγ) discussed previously and may indicate the onset of more complicated, disordered structures obtained by combining 2α in different ways.
To investigate the effect of the chosen xc functional we repeated the structural optimization of the structures in Fig. 3 with the BLYP48,49 functional. We find that BLYP tends to slightly lower the stability of all structures with respect to the PBE binding energies. For 6α−ε the BLYP binding energies are 1.86, 1.85, 1.86, 1.83 and 1.81 eV per H compared to 1.91, 1.91, 1.89, 1.88 and 1.86 eV per H found with PBE. For 1α and 1β the effect is slightly larger, with BLYP predicting binding energies of 0.04 and −0.91 eV per H compared to 0.11 and −0.75 eV per H found with PBE.
4 Barriers
Using the climbing-image nudged elastic band (CI-NEB50) method we calculated barriers between several thermodynamically relevant structures with CP2K. When a process consists of multiple barriers the calculations is split into multiple CI-NEB calculations to have one climbing image per transition. These barriers are shown in Fig. 6. In the simplest process, 1β → 1α, a H atom diffuses between two neighbouring sites by first desorbing from one site and readsorbing on the other. In both cases desorption is associated with a very low energy barrier (0.1 eV from either site, 1α or 1β) and the transition state is characterized as the point where the BH (NH) bond is broken, namely at rBH = 1.8 Å or rNH = 1.3 Å respectively.The second process we considered is the permeation of a H atom through the layer, shown in Fig. 6b. In this process H is initially attached to B, and passes and subsequently readsorbs on the same B atom on the other side. This process is associated with a much higher barrier of 2.9 eV. The path for this process passes through the center of a BN bond rather than the center of the hexagon, despite that the latter was used as initial guess for the path. The transition state is characterized by a BH distance of 1.39 Å and a NH distance of 1.05 Å.
When two H atoms are present, a similar process whereby one H passes through the membrane (2β → 2α) is associated with a significantly lower barrier of 1.3 eV as shown in Fig. 6c. Again the transition state is marked by a short NH distance (1.00 Å) when H is in-plane. The BH distance is significantly larger (1.49 Å). Despite reducing the barrier significantly, H atoms caught in a configuration like 2β may thus be expected to remain trapped in this configuration at room temperature.
5 Phonon spectra and molecular vibrations
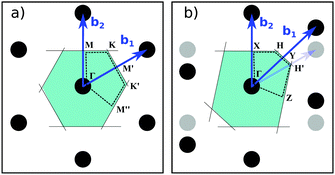
Phonon spectra and molecular vibrations form an import tool for material characterization. We therefore computed also the phonon dispersions of fully hydrogenated h-BN and the vibrational spectra for configurations with a finite number of H atoms.The phonon dispersion curves for pristine and fully hydrogenated h-BN are shown in Fig. 7 and the corresponding Brillouin zones are described in Fig. 8. The phonon spectrum of h-BN may be compared to Slotman et al.,51 Kern et al.,52 and those of fully hydrogenated h-BN to Thapa and Das.53 In particular, the pristine h-BN phonon spectrum shown in Fig. 7a is in excellent agreement with experimental observations. The (Raman active) BN stretching mode is found at 1349 cm−1 compared to the 1373 cm−1 found experimentally.54 Good agreement between calculations with two different computational approaches (large cell calculations done with CP2K versus unit cell calculations done with QE) can also be inferred from the DOS plotted on the right for each of the dispersion curves in Fig. 7 (black and blue curves for QE and CP2K respectively). A further comparison between QE and CP2K results in terms of structural properties is given in the ESI,† Table S1.
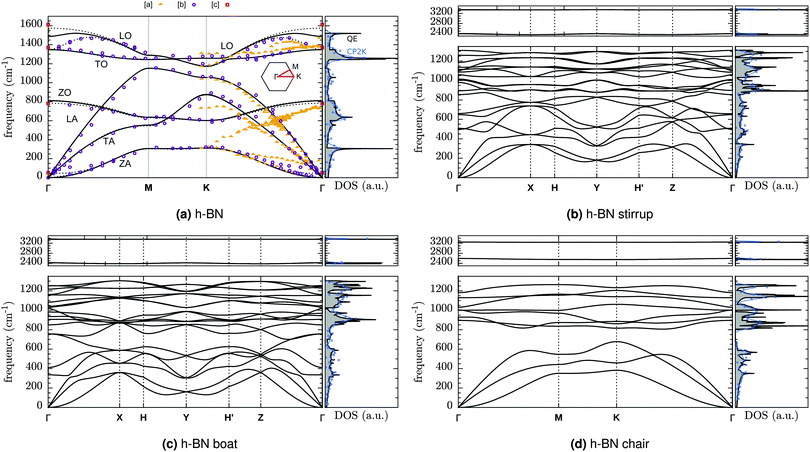 | ||
| Fig. 7 DFT-PBE phonon dispersion of (a) pristine h-BN, and hydrogenated h-BN in the (b) stirrup, (c) boat and (d) chair configuration. The reciprocal space paths are explained in Fig. 8. [a] = Rokuta et al.43 (HREELS), [b] = Serrano et al.44 (inelastic X-ray scattering) [c] = Geick et al.,45 Nemanich et al.,46 Reich et al.47 (Raman and IR at Γ). Solid (dashed) lines are for monolayer (bulk). The DOS shown is that of monolayer h-BN. Blue lines and squares give the DOS from supercell calculations (CP2K) as Gaussian broadening (width 25 cm−1) or histogram (25 cm−1 intervals) respectively. | ||
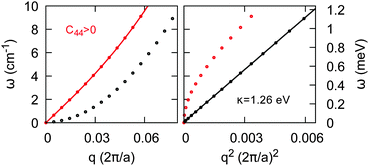
For the optimized pristine h-BN cell, the out-of-plane acoustic mode (ZA) has the anomalous quadratic dispersion55
 is the 2D mass density. Any strain would add a linear term proportional to C44. To illustrate this effect, in Fig. 9 the ZA-mode dispersion in the optimized cell is compared to that obtained in a 0.2% larger cell, where it can be seen that this expansion changes the dispersion from quadratic to linear, forming an independent test for unit cell optimization. For pristine h-BN κ is found to be 1.26 eV. We note that at the non-optimal cell the LO and TO modes are also modified, being reduced by roughly 10 cm−1 for a 0.2% increase in lattice parameter.
Full hydrogenated changes also the BN modes. The BN band edge is reduced by more than 200 cm−1 from 1521 cm−1 to 1311 cm−1 (stirrup), 1303 cm−1 (boat) or 1263 cm−1 (chair). In particular, the chair configuration (fγ) also creates a gap of ∼125 cm−1 between the optic and acoustic modes (678–805 cm−1)
We also computed vibrational spectra for structures with a finite number of H atoms. We focus on two main parts of the spectra. The first part is the region around 700 cm−1 where the chair configuration opens a gap in the DOS, whereas the pristine and other hydrogenated samples do not. The second part is the region of 2400–3200 cm−1 where differences in BH and NH stretching modes frequencies may be most clearly observed.
In Fig. 10 the DOS projected onto the atoms bound to H is shown for several 6H configurations. A reduction in the DOS is observed for all structures considered in the region of 600–800 cm−1, as seen for the chair configuration in Fig. 7d. Moreover, configuration 6γ, which can be considered the precursor of the chair structure as indicated by the coloured circles in Fig. 2 and 3 clearly shows the most pronounced reduction in DOS in this region as expected.
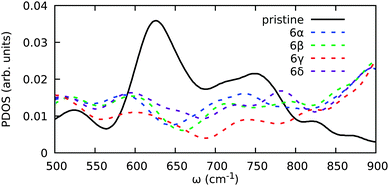 | ||
| Fig. 10 Vibrational DOS in the range 500–900 cm−1. The DOS is projected onto B and N atoms in the hexagon where H is chemisorbed. | ||
The range of frequencies associated with BH and NH stretching modes are summarized in Table 3. When only a single H atom is bonded to B, the BH bond is weak, with a bond length as large as 1.35 Å, resulting in a mode of 1563 cm−1, just above the pristine h-BN band edge of 1521 cm−1. With additional H atoms, the bond is strengthened, becoming a full single bond (rBH = 1.20 Å) and making the system spin-degenerate. As a result the associated BH frequency approximately doubles. Conversely, when H is bound to N (1β), we directly find a much higher frequency of 2479 cm−1. The range of both the νNH and νBH modes depends significantly on the configuration under consideration, with differences of about 200 cm−1 for configurations with comparable binding energy. In comparing the fully hydrogenated with partially hydrogenated structures (as represented by those with 6H), we see that the width of the BH modes grows from 20 cm−1 to 70−1. Therefore, a disordered hydrogenated structure may be expected to display a broader band for the BH modes.
| ω NH (cm−1) | ω BH (cm−1) | |
|---|---|---|
| 1α | 1563 | |
| 1β | 2479 | |
| 2α | 2350 | 3326 |
| 2β | 2302 | 3330 |
| 2γ | 2306 | 3307 |
| 4α | 2308, 2406 | 3315, 3375 |
| 4β | 2387, 2446 | 3291, 3306 |
| 6α | 2370–2424 | 3308–3375 |
| 6β | 2390–2417 | 3308–3354 |
| 6γ | 2458–2484 | 3277–3280 |
| 6δ | 2336–2472 | 3292–3342 |
| fα | 2361–2460 (2357–2405) | 3361–3371 (3342–3350) |
| fβ | 2392–2442 (2391–2424) | 3374–3384 (3355–3361) |
| fγ | 2559–2610 (2549–2594) | 3255–3272 (3235–3245) |
6 Hydrogenation of SW defects
Finally we also considered chemisorption on a Stone–Wales (SW) defect, as shown in Fig. 11 and Table 4. The SW defect geometry is shown in the lower panel of Fig. 11 and is found to have a formation energy of 6.9 eV. For comparison, for BN nanoribbons, the SW formation energy was found to increase from 5.9–6.3 (this range is due to the orientation on the ribbon) to 6.4–6.8 eV upon increasing the nanoribbon width from 1.4 to 2.6 nm.56| SW-1α | SW-1β | SW-1γ | SW-1δ | SW-1ε | SW-1ζ | SW-1η | SW-2α | SW-2β | SW-2γ | |
|---|---|---|---|---|---|---|---|---|---|---|
| E b/eV | 1.66 | 1.59 | 1.02 | 0.88 | 0.83 | 0.62 | 0.61 | 3.36 | 2.44 | 2.40 |
| r HN/Å | — | — | — | 1.28 | 1.04 | — | — | — | 1.23 | — |
| r HB/Å | 1.36 | 1.26 | 1.26 | — | — | 1.31 | 1.32 | 1.21 | 1.04 | 1.02–1.03 |
In this case there are of course many more possible chemisorption sites even for a single H. The most favourable sites are again those when H is bonded to B with an associated binding energy of 1.66 eV much greater than for pristine h-BN (0.11 eV), however still significantly lower than the H2 binding energy (2.30 eV).
The chemisorption of a dimer however, attains a binding energy of 3.36 eV per H. In contrast to pristine h-BN, where binding to B was found to be preferable, the most favourable SW:2H configuration is when both H are attached to (neighbouring) N atoms. The binding energy of this configuration (as well as other dimer configurations) thereby surpass even that of molecular hydrogen, similarly to what was found for graphene.57 Taking into account the defect formation energy however it remains favourable to reconstruct the lattice and have molecular hydrogen separately.
7 Conclusions
Chemisorption of H on h-BN is in many ways similar to that of graphene:17,58,59 H atoms prefer chemisorption in pairs on the different sublattices, and full hydrogenation eventually results in a structure only slightly less stable than the pristine lattice with molecular hydrogen. However, for the chemisorption of a single H atom, h-BN is much less reactive than graphene, with a binding energy of 0.1 eV on h-BN versus 1.4 eV on graphene. Moreover, the structure of fully hydrogenated h-BN is qualitatively different from that of graphene and leads to a monoclinic lattice.In the experiments where h-BN was exposed to a H plasma,27 a band gap reduction of ∼1.35 eV was observed with only minor deviations in the E2g mode at 1373 cm−1 after hydrogenation. Given the results presented here, it seems reasonable to expect that these samples were not fully hydrogenated. The changes in vibrational frequencies and band gap reduction may be more easily explained by small groups of H atoms on the surface, resulting in localized impurity states where the BN spectrum is less affected.
The characterizations of the unit cell and structural changes, as well as of the electronic and vibrational structure that we have provided here may help characterize these structures more carefully. It may therefore be insightful to resolve the detailed structure of h-BN exposed to atomic hydrogen by means of atomic spectroscopy methods and consider elevated temperatures for chemisorption.
The research leading to these results received funding from the Foundation for Fundamental Research on Matter (FOM), part of the Netherlands Organisation for Scientific Research (NWO). The work was carried out on the Dutch national e-infrastructure with the support of SURF Cooperative. A. F. and M. I. K. acknowledge financial support from the from the European Union Seventh Framework Programme under Grant No. 604391 Graphene Flagship. We thank W. Brandeburgo, E. J. Meijer and R. C. Ouwersloot for useful discussions.
References
- K. S. Novoselov, A. K. Geim, S. V. Morozov, D. Jiang, Y. Zhang, S. V. Dubonos, I. V. Grigorieva and A. A. Firsov, Science, 2004, 306, 666–669 CrossRef CAS PubMed
.
- A. K. Geim and I. V. Grigorieva, Nature, 2013, 499, 419–425 CrossRef CAS PubMed
.
- F. Schwierz, Nat. Nanotechnol., 2010, 5, 487–496 CrossRef CAS PubMed
.
- L. Britnell,
et al.
, Science, 2012, 335, 947–950 CrossRef CAS PubMed
.
- L. Britnell,
et al.
, Nat. Commun., 2013, 4, 1794 CrossRef CAS PubMed
.
- C. R. Dean,
et al.
, Nat. Nanotechnol., 2010, 5, 722–726 CrossRef CAS PubMed
.
- C. R. Dean,
et al.
, Nat. Phys., 2011, 7, 693–696 CrossRef CAS
.
- R. Decker,
et al.
, Nano Lett., 2011, 11, 2291–2295 CrossRef CAS PubMed
.
- W. Gannett, W. Regan, K. Watanabe, T. Taniguchi, M. F. Crommie and A. Zettl, Appl. Phys. Lett., 2011, 98, 242105 CrossRef
.
- A. S. Mayorov,
et al.
, Nano Lett., 2011, 11, 2396–2399 CrossRef CAS PubMed
.
- L. A. Ponomarenko,
et al.
, Nat. Phys., 2011, 7, 958–961 CrossRef CAS
.
- S. Tang,
et al.
, Sci. Rep., 2013, 3, 2666 Search PubMed
.
- I. Jo, M. T. Pettes, J. Kim, K. Watanabe, T. Taniguchi, Z. Yao and L. Shi, Nano Lett., 2013, 13, 550–554 CrossRef CAS PubMed
.
- A. A. Balandin, S. Ghosh, W. Bao, I. Calizo, D. Teweldebrhan, F. Miao and C. N. Lau, Nano Lett., 2008, 8, 902–907 CrossRef CAS PubMed
.
- K. Watanabe, T. Taniguchi and H. Kanda, Nat. Mater., 2004, 3, 404–409 CrossRef CAS PubMed
.
- Nanotubes and Nanosheets: Functionalization and Applications of Boron Nitride and Other Nanomaterials.
- D. C. Elias,
et al.
, Science, 2009, 323, 610–613 CrossRef CAS PubMed
.
- S. A. Shevlin and Z. X. Guo, Phys. Rev. B: Condens. Matter Mater. Phys., 2007, 76, 024104 CrossRef
.
- A. Bhattacharya, S. Bhattacharya, C. Majumder and G. P. Das, Phys. Status Solidi RRL, 2010, 4, 368–370 CrossRef CAS
.
- W. Chen, Y. Li, G. Yu, C.-Z. Li, S. B. Zhang, Z. Zhou and Z. Chen, J. Am. Chem. Soc., 2010, 132, 1699–1705 CrossRef CAS PubMed
.
- S. Tang and Z. Cao, Chem. Phys. Lett., 2010, 488, 67–72 CrossRef CAS
.
- Y. Wang, Phys. Status Solidi RRL, 2010, 4, 34–36 CrossRef CAS
.
- A. Bhattacharya, S. Bhattacharya, C. Majumder and G. P. Das, Phys. Rev. B: Condens. Matter Mater. Phys., 2011, 83, 033404 CrossRef
.
- A. Bhattacharya, S. Bhattacharya and G. P. Das, Phys. Rev. B: Condens. Matter Mater. Phys., 2012, 85, 035415 CrossRef
.
- X. Li, J. Zhao and J. Yang, Sci. Rep., 2013, 3, 1858 Search PubMed
.
- Q. Tang, Z. Zhou, P. Shen and Z. Chen, ChemPhysChem, 2013, 14, 1787–1792 CrossRef CAS PubMed
.
- H. X. Zhang and P. X. Feng, ACS Appl. Mater. Interfaces, 2012, 4, 30–33 CAS
.
- J. VandeVondele, M. Krack, F. Mohamed, M. Parrinello, T. Chassaing and J. Hutter, Comput. Phys. Commun., 2005, 167, 103–128 CrossRef CAS
.
- P. Giannozzi,
et al.
, J. Phys.: Condens. Matter, 2009, 21, 395502 CrossRef PubMed
.
- S. Goedecker, M. Teter and J. Hutter, Phys. Rev. B: Condens. Matter Mater. Phys., 1996, 54, 1703–1710 CrossRef CAS
.
- J. P. Perdew, K. Burke and M. Ernzerhof, Phys. Rev. Lett., 1996, 77, 3865–3868 CrossRef CAS PubMed
.
- J. P. Perdew, K. Burke and M. Ernzerhof, Phys. Rev. Lett., 1997, 78, 1396 CrossRef CAS
.
- N. Troullier and J. L. Martins, Phys. Rev. B: Condens. Matter Mater. Phys., 1991, 43, 1993–2006 CrossRef CAS
.
- G. Herzberg and A. Monfils, J. Mol. Spectrosc., 1961, 5, 482–498 CrossRef
.
- H. H. Hyman and C. R. Jeppesen, Nature, 1930, 125, 462 CrossRef CAS
.
- R. W. Lynch and H. G. Drickamer, J. Chem. Phys., 1966, 44, 181–184 CrossRef CAS
.
- D. K. Samarakoon and X.-Q. Wang, Appl. Phys. Lett., 2012, 100, 103107 CrossRef
.
- X. Wu, J. Yang, J. G. Hou and Q. Zhu, J. Chem. Phys., 2004, 121, 8481 CrossRef CAS PubMed
.
- W. Andreoni, A. Curioni, J. M. H. Kroes, F. Pietrucci and O. Gröning, J. Phys. Chem. C, 2012, 116, 269–275 CAS
.
- R. C. Haddon, Science, 1993, 261, 1545–1550 CAS
.
- B. Mårlid, K. Larsson and J.-O. Carlsson, J. Phys. Chem. B, 1999, 103, 7637–7642 CrossRef
.
- R. S. Mulliken, J. Chem. Phys., 1955, 23, 1833–1840 CrossRef CAS
.
- E. Rokuta, Y. Hasegawa, K. Suzuki, Y. Gamou, C. Oshima and A. Nagashima, Phys. Rev. Lett., 1997, 79, 4609 CrossRef CAS
.
- J. Serrano,
et al.
, Phys. Rev. Lett., 2007, 98, 095503 CrossRef CAS PubMed
.
- R. Geick, C. Perry and G. Rupprecht, Phys. Rev., 1966, 146, 543–547 CrossRef CAS
.
- R. J. Nemanich, S. A. Solin and R. M. Martin, Phys. Rev. B: Condens. Matter Mater. Phys., 1981, 23, 6348 CrossRef CAS
.
- S. Reich, A. C. Ferrari, R. Arenal, A. Loiseau, I. Bello and J. Robertson, Phys. Rev. B: Condens. Matter Mater. Phys., 2005, 71, 205201 CrossRef
.
- A. D. Becke, Phys. Rev. A: At., Mol., Opt. Phys., 1988, 38, 3098–3100 CrossRef CAS
.
- C. Lee, W. Yang and R. G. Parr, Phys. Rev. B: Condens. Matter Mater. Phys., 1988, 37, 785–789 CrossRef CAS
.
- G. Henkelman, B. P. Uberuaga and H. Jónsson, J. Chem. Phys., 2000, 113, 9901–9904 CrossRef CAS
.
- G. J. Slotman, G. A. de Wijs, A. Fasolino and M. I. Katsnelson, Ann. Phys., 2014, 526, 381–386 CrossRef CAS
.
- G. Kern, G. Kresse and J. Hafner, Phys. Rev. B: Condens. Matter Mater. Phys., 1999, 59, 8551 CrossRef CAS
.
- R. Thapa and G. Das, Appl. Surf. Sci., 2013, 284, 638–643 CrossRef CAS
.
- L. Song,
et al.
, Nano Lett., 2010, 10, 3209–3215 CrossRef CAS PubMed
.
- M. I. Katsnelson and A. Fasolino, Acc. Chem. Res., 2013, 46, 97–105 CrossRef CAS PubMed
.
- W. Chen, Y. Li, G. Yu, Z. Zhou and Z. Chen, J. Chem. Theory Comput., 2009, 5, 3088–3095 CrossRef CAS PubMed
.
- D. W. Boukhvalov and M. I. Katsnelson, Nano Lett., 2008, 8, 4373–4379 CrossRef CAS PubMed
.
- D. W. Boukhvalov, M. I. Katsnelson and A. I. Lichtenstein, Phys. Rev. B: Condens. Matter Mater. Phys., 2008, 77, 035427 CrossRef
.
- D. W. Boukhvalov and M. I. Katsnelson, J. Phys.: Condens. Matter, 2009, 21, 344205 CrossRef CAS PubMed
.
Footnotes |
| † Electronic supplementary information (ESI) available. See DOI: 10.1039/c6cp01018k |
| ‡ Due to differences in reference (EH) comparing absolute values of Eb is only possible in the case of Tang et al.26 |
| This journal is © the Owner Societies 2016 |






![[thin space (1/6-em)]](https://www.rsc.org/images/entities/char_2009.gif)

