Different routes to methanol: inelastic neutron scattering spectroscopy of adsorbates on supported copper catalysts
Received
12th February 2016
, Accepted 5th April 2016
First published on 14th April 2016
Abstract
We have investigated methanol synthesis with model supported copper catalysts, Cu/ZnO and Cu/MgO, using CO/H2 and CO2/H2 as feedstocks. Under CO/H2 both catalysts show chemisorbed methoxy as a stable intermediate, the Cu/MgO catalyst also shows hydroxyls on the support. Under CO2/H2 the catalysts behave differently, in that formate is also seen on the catalyst. For the Cu/ZnO catalyst hydroxyls are present on the metal whereas for the Cu/MgO hydroxyls are found on the support. These results are consistent with a recently published model for methanol synthesis and highlight the key role of ZnO in the process.
Introduction
In commercial low-pressure methanol synthesis Cu/ZnO/Al2O3 catalysts have been successfully used for more than 50 years to convert synthesis gas (H2, CO, CO2) into methanol due to their high activity and excellent stability under typical reaction conditions of 250 °C and 50–100 bar. Despite the successful application of this catalyst and the development of promising Cu-based catalysts on a variety of different oxide supports1–4 the exact mechanism of this reaction is still not fully understood. In the past years, considerable efforts were made by experimentalists and theoreticians to elucidate the reaction mechanism and active center of methanol synthesis over conventional and the newly developed Cu-based catalysts.5–7 Work from the late 1970's proposed CO hydrogenation (eqn (1))as the primary reaction pathway for methanol synthesis8,9 until isotope labeling experiments identified CO2 as the main carbon source according to eqn (2)| | | CO2 + 3H2 → CH3OH + H2O, | (2) |
formed by the water gas shift reaction10,11 (eqn (3)) In accordance with this finding, the great majority of state-of-the-art methanol synthesis plants derive their synthesis gas from reforming or partial oxidation of natural gas close to stoichiometric composition with respect to formation of the end-product (i.e. CO2![[thin space (1/6-em)]](https://www.rsc.org/images/entities/char_2009.gif) :
:![[thin space (1/6-em)]](https://www.rsc.org/images/entities/char_2009.gif) CO ratio 1
CO ratio 1![[thin space (1/6-em)]](https://www.rsc.org/images/entities/char_2009.gif) :
:![[thin space (1/6-em)]](https://www.rsc.org/images/entities/char_2009.gif) 0.75).12,13 In the last few years, in addition to fossil-derived synthesis gas, also non-fossil synthesis gas received increasing attention, i.e. CO-rich gas derived from biomass gasification processes (CO2
0.75).12,13 In the last few years, in addition to fossil-derived synthesis gas, also non-fossil synthesis gas received increasing attention, i.e. CO-rich gas derived from biomass gasification processes (CO2![[thin space (1/6-em)]](https://www.rsc.org/images/entities/char_2009.gif) :
:![[thin space (1/6-em)]](https://www.rsc.org/images/entities/char_2009.gif) CO ratio ∼0.75
CO ratio ∼0.75![[thin space (1/6-em)]](https://www.rsc.org/images/entities/char_2009.gif) :
:![[thin space (1/6-em)]](https://www.rsc.org/images/entities/char_2009.gif) 1),14 or the hydrogenation of pure anthropogenic CO2 with “green” H2 derived from excess energy from renewable resources.13 Some of the authors recently published a model of the active site and proposed bi-metallic stepped facets, such as CuZn(211), as the CO2-converting centers,6,15 emphasizing the crucial role for Zn as a component of the active surface ensemble, which has been observed and debated in many previous literature reports.
1),14 or the hydrogenation of pure anthropogenic CO2 with “green” H2 derived from excess energy from renewable resources.13 Some of the authors recently published a model of the active site and proposed bi-metallic stepped facets, such as CuZn(211), as the CO2-converting centers,6,15 emphasizing the crucial role for Zn as a component of the active surface ensemble, which has been observed and debated in many previous literature reports.
Within this study and many others, formate (HCOO) was identified as a very stable reaction intermediate in the hydrogenation of CO2 (eqn (2)) via the formation of HCOOH (eqn (6)) and H2COOH (eqn (7)) according to the following scheme:5
| | | HCOO* + H* ↔ HCOOH* + * | (6) |
| | | HCOOH* + H* ↔ H2COOH* + * | (7) |
| | | H2COOH* + * ↔ H2CO* + OH* | (8) |
| | | H2CO* + H* ↔ H3CO* + * | (9) |
| | | H3CO* + H* ↔ CH3OH(g) + 2* | (10) |
| | | OH* + H* ↔ H2O(g) + 2* | (11) |
| | | HCO* + H* ↔ H2CO* + * | (14) |
The strong interaction of formate with the Cu surface was explained by Grabow
et al. by its very high binding energy of −2.68 eV for the Cu(111) facet.
5 On the (211) surface, the binding was found to be even stronger
6 rendering formate a very stable species on highly active surfaces and suggesting the further hydrogenation of formate to methoxy and methanol to be the rate-determining step in methanol synthesis from CO
2 over the industrial Cu/ZnO/Al
2O
3 catalysts.
12,15,16 The surface OH groups and the final product have lower binding energies and are removed as water (BE
Cu(111) = −0.21 eV) and methanol (BE
Cu(111) = −0.28 eV).
5 Again, DFT calculations have revealed a further increase of the adsorption strength also of other intermediates such as H
2COOH and H
3CO by alloying of Zn into the Cu-nanoparticles surface steps,
6,15 one aspect of the hotly debated Cu–ZnO synergy.
12
The evolution of such bimetallic, stepped surface facets is believed to be the result of a strong metal-support interaction (SMSI).17,18 For the industrial catalyst systems, indeed a pronounced Zn enrichment at the surface of the catalyst was observed by depth-sensitive XPS measurements,2 while no alloy formation in the bulk was observable under conventional synthesis conditions of 250 °C and 60 bar.19 This situation is different for catalytic systems, which contain MgO rather than ZnO as the oxide support. In earlier experiments, Cu/MgO catalysts showed a significant activity in CO/H2 containing feed gases.1 These results were more recently confirmed by laboratory performance studies carried out at 230 °C and 30 bar with a highly active Cu/MgO catalyst in CO/H2 feed gas.2 XPS depth-profiling experiments carried out on this catalyst revealed a Mg enrichment at the very outermost catalyst surface, but a generally much lower tendency of overlayer formation compared to Cu/ZnO, which was attributed to the weaker metal-oxide interaction owing to the less reducible nature of MgO.2 Considering that Cu/MgO is a very good CO hydrogenation catalyst, while Cu/ZnO is preferably hydrogenating CO2, the results indicate that the oxide support does not act only as a structural promoter, but also plays a determining role in the preferred pathway for the two routes of methanol synthesis from CO2/H2 or CO/H2 as the carbon source.1,2,15 In the many spectroscopic studies performed on Cu,20,21 ZnO22 or Cu/ZnO23–25/(Al2O3)26 in its unreduced27 or operational state28 the most abundant surface species found were formyl, methoxy and formate.12
In this work, we investigate the role of the oxide support of catalysts for methanol synthesis and in particular test the working hypothesis that methanol formation occurs through different mechanisms and intermediates depending on whether Zn is present or absent. For this purpose, we have prepared a conventional Al2O3-promoted Cu/ZnO (CZ) catalyst and a Cu/MgO catalyst without ZnO (CM), operated them both in CO/H2 and CO2/H2 syngas feeds and studied the post-reaction surface adsorbates by inelastic neutron scattering (INS) using the MAPS spectrometer29 at the ISIS Facility of the STFC Rutherford Appleton Laboratory. In contrast to comparable methods (e.g. FT-IR, DRIFTS), INS can be readily used on realistic nano-structured and black catalysts, probes a representatively large sample of ca. 20 g, furthermore it exhibits high sensitivity towards hydrogen-containing adsorbates on the catalyst across the entire mid-infrared, 0–4000 cm−1, range. The successful application of this method for catalyst characterization was formerly demonstrated by the groups of Albers, Lennon and Parker.30–34
Experimental
The catalytic reactions were carried out on previously described18 gas handling system that is designed to provide the large samples needed for INS spectroscopy. Approximately 35 g of the catalysts were loaded into a stainless steel tubular reactor and reduced in H2/He mixture (total flow 1.65 L min−1) RT to 523 K at ambient pressure. Following the reduction, the reactor was pressurized to 8 bar in feed gas at 523 K until a methanol signal was clearly visible in the on-line mass spectrometer. After the products had reached a steady state, the reactor outlet was closed to pressurize it to 20 bar. When the pressure was reached, the heating of the reactor was switched off, to let it cool to 308 K within 2 h. Afterwards, the reactor was purged with inert gas. The reactor was transferred into a glove box and the catalysts were loaded into an aluminum sachet and placed in a thin-walled, indium-sealed aluminum can. To obtain reasonable resolution across the whole spectral range three incident energies (Ei) were used: 4840, 2420 and 1210 cm−1. These focus on the C–H/O–H stretch, the C–H deformation and the O–H deformation regions respectively. Three spectra were acquired for 4 h and summed up at each energy. Unless otherwise stated, all the spectra presented of the catalysts are difference spectra: [(catalyst + adsorbate) − (reduced catalyst)]. The catalysts, their synthesis and physico-chemical characterization has been described in detail previously.2,6,15 In the reduced state, CZ and CM exhibit similar specific Cu surface areas of 14.7 and 13.6 m2 gcat−1, respectively, as determined by H2-TPD.35
Results
Methanol formation from CO/H2
Fig. 1 shows the exhaust gas composition as a function of time on stream for methanol formation over the CZ, Fig. 1a, and CM catalysts, Fig. 1b. It is clear that CO forms CO2, presumably by reaction with hydroxyl groups located on the oxide (ZnO or MgO), as in the case of hydrous palladium oxide.19
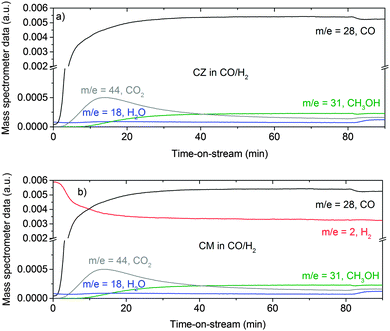 |
| | Fig. 1 Gas analysis during methanol synthesis at 6.31 bar and 523 K over the CZ (a) and CM (b) catalyst in CO/H2 feed gas (composition: 37.5 ml min−1 CO, 150 ml min−1 H2 and 1500 ml min−1 He). Due to a technological problem, the m/z = 2 trace in (a) is erroneous and not shown. The true evolution of the hydrogen concentration is expected to be similar to the trace shown in (b). | |
The presence of hydroxyls is seen in the INS spectra of the reduced catalysts before methanol synthesis occurs, Fig. 2. The assignments of INS bands encountered in this study are compiled in Table 1.
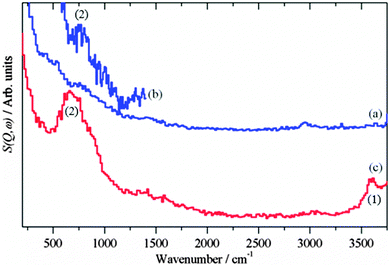 |
| | Fig. 2 INS spectra of the reduced catalysts before methanol synthesis was carried out. (a) Cu/ZnO (Ei = 4840 cm−1) (b) Cu/ZnO (Ei = 2420 cm−1) and (c) Cu/MgO (Ei = 4840 cm−1). (a) and (c) are plotted on the same ordinate scale. | |
Table 1 Observed bands of the adsorbed species and their assignment
| Process |
Catalyst |
Assignment (mark in fig.) |
| CZ/cm−1 |
CM/cm−1 |
| After reduction (Fig. 2) |
|
3600 |
O–H stretch of surface hydroxyl on the metal oxide (1) |
| 760 |
685 |
M–O–H bend of surface hydroxyl on the metal oxide (2) |
|
|
| CO/H2 (Fig. 3) |
|
3600 |
O–H stretch of surface hydroxyl on MgO (1) |
| 2940 |
2940 |
C–H stretch of adsorbed methoxy (2) |
| 1460 |
1460 |
OC–H bending modes of adsorbed methoxy (3) |
| 1160 |
1165 |
Methyl rock of adsorbed methoxy (4) |
|
|
765 |
Mg–O–H bend of surface hydroxyl (5) |
| 95 |
95 |
Methyl torsion of adsorbed methoxy (6) |
|
|
| CO2/H2 (Fig. 5) |
|
3600 |
O–H stretch of surface hydroxyl on MgO (1) |
| 3430 |
|
O–H stretch of surface hydroxyl on Cu (2) |
| 2970 |
2970 |
C–H stretch of adsorbed methoxy and formate (3) |
| 1450 |
1450 |
OC–H bending modes of adsorbed methoxy (4) |
| 1375 |
1375 |
In-plane O2C–H bend of adsorbed formate (5) |
| 1160 |
1160 |
Methyl rock of adsorbed methoxy (6) |
| 1055 |
|
Out-of-plane O2C–H bend of adsorbed formate (7) |
| 920 |
|
Cu–O–H bend of surface hydroxyl on Cu (8) |
|
|
765 |
Mg–O–H bend of surface hydroxyl (9) |
| 95 |
95 |
Methyl torsion of adsorbed methoxy (10) |
For the reduced CZ catalyst Fig. 2a, there are too few hydroxyls to allow detection of the O–H stretch, however, the stronger bending mode at 760 cm−1 is seen, Fig. 2b. For the CM catalyst Fig. 2c, the much higher density of hydroxyls enables both the stretch (3600 cm−1) and bend (690 cm−1) to be observed. Close inspection of Fig. 1a and b shows an increase in the water signal simultaneously with the CO2 spike, consistent with eqn (15).
Fig. 3 shows the background subtracted spectra of the catalysts (CZ Fig. 3a and CM Fig. 3b) after methanol synthesis in CO/H2 at 6.31 bar and 523 K. For comparison, the spectrum of solid methanol is also shown Fig. 3c. For the CZ catalyst, strong features are seen at 2940, 1450, 1160 and 95 cm−1. These are assigned as the C–H stretch, the C–H deformations, methyl rock and methyl torsion respectively of chemisorbed methoxy.20,21 These can be unambiguously assigned to methoxy rather than physisorbed methanol by the absence of the features relating to the O–H group of methanol: the O–H stretch at 3200 cm−1 and the C–O–H bend at 750 cm−1, that are seen in the reference spectrum, Fig. 3c. The same features are also seen for the CM catalyst, Fig. 3b, although there are additional features that are due to surface hydroxyls, cf.Fig. 2c, generated in the reaction. The hydroxyl bending mode occurs in the same region as the methanol C–O–H bend mode, so complicates the distinction between methoxy and physisorbed methanol. However, the shape of the C–H stretch on the CM catalyst at 2940 cm−1 is very similar to that seen on the CZ catalyst and distinctly different to the overlapping C–H and O–H stretch modes of solid methanol. Thus it is highly probable that methoxy is the dominant species on the CM catalyst as well. Methoxy typically adsorbs in an on-top mode on copper single crystal surfaces,36–38 but might be found in a bridged form on the supposedly important step sites as suggested by DFT.6
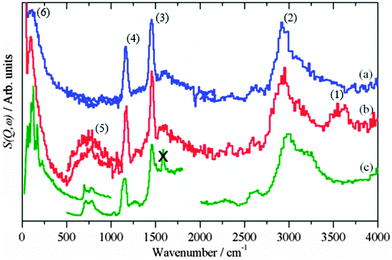 |
| | Fig. 3 Difference INS spectra after methanol synthesis in CO/H2: (a) CZ, (b) CM. (c) Reference spectrum of solid methanol. The region 4000–2000 cm−1 was recorded with Ei = 4840 cm−1, 2000–500 cm−1 with Ei = 2420 cm−1 and 500–0 cm−1 with Ei = 1210 cm−1, except for the 500–0 cm−1 region of solid methanol which was recorded with TOSCA and the spectrum obtained from the INS database at: http://wwwisis2.isis.rl.ac.uk/INSdatabase/. The feature marked by X is an instrumental artefact. | |
Methanol formation from CO2/H2
Fig. 4 shows the evolution of the product gas concentrations, CO as a product of the reverse water gas shift reaction and methanol and water as products of methanol synthesis from CO2, as a function of time on stream over the CZ, Fig. 4a, and CM catalysts, Fig. 4b. Unfortunately, there were experimental difficulties, so the profiles are not as clean as for the CO/H2 reaction, nonetheless, methanol formation is clearly observed over both catalysts. In good agreement with previous kinetic studies,2,15 the methanol productivity of the CM catalyst however is much lower than CZ. CM rather produces CO from the reverse water gas shift. This behaviour has been related to the absence of SMSI in this catalyst and its inability to convert formate to methanol in the absence of Zn.15
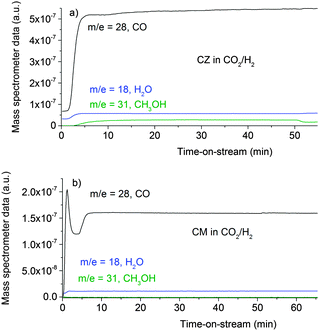 |
| | Fig. 4 Product analysis during methanol synthesis at 6.31 bar and 523 K over the CZ catalyst (a) and the CM catalyst (b) in CO2/H2 feed gas (composition: 37.5 ml min−1 CO2, 150 ml min−1 H2 and 1500 ml min−1 He). | |
Fig. 5 shows the background subtracted spectra of the catalysts (CZ Fig. 5a and CM Fig. 5b) after methanol synthesis in CO2/H2 at 6.31 bar and 523 K. A reference spectrum of Cu(HCOO)2·4H2O is also shown, Fig. 5c. For both catalysts, features are again seen at 2940, 1450, 1160 and 95 cm−1. As before, these are assigned to chemisorbed methoxy rather than physisorbed methanol, the downshift of the torsional mode from 110 cm−1 in methanol to 95 cm−1 in the chemisorbed species supports this assignment.
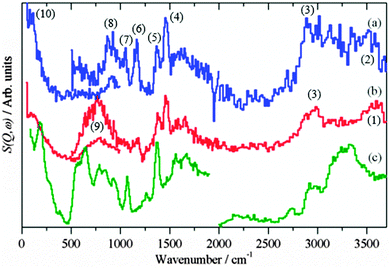 |
| | Fig. 5 Difference INS spectra after methanol synthesis in CO2/H2: (a) CZ, (b) CM. (c) Reference spectrum of Cu(HCOO)2·4H2O. The region 4000–2000 cm−1 was recorded with Ei = 4840 cm−1, 2000–500 cm−1 with Ei = 2420 cm−1 and 500–0 cm−1 with Ei = 1210 cm−1. | |
In contrast to the reaction in CO/H2, formate is also present on the surface. Both catalysts show the characteristic22,23 in-plane C–H deformation mode at 1375 cm−1, the weaker out-of-plane deformation is just visible at 1055 cm−1 in the CZ sample, Fig. 5a. Unfortunately, the mode of formate coordination (mono- or bidentate) cannot be distinguished here as the diagnostic modes are the symmetric and asymmetric C–O stretches which are invisible to INS. A second difference between the reactions is the CZ sample shows the presence of hydroxyls, bands at 3430 and 915 cm−1 for the O–H stretch and bend respectively. No clear indication of adsorbed water is seen in the spectra, but its presence cannot be unambiguously excluded and a small amount of water might be present.
Discussion
This work shows a clear distinction between the catalysts and different behaviour depending on the feedstock for methanol synthesis. Chemisorbed methoxy is observed in all cases, although the quantity varies considerably: CZ(CO/H2) ≈ CM(CO/H2) = 2.5 CM(CO2/H2) = 2 CZ(CO2/H2). This indicates that the methoxy is bonded to the copper in all cases. The spectra from the CO/H2 reaction represent a saturated monolayer on the catalyst that with the similar copper areas for both CZ and CM give similar intensities as there is no other species present on the catalyst, (the similarity of the hydroxyl spectra on CM before and after reaction shows that they are on the MgO). For the CO2/H2 reaction this is not the case and an additional species, formate, competes for space, again suggesting that the formate is on the copper. For the CM catalyst the total area of (methoxy + formate) ≈ (methoxy) for the CO2/H2 and CO/H2 processes respectively, supporting the idea of adsorption on the copper.
For the CZ catalyst in CO2/H2 the area occupied by the two carbonaceous intermediates is different in the two reactions, the combined area is less than half that of the CO/H2. In addition to formate, hydroxyls are also seen at 3460 and 920 cm−1 for the O–H stretch and bend respectively, these do not occur for the reaction under CO/H2. The position of the bending mode is significantly higher than was found for hydroxyls on the ZnO support, Fig. 2b. Comparison with hydroxyls in Cu(OH)2 and on RANEY® Cu, Fig. 6, shows that the hydroxyl bending mode for the CZ catalyst occurs in the region found for OH bonded to Cu. Together with the reduced total area of (methoxy + formate), this suggests that the hydroxyls are on the Cu component of the catalyst, rather than on the ZnO support, which is consistent with the observed product inhibition by the coupled product H2O during methanol synthesis from CO2 on Cu/ZnO catalysts.39
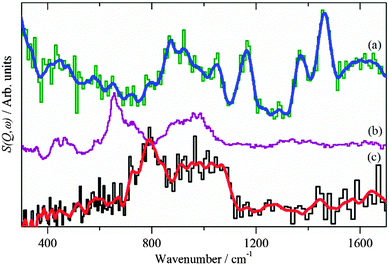 |
| | Fig. 6 (a) Difference INS spectrum of Cu/ZnO after methanol synthesis in CO2/H2 (Ei = 2420 cm−1). Reference spectra of: (b) Cu(OH)2 (Aldrich) and (c) hydroxyls on RANEY® Cu (dried at 120 °C in flowing He). The blue and red lines are the smoothed raw spectra. (b) and (c) were recorded at 20 K on TOSCA. In this region the instruments provide very similar spectra, thus all the spectra may be directly compared. | |
As described in the Introduction, methanol synthesis has been the subject of extensive theoretical work.6,15Fig. 7 shows the Gibbs free energy calculated by DFT for the CO/H2, Fig. 7a, and the CO2/H2, Fig. 7b, reactions.15 Our results are completely consistent with this model. For the CO/H2 reaction, it can be seen that on both the Cu-only and the Cu–Zn surfaces the only stable hydrogenous intermediate is methoxy. In contrast, for the CO2/H2 reaction, both formate and methoxy are stable intermediates. The calculations also show that hydroxyls should be present on the metal surface, these are seen for the CZ catalyst but not for the CM, presumably these are more stable on the MgO and so spillover onto the MgO. It is noted that a kinetic model calculated for differential conversion showed formate to be the only dominating surface species on CZ.15 The is due to the stronger bonding compared to the other intermediates and the overall lower amount of the product-like intermediate methoxy under such conditions. Thus, co-adsorption is characterized by a competition between hydroxyl and methoxy with formate and the coverage will depend on the chemical potentials given be the pressure and conversion. In this experiment, due to the closure of the exhaust gas stream and the build-up of pressure before the INS measurements, we are likely away from differential conversions explaining the observed substantial amount of methoxy and hydroxyls compared to previous kinetic modelling.
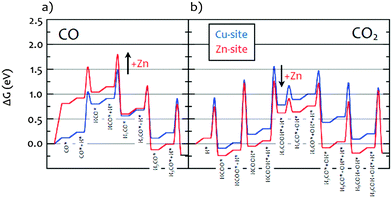 |
| | Fig. 7 Gibbs free energy diagram obtained from DFT calculations15 for the reaction under: (a) CO/H2 and (b) CO2/H2 on stepped Cu(211), blue “Cu-site” representing CM, and a Zn-decorated steps CuZn(211), red “Zn-site” representing CZ. Zn substitution was modeled by replacing all step atoms of Cu(211) with Zn. All energies are relative to CO2 + 3H2 (CO + 2H2) in the gas phase and the clean surfaces. Intermediates marked with a star are adsorbed on the surface. Gibbs free energies were calculated at T = 503 K and a total P of 30 bar. | |
Conclusions
We have investigated methanol synthesis with model supported copper catalysts using CO/H2 and CO2/H2 as feedstocks. Under CO/H2 both catalysts show chemisorbed methoxy as a stable intermediate, the CM catalyst also shows hydroxyls on the support. Under CO2/H2 the catalysts behave differently, in that formate is also seen on the catalyst. For the CZ catalyst hydroxyls are present on the metal whereas for the CM material hydroxyls are found on the support. These results are consistent with a recently published model2 for methanol synthesis, in which reduced Zn species on stepped copper surfaces are responsible to the hydrogenation of formate to methanol copper and, thus, highlight the key role of ZnO in the process.
Acknowledgements
The authors would like to thank Julia Schumann, Stefan Zander, Nygil Thomas and Florian Ribicki for sample preparation, discussions and assistance. The STFC Rutherford Appleton Laboratory is acknowledged for the allocation of neutron beam time. This research project has been supported by the European Commission under the 7th Framework Programme, NMI3-II Grant number 283883, CP-CSA_INFRA-2008-1.1.1.
References
- B. Denise and R. P. A. Sneeden, Appl. Catal., 1986, 28, 235–239 CrossRef CAS.
- S. Zander, E. L. Kunkes, M. E. Schuster, J. Schumann, G. Weinberg, D. Teschner, N. Jacobsen, R. Schlögl and M. Behrens, Angew. Chem., Int. Ed., 2013, 52, 6536–6540 CrossRef CAS PubMed.
- Y. Choi, K. Futagami, T. Fujitani and J. Nakamura, Appl. Catal., A, 2001, 208, 163–167 CrossRef CAS.
- R. Burch, S. E. Golunski and M. S. Spencer, J. Chem. Soc., Faraday Trans., 1990, 86, 2683–2691 RSC.
- L. C. Grabow and M. Mavrikakis, ACS Catal., 2011, 1, 365–384 CrossRef CAS.
- M. Behrens, F. Studt, I. Kasatkin, S. Kühl, M. Hävecker, F. Abild-Pedersen, S. Zander, F. Girgsdies, P. Kurr, B.-L. Kniep, M. Tovar, R. W. Fischer, J. K. Nørskov and R. Schlögl, Science, 2012, 336, 893–897 CrossRef CAS PubMed.
- Z.-J. Zuo, L. Wang, P.-D. Han and W. Huang, Appl. Surf. Sci., 2014, 290, 398–404 CrossRef CAS.
- H. H. Kung, Catal. Rev., 1980, 22, 235–259 CAS.
-
K. Klier, in Advances in Catalysis, ed. H. P. D. D. Eley and B. W. Paul, Academic Press, 1982, vol. 31, pp. 243–313 Search PubMed.
- G. C. Chinchen, P. J. Denny, D. G. Parker, M. S. Spencer and D. A. Whan, Appl. Catal., 1987, 30, 333–338 CrossRef CAS.
- A. Deluzarche, R. Kieffer and A. Muth, Tetrahedron Lett., 1977, 18, 3357–3360 CrossRef.
-
J. B. Hansen and P. E. Højlund Nielsen, Handbook of Heterogeneous Catalysis, Wiley-VCH Verlag GmbH & Co. KGaA, 2008 DOI:10.1002/9783527610044.hetcat0148.
-
G. A. Olah, A. Goeppert and G. K. S. Prakash, Beyond oil and gas: the methanol economy, Wiley-VCH, Weinheim an der Bergstrasse, Germany, 2006 Search PubMed.
- M. Ruggiero and G. Manfrida, Renewable Energy, 1999, 16, 1106–1109 CrossRef CAS.
- F. Studt, M. Behrens, E. L. Kunkes, N. Thomas, S. Zander, A. Tarasov, J. Schumann, E. Frei, J. B. Varley, F. Abild-Pedersen, J. K. Nørskov and R. Schlögl, ChemCatChem, 2015, 7, 1105–1111 CrossRef CAS.
- M. Bowker, R. A. Hadden, H. Houghton, J. N. K. Hyland and K. C. Waugh, J. Catal., 1988, 109, 263–273 CrossRef CAS.
- R. N. d'Alnoncourt, X. Xia, J. Strunk, E. Loffler, O. Hinrichsen and M. Muhler, Phys. Chem. Chem. Phys., 2006, 8, 1525–1538 RSC.
- T. Lunkenbein, J. Schumann, M. Behrens, R. Schlögl and M. G. Willinger, Angew. Chem., 2015, 127, 4627–4631 CrossRef.
- T. Kandemir, F. Girgsdies, T. C. Hansen, K.-D. Liss, I. Kasatkin, E. L. Kunkes, G. Wowsnick, N. Jacobsen, R. Schlögl and M. Behrens, Angew. Chem., Int. Ed., 2013, 52, 5166–5170 CrossRef CAS PubMed.
- P. A. Taylor, P. B. Rasmussen, C. V. Ovesen, P. Stoltze and I. Chorkendorff, Surf. Sci., 1992, 261, 191–206 CrossRef CAS.
- I. Chorkendorff, P. A. Taylor and P. B. Rasmussen, J. Vac. Sci. Technol., A, 1992, 10, 2277–2281 CAS.
- J. Howard, I. J. Braid and J. Tomkinson, J. Chem. Soc., Faraday Trans. 1, 1984, 80, 225–235 RSC.
- V. A. Trunov, A. E. Sokolov, V. T. Lebedev, O. P. Smirnov, A. I. Kurbakov, J. Van den Heuvel, E. Batyrev, T. M. Yurieva, L. M. Plyasova and G. Török, Phys. Solid State, 2006, 48, 1291–1297 CrossRef CAS.
- C. H. Rochester, Catal. Lett., 1998, 52, 121 CrossRef CAS.
- N.-Y. Topsøe and H. Topsøe, J. Mol. Catal. A: Chem., 1999, 141, 95–105 CrossRef.
- A. R. McInroy, D. T. Lundie, J. M. Winfield, C. C. Dudman, P. Jones, S. F. Parker, J. W. Taylor and D. Lennon, Phys. Chem. Chem. Phys., 2005, 7, 3093–3101 RSC.
- A. A. Khassin, H. Jobic, G. A. Filonenko, E. V. Dokuchits, A. V. Khasin, T. P. Minyukova, N. V. Shtertser, L. M. Plyasova and T. M. Yurieva, J. Mol. Catal. A: Chem., 2013, 373, 151–160 CrossRef CAS.
- S. Bailey, G. F. Froment, J. W. Snoeck and K. C. Waugh, Catal. Lett., 1994, 30, 99–111 CrossRef CAS.
- S. F. Parker, D. Lennon and P. W. Albers, Appl. Spectrosc., 2011, 65, 1325–1341 CrossRef CAS.
- D. Lennon, D. T. Lundie, S. D. Jackson, G. J. Kelly and S. F. Parker, Langmuir, 2002, 18, 4667–4673 CrossRef CAS.
- A. R. McInroy, D. T. Lundie, J. M. Winfield, C. C. Dudman, P. Jones, S. F. Parker and D. Lennon, Catal. Today, 2006, 114, 403–411 CrossRef CAS.
- A. R. McInroy, D. T. Lundie, J. M. Winfield, C. C. Dudman, P. Jones, S. F. Parker, J. W. Taylor and D. Lennon, Phys. Chem. Chem. Phys., 2005, 7, 3093–3101 RSC.
-
P. W. Albers and S. F. Parker, Applications of neutron scattering in the chemical industry: proton dynamics of highly dispersed materials, characterization of fuel cell catalysts and catalysts from large-scale chemical processes, in Neutron Applications in Earth, Energy and Environmental Sciences, ed. L. Liang, R. Rinaldi and H. Schober, Springer, 2009, pp. 391–416 Search PubMed.
-
P. C. H. Mitchell, S. F. Parker, A. J. Ramirez-Cuesta and J. Tomkinson, Vibrational Spectroscopy with Neutrons: With Applications in Chemistry, Biology, Materials Science and Catalysis, World Scientific, 2005 Search PubMed.
- M. B. Fichtl, J. Schumann, I. Kasatkin, N. Jacobsen, M. Behrens, R. Schlögl, M. Muhler and O. Hinrichsen, Angew. Chem., 2014, 126, 7163–7167 CrossRef.
- J. P. Camplin and E. M. McCash, Surf. Sci., 1996, 360, 229–241 CrossRef CAS.
- M. A. Chesters and E. M. McCash, Spectrochim. Acta, Part A, 1987, 43, 1625–1630 CrossRef.
- K. Mudalige and M. Trenary, Surf. Sci., 2002, 504, 208–214 CrossRef CAS.
- M. Sahibzada, I. S. Metcalfe and D. Chadwick, J. Catal., 1998, 174, 111–118 CrossRef CAS.
|
| This journal is © the Owner Societies 2016 |
Click here to see how this site uses Cookies. View our privacy policy here.  Open Access Article
 *e
*e
![[thin space (1/6-em)]](https://www.rsc.org/images/entities/char_2009.gif) :
:![[thin space (1/6-em)]](https://www.rsc.org/images/entities/char_2009.gif) CO ratio 1
CO ratio 1![[thin space (1/6-em)]](https://www.rsc.org/images/entities/char_2009.gif) :
:![[thin space (1/6-em)]](https://www.rsc.org/images/entities/char_2009.gif) 0.75).12,13 In the last few years, in addition to fossil-derived synthesis gas, also non-fossil synthesis gas received increasing attention, i.e. CO-rich gas derived from biomass gasification processes (CO2
0.75).12,13 In the last few years, in addition to fossil-derived synthesis gas, also non-fossil synthesis gas received increasing attention, i.e. CO-rich gas derived from biomass gasification processes (CO2![[thin space (1/6-em)]](https://www.rsc.org/images/entities/char_2009.gif) :
:![[thin space (1/6-em)]](https://www.rsc.org/images/entities/char_2009.gif) CO ratio ∼0.75
CO ratio ∼0.75![[thin space (1/6-em)]](https://www.rsc.org/images/entities/char_2009.gif) :
:![[thin space (1/6-em)]](https://www.rsc.org/images/entities/char_2009.gif) 1),14 or the hydrogenation of pure anthropogenic CO2 with “green” H2 derived from excess energy from renewable resources.13 Some of the authors recently published a model of the active site and proposed bi-metallic stepped facets, such as CuZn(211), as the CO2-converting centers,6,15 emphasizing the crucial role for Zn as a component of the active surface ensemble, which has been observed and debated in many previous literature reports.
1),14 or the hydrogenation of pure anthropogenic CO2 with “green” H2 derived from excess energy from renewable resources.13 Some of the authors recently published a model of the active site and proposed bi-metallic stepped facets, such as CuZn(211), as the CO2-converting centers,6,15 emphasizing the crucial role for Zn as a component of the active surface ensemble, which has been observed and debated in many previous literature reports.


