Silane-initiated nucleation in chemically active plasmas: validation of density functionals, mechanisms, and pressure-dependent variational transition state calculations†
Received
5th February 2016
, Accepted 10th March 2016
First published on 11th March 2016
Abstract
The growth of anionic silicon hydride clusters is a critically important process in nanodusty plasmas. In the current study, we focus on the formation of homologs of silylene (Sin+1H2n+2−, n = 3, 4) and silyl (SinH2n+1−, n = 4, 5) anions via anion–neutral reaction pathways. Species like silyl or silylene anions and their related elementary reactions, which are involved in the formation of silicon hydride clusters, were not used in developing exchange–correlation (xc) density functionals (i.e., they were not included in the training set of semiempirical density functionals); therefore, we explored the accuracy of various widely used xc density functionals based on reaction energies and barrier heights. Among the 21 density functionals we tested, M06-2X has the best performance for a hybrid functional, and MN15-L has the best performance for a local functional. Thermal rate constants of the elementary reactions involved in the reaction mechanism are calculated using M06-2X and multistructural canonical variational transition state theory with the small-curvature tunneling approximation (MS-CVT/SCT). The pressure dependence of unimolecular isomerization reactions is treated with system-specific quantum RRK theory (SS-QRRK) and the Lindemann–Hinshelwood mechanism.
1. Introduction
The growth of nanoparticles in nanodusty plasmas is an active research field in plasma physics, chemistry, and engineering. Many physical and chemical processes are involved in the formation of nanoparticles in chemically active plasmas, including nucleation, isomerization, electron capture and ionization, and mass and momentum transport. Anion–neutral reactions are one of the major chemical reactions in silicon hydride clustering in silane-containing reactive plasmas.1,2 Rate constants of anion–neutral reactions are used in building transport equations or boundary conditions in many simulation studies for investigating the distribution of the sizes of nanoparticles and their population in a plasma.3–7 However, due to the complexity of the systems and the unusual conditions of the chemical reactions (i.e., plasma), accurate experimental measurements for these anion–neutral reactions are very difficult and hence are scarce. The majority of the reaction rates needed for modeling nanodusty plasmas are empirically estimated, and Agarwal and Girshick8 noted that “there is considerable uncertainty in the values of rate constants for anion–neutral reactions that are primarily responsible for clustering in this system, and thus any correction factor one might apply for the predicted nucleation rate would itself be highly uncertain”. Theoretical calculations of chemical structures, energetics, and thermal rate constants can play an important role in reducing the uncertainty involved in plasma modeling. Although fast empirical methods for estimating thermodynamic functions and rate constants exist,9 we do not use such approach in the current work; thermodynamic functions and thermal rate constants reported in this work are computed from ab initio calculations.
Silyl anion (SinH2n+1−) reactions with silane and silylene anion (Sin+1H2n+2−) reactions with silane are the dominant anionic pathways for the formation of nanoparticles in plasmas. Higher homologs of silicon hydrides with branched chains are generated in these reactions, which proceed with the elimination of molecular hydrogen. The silicon hydrides formed via silyl anion–silane reactions are H3SiH2Si:− → (H3Si)2HSi:− → (H3Si)3Si:− → (H3Si)3SiH2Si:−, where “:” represents paired electrons on the terminal Si atom; the silicon hydrides formed via silylene anion–silane reactions are H3SiHSi˙− → H3SiH2SiHSi˙− → (H3Si)2HSiHSi˙− → (H3Si)3SiHSi˙−, where “˙” represents an unpaired electron on the terminal Si atom.
In the present study, we focus on clusters that contain no more than five silicon atoms. The chemical mechanism of the initial step of the clustering process, i.e., the formation of (H3Si)2HSi:− and H3SiH2SiHSi˙−, has been investigated in a previous work.10 In the current work, since the studied kind of system is not represented in the training set of any density functional known to us, we carry out benchmark tests for various density functionals, and this provides an opportunity to investigate the transferability of various semiempirical exchange–correlation functionals. Chemical structures, energetics, and thermal rate constants in the mechanisms are computed using the best functional among the functionals we tested in this work.
Two unimolecular isomerization reactions are involved in the reaction mechanism we propose in this work, and the pressure dependences of their thermal rate constants are estimated using system-specific quantum Rice–Ramsperger–Kassel (SS-QRRK) theory combined with the Lindemann–Hinshelwood thermal activation mechanism. The SS-QRRK method was proposed recently11 as a convenient way to use variational transition state theory to treat pressure dependences of chemical reaction rates, and it was applied to a chemical activation mechanism; the present article is the first application to a thermally activated unimolecular reaction. For a chemically activated unimolecular reaction, the low-pressure rate constants of the formation of the stabilized adduct are lower than the high-pressure-limit, and the rate constants of the further isomerization/dissociation of the formed adduct are larger than the high-pressure equilibrium rate constant; and in thermally activated unimolecular reactions, the low-pressure rate constants are smaller than the high-pressure equilibrium rate constant, and hence the pressure effect for this kind of reaction is called “falloff.”
2. Theoretical background
2.1. High-pressure-limit thermal rate constants
High-pressure-limit thermal rate constants are computed using multi-structural canonical variational transition state theory with the small-curvature tunneling approximation (MS-CVT/SCT) as follows:12–15| | | kMS-CVT/SCT = FactκSCT1ΓCVT1kTST1 | (1) |
where Fact is multi-structural torsional potential anharmonicity factor of activation16,17 computed by MS-T(C) method;18κSCT1 is a small-curvature tunneling transmission coefficient for the lowest-energy conformer of the transition state, ΓCVT1 is CVT variational transmission coefficient for the lowest-energy path, and kTST1 is the conventional transition state theory rate constant computed based on the lowest-energy path:| |  | (2) |
where Q‡ and QR are rigid-rotor–harmonic-oscillator partition functions for the transition state structure and reactant; ΦR is the reactants partition function per unit volume. V‡ is the barrier height, kB is the Boltzmann constant, h is Planck's constant, and T is absolute temperature. Expressing the TST rate constant in the form of eqn (2), the rotational partition function does not contain rotational symmetry number; the rotational symmetry number is included in the reaction symmetry number σrxn as follows:19| |  | (3) |
where σR and σ‡ are the rotational symmetry number for the reactant and transition state structure, which are equal to the order of the rotational subgroup for polyatomic molecule; rotational symmetry number is 1 for heteronuclear diatomic molecule and 2 for homonuclear diatomic molecule. The reaction symmetry number we used here excludes the non-superimposable mirror-image conformers; the contributions from these mirror-image conformers are treated within MS-T method. However, the contributions from enantiomers should be included in the reaction symmetry number or the rotational partition function if the MS-T method is not applied.19,20 The reaction symmetry numbers for forward and reverse reactions involved in the current study are tabulated in the ESI.†
2.2. System-specific quantum RRK theory with Lindemann–Hinshelwood theory
In this section, we consider the effect of pressure on the unimolecular reactions by using SS-QRRK theory11 with the Lindemann–Hinshelwood mechanism.
For a unimolecular reaction, the following Lindemann–Hinshelwood thermal activation mechanism is considered:21
where A(
T) represents the thermally equilibrated reactant at temperature
T; M is the bath gas; A*(
E) is the rovibrationally excited molecule with total rovibrational energy
E; and P is the isomerization product. This mechanism includes the RRK assumption that energy in A* is rapidly statistically redistributed among modes subject only to the constraint of total energy
E so that the reactivity of A* is simply a function of total energy. The rate constant of energization is
k1, and the rate constant of isomerization is
k2, and by the RRK assumption both of these rate constants depend on the total energy of A*; and
k1 also depends parametrically on temperature
T. The rate constant of de-energization is
kc and is treated as temperature-dependent but energy-independent, which is the strong collision assumption. However the strong-collision assumption is mitigated in the present work by computing
kc as the product of the Lennard-Jones collision rate constant and a collision efficiency factor
βc, where the latter is computed by using Troe's modified collision model.
22,23
The pressure-dependent unimolecular reaction rate constant kuni(T, p) for the above mechanism is:24–26
| |  | (4) |
where
K(
E,
T) is the equilibrium constant of the first step, [M] is the concentration of bath gas,
p is pressure, and
E0 is the threshold energy. Note that
K(
E,T) is mixed-ensemble equilibrium constant, representing the thermal equilibrium of species A* in a microcanonical ensemble at energy
E with species A in a thermal ensemble with temperature
T. Therefore,
| |  | (5) |
where
ρ(
E) is the density of states, and
QA(
T) is the rovibrational partition function of A.
In QRRK theory,24,27 one models the states of A and A* as the discrete states of a system with s uncoupled harmonic oscillator modes, each with frequency ![[small omega, Greek, macron]](https://www.rsc.org/images/entities/i_char_e0da.gif) in wave numbers (e.g., cm−1). Then the integrals over E are replaced by sums over n, where n is the number of quanta excited at energy E (n = E/hc
in wave numbers (e.g., cm−1). Then the integrals over E are replaced by sums over n, where n is the number of quanta excited at energy E (n = E/hc![[small omega, Greek, macron]](https://www.rsc.org/images/entities/i_char_e0da.gif) , where the zero of energy is the potential energy of the equilibrium structure of A). With this model and with [M] given by the ideal gas law, eqn (4) can be written as:
, where the zero of energy is the potential energy of the equilibrium structure of A). With this model and with [M] given by the ideal gas law, eqn (4) can be written as:
| |  | (6) |
where
| |  | (7) |
| | m = E0/hc![[small omega, Greek, macron]](https://www.rsc.org/images/entities/i_char_e0da.gif) | (8) |
and
R is ideal gas constant, and
c is the speed of light. Notice that in the limit of
p → ∞, the high-pressure-limit unimolecular rate constant is recovered in
eqn (4) and (6), and in the low-pressure limit, the unimolecular rate “constant” is no longer a constant (
i.e., no longer independent of concentrations), but rather is proportional to [M] or
p.
In SS-QRRK, we use eqn (6)–(8) with ![[small omega, Greek, macron]](https://www.rsc.org/images/entities/i_char_e0da.gif) taken as the geometric mean of the s vibrational frequencies of A (where s is 3N − 6, and N is the number of atoms in A), and with E0 and the microcanonical isomerization rate constant k2(E) parameterized by using QRRK theory calibrated to match the MS-CVT/SCT canonical rate constant at high pressure. In QRRK theory, the microcanonical rate constant is a frequency factor A (with units of reciprocal time) times the probability that a molecule with n quanta of vibrational theory has at least m quanta in one of the modes (the reactive mode), where m is given in terms of the threshold energy by eqn (8). This yields24
taken as the geometric mean of the s vibrational frequencies of A (where s is 3N − 6, and N is the number of atoms in A), and with E0 and the microcanonical isomerization rate constant k2(E) parameterized by using QRRK theory calibrated to match the MS-CVT/SCT canonical rate constant at high pressure. In QRRK theory, the microcanonical rate constant is a frequency factor A (with units of reciprocal time) times the probability that a molecule with n quanta of vibrational theory has at least m quanta in one of the modes (the reactive mode), where m is given in terms of the threshold energy by eqn (8). This yields24
| |  | (9) |
Substituting this into
eqn (6), carrying out the sum, and taking the limit of
p → ∞ yields the Arrhenius form:
19,24| | kQRRKuni(T, p = ∞) = A![[thin space (1/6-em)]](https://www.rsc.org/images/entities/char_2009.gif) exp(−mhc exp(−mhc![[small omega, Greek, macron]](https://www.rsc.org/images/entities/i_char_e0da.gif) /RT) /RT) | (10) |
Thus, to parameterize QRRK theory, the parameter
m is calculated from the MS-CVT/SCT Arrhenius activation energy
EMS-CVT/SCTa(
T):
| |  | (11) |
| |  | (12) |
and the frequency factor
A in QRRK theory is set equal the MS-CVT/SCT Arrhenius pre-exponential factor,
i.e.,
| | A(T) = kMS-CVT/SCT(T)![[thin space (1/6-em)]](https://www.rsc.org/images/entities/char_2009.gif) exp[EMS-CVT/SCTa(T)/RT] exp[EMS-CVT/SCTa(T)/RT] | (13) |
Note that both
E0 and
A depend on temperature in the parameterized rate expression. Therefore
k2(
E) in
eqn (6) becomes
k2(
E,
T) given by
eqn (9) and (11)–(13). The sum in
eqn (6) is evaluated with a step size of one quantum, and the factorials therefore all have non-integer arguments and are evaluated using gamma functions.
The de-energization rate constant is modeled as in our previous work,11 using empirical Lennard-Jones parameters, the average energy transferred, and the energy dependence factor FE of the density of states (which is the thermal population of unimolecular states above the threshold energy of the reactant normalized by a density of states factor at the threshold energy); these quantities are given in Section 3.4.
3. Computational details
3.1. Electronic structure calculations
Initial geometries of the reactants, products, and transition state structures are optimized with the M08-HX functional28 and the MG3S basis29 for benchmark studies; tight convergence criteria are used for both the SCF calculations and the geometry optimizations. For silicon atoms, the MG3S basis is equivalent to the 6-311+G(3d2f) basis, and for hydrogen atoms it is equivalent to the 311G(2p) basis.30–32 All the density functional integrations are carried out with a grid of 99 radial shells around each atom and 974 angular points per shell.33 All the electronic structure calculations are performed with a locally modified version of the Gaussian 09 software.34,35
In order to test the accuracy of various popular density functionals for silyl or silylene anions reactions, a benchmark study was carried out based on classical barrier heights and classical energies of reactions (these are relative Born–Oppenheimer potential energies at stationary points and are exclusive of zero-point or thermal vibrational energy). Five reactions (as summarized in Table 1) were selected from our proposed reaction mechanisms for use in the benchmark study.
Table 1 Reactions used in benchmark study
| |
Chemical equation |
Reaction type |
| R1 |
SiH3SiHSiH2− + SiH4 → (SiH3)2SiHSiH2− + H |
Nucleophilic reaction |
| R2 |
(SiH3)2SiHSiH2− + H → (SiH3)2SiHSiH− + H2 |
Hydrogen (H) abstraction |
| R3 |
(SiH3)2SiH− + SiH4 → (SiH3)2SiH2 + SiH3− |
Hydrogen (H) abstraction |
| R4 |
(SiH3)2SiH2 + SiH3− → (SiH3)2SiHSiH2− + H2 |
Hydrogen (H2) elimination |
| R5 |
(SiH3)2SiHSiH2− → (SiH3)2SiSiH3− |
Intramolecular hydrogen migration |
Single-point energy calculations are performed based on M08-HX/MG3S geometries using various density functionals (tabulated in Table 2) combined with the MG3S, jun-cc-pVTZ36 and jul-cc-pVTZ37 basis sets. Density functionals tested in the current work includes three local functionals (M11-L,38 MN12-L,39 and MN15-L40) and 18 hybrid functionals (B3LYP,41 PBE0,42 TPSSh,43 MGGA_MS2h,44 MPW1K,45 M05,46 M06,47 M05-2X,48 M06-2X,47 M08-HX,28 M08-SO,28 M11,49 MN12-SX,50 SOGGA11-X,51 B97-3,52 HSE06,53 τHCTHhyb,54 and ωB97X-D55).
Table 2 Exchange–correlation functionals tested in the current work and their percentage of non-local Hartree–Fock exchange (% X)
| Functional |
% X |
xcF |
% X |
xcF |
% X |
|
The percentage of Hartree–Fock exchange increases from the first value listed for small interelectronic separation to 100% at large interelectronic separation.
The percentage of Hartree–Fock exchange decreases from 25% at small interelectronic separation to 0 at large interelectronic separation.
|
| M11-L |
0 |
ωB97X-D |
22.2–100a |
SOGGA11-X |
35.42 |
| MN12-L |
0 |
HSE06 |
25–0b |
MPW1K |
42.8 |
| MN15-L |
0 |
MN12-SX |
25–0b |
M11 |
42.8–100a |
| MGGAMS2h |
9 |
PBE0 |
25 |
M08-HX |
52.23 |
| TPSSh |
10 |
B97-3 |
26.93 |
M06-2X |
54 |
| τHCTHhyb |
15 |
M06 |
27 |
M05-2X |
56 |
| B3LYP |
20 |
M05 |
28 |
M08-SO |
56.79 |
The reference energy values are computed by CCSD(T)56/CBS, where the complete basis set (CBS) limit is obtained by the following strategy:57
| | | ECCSD(T)CBS = EMP2CBS + (ECCSD(T)SBS − EMP2SBS) | (14) |
where SBS means the small basis set (which is aug-cc-pVTZ
37,58 in the current work), and the MP2
59/CBS energy is computed by respectively extrapolating the Hartree–Fock (HF) exchange energy and MP2 correlation energy as follows:
60–64| |  | (15) |
| |  | (16) |
where
| |  | (17) |
In the above equations, we use
X = 4 (which is taken as aug-cc-pVQZ) and
X − 1 = 3 (which is taken as aug-cc-pVTZ). Finally,
| | | EMP2CBS = EHFCBS + EcorrCBS | (18) |
3.2. Direct dynamics calculations
For the direct dynamics calculations, all the species are re-optimized by M06-2X/MG3S, which was selected as the level for direct dynamics calculations based on the benchmark tests (as will be discussed in Section 4.1).
Canonical variational transition state theory calculations with the small-curvature tunneling approximation were carried out in non-redundant internal coordinates65,66 with a step size of 0.002 a0 (note: 1 a0 = 1 bohr = 0.5292 Å). The minimum energy paths (MEPs) are computed using Page–McIver algorithm67 from −2.0 to +2.0 a0. The RODS algorithm68 was used to re-orient the generalized-transition-state-theory dividing surface. A scaling factor 0.97069 was used to scale all the vibrational frequencies in the generalized normal mode calculations.
For bimolecular reactions with a negative barrier, the small-curvature tunneling transmission coefficient was computed using the ion–dipole complex as the initial state; the final bimolecular reaction rate constant is the product of the so-obtained tunneling transmission coefficient with the bimolecular reaction rate constant computed without tunneling. This is consistent with the fact that the tunneling calculation is performed for the high-pressure limit where the ion–dipole complex is fully thermalized (the issue of tunneling from the states of the precursor complex at lower energies than the bimolecular reactant ground state is discussed elsewhere70,71). Multi-structural torsional anharmonicity (MS-T) rovibrational partition functions were computed using the MSTor program;72 VTST calculations were performed with the Polyrate73 and Gaussrate74 programs.
3.3. Torsional anharmonicity
The multi-structural torsional anharmonicity (MS-T) rovibrational partition functions are computed based on coupled effective torsional potentials. The local periodicities of –SiH3 groups are set to be 3. The MS-T partition functions include the contributions from all the distinguishable conformational structures including non-superimposable mirror images.
3.4. Parameters used in de-energization
In the current study, Ar gas, which is commonly used in chemical vapor decomposition75 (CVD) and in studying nucleation processes in plasmas,8 is selected as the bath gas used in estimation of the pressure-dependent rate constants of the unimolecular isomerization reactions. Lennard-Jones parameters ε/kB and σ are taken for Ar as 120 K and 3.4 Å76 and for Si4Hn species as 254 K and 5.8 Å, as used in previous silane plasma modeling.77
The energy transfer parameter 〈ΔE〉, which is the average energy transferred during both energization and de-energization processes and which is used for computing the collision efficiency factor, is chosen to be 740 cal mol−1; this value has been used previously for modeling SiH4 colliding with Ar.78 The Si clusters we considered in the current work are larger than SiH4, and therefore one might hypothesize that a larger energy transfer parameter 〈ΔE〉 should be used. To test this, we repeated the calculations for reaction RB, step 1 with a doubled energy transfer parameter of 1480 cal mol−1, and we found that the obtained falloff curves (shown in Fig. S2 in ESI†) are not sensitive to this change. Doubling the energy transfer parameter leads to larger k(p) values (i.e., stronger collisions and smaller falloff effect) and at most a factor of 2 difference. (The maximum effect is at 1500 K, 0.001 bar.) The collision parameters and energy transfer parameters, in principle, could be determined from theoretical trajectory calculations;79 we do not use such approach in the current work based on computational cost and the desire for a simple method that can be widely used in mechanism development.
The energy dependence factor FE of the density of states can be directly computed using Troe's definition:22
| |  | (19) |
with density of states computed from MS-T partition function by inverse Laplace transform; alternatively,
FE can be computed by the empirical Whitten–Rabinovitch approximation using
eqn (6) and (8) in Troe's work.
80FE is used to compute the collision efficiency coefficient
βc using the following equation:
| |  | (20) |
For falloff calculations on (SiH3)2SiHSiH−, we used FE values computed from MS-T partition function in eqn (19) which yields 1.55, 1.84, and 2.85 at 298 K, 400 K, and 600 K, respectively, for comparison, FE values computed using Whitten–Rabinovitch approximation at 298 K, 400 K, and 600 K are 1.43, 1.63, and 2.30, which agree with the values we used within 8, 11, and 19%, respectively. The FE values computed from MS-T partition function for (SiH3)2SiHSiH2− are 1.60, 1.97, and 3.32 at 298 K, 400 K, and 600 K, respectively, and they are used in falloff calculations of RC step 3. The corresponding FE values computed by the Whitten–Rabinovitch approximation at 298 K, 400 K, and 600 K are 1.45, 1.71, and 2.51, which agree with the values we used within 9, 13, and 24%, respectively.
4. Results and discussion
4.1. Benchmark of various density functionals
Although coupled cluster theory with single and double excitations and quasi-perturbative connected triple excitations, i.e., CCSD(T), is often viewed as the gold standard in quantum chemistry, it uses a single configuration state function as the reference wave function (i.e., it is a “single-reference” method), and therefore it might not be appropriate to use CCSD(T) as a benchmark for systems with strong multi-reference characters (such as bond dissociation81 and transition metal chemistry82). To ascertain its expected reliability, we computed the T1 diagnostic83 values for all the species involved in the reactions that are used for benchmark study, since this diagnostic has been proposed as a measure of the suitability of singe-reference coupled cluster theory. The molecule with the largest T1 diagnostic value is the transition state structure of reaction (R1) (Si4H10−), for which the value is 0.0252 computed by CCSD(T)/aug-cc-pVTZ; this value is much smaller than 0.045, which has been suggested84–86 as a criterion for the applicability of single-reference methods to open-shell molecules, and hence we concluded that CCSD(T) can serve as a reference for testing other methods in this work.
The mean unsigned errors (MUEs) of various density functionals computed with respect to CCSD(T)/CBS for reactions (R1)–(R5) and the overall MUEs are shown in Fig. 1. MUEs are calculated based on zero-point-vibrational-energy-exclusive forward barrier height and energy of reaction. MUEs shown in Fig. 1 are computed using the MG3S basis; using larger basis sets such as jun-cc-pVTZ and jul-cc-pVTZ has a negligible effect on the MUEs. All the computed classical forward barrier heights, energies of reaction, and MUEs are tabulated in the ESI.†
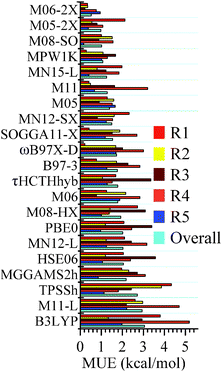 |
| | Fig. 1 Mean unsigned errors (MUEs, in kcal mol−1) for reactions (R1)–(R5) and the overall MUEs of various density functionals. MUEs shown in this figure (computed with the MG3S basis) are based on classical forward barrier and energy of reaction; CCSD(T)/CBS values are used as references. The functionals are in order of increasing overall MUE. | |
Among the 25 tested density functionals, the global-hybrid meta-GGA functional M06-2X performs the best for all the reactions; the MUEs for reactions (R1)–(R5) and the overall MUE are 0.34, 0.35, 0.22, 0.76, 0.95 and 0.52 kcal mol−1, respectively. They are all better than the value of 1 kcal mol−1, which is usually quoted as “chemical accuracy”. M06-2X, M05-2X, M08-SO, and MPW1K are the four best performing functionals and all have overall MUEs within the chemical accuracy criterion. Among the three tested local density functionals (M11-L, MN12-L and MN15-L), MN15-L possesses the smallest overall MUE, which is 1.25 kcal mol−1; it is encouraging that this surpasses the accuracy of many popular hybrid density functionals (such as B3LYP and ωB97X-D) and the recently developed MGGA_MS2h. This is encouraging for the very new MN15-L functional since there is no silyl or silylene-related species in its training set and since local functionals are usually less accurate than hybrid functionals for reaction energies and barrier heights.
Note that the density functional calculations converge more rapidly with respect to basis set than CCSD(T), and so CBS extrapolations were not needed. A great advantage of density functional theory in this respect is that the reaction path calculations and the required Hessians along the reaction path are affordable even with the reasonably well-converged MG3S basis set.
4.2. Proposed reaction mechanisms
In this work, we consider the silicon hydride clusters formed from silylene or silyl anions reactions with silane that involve no more than 5 silicon atoms. To be more specific, the composite reactions we studied are:
| (RA): SiH3SiHSiH2− + SiH4 → (SiH3)2SiHSiH− + H2 |
| (RB): (SiH3)2SiHSiH− + SiH4 → (SiH3)3SiSiH− + H2 |
| (RC): (SiH3)2SiH− + SiH4 → (SiH3)3Si− + H2 |
| (RD): (SiH3)3Si− + SiH4 → (SiH3)3SiSiH2− + H2 |
In the above reactions, the ground-state spin multiplicities for all the silylene anions (i.e., SiH3SiHSiH2−, (SiH3)2SiHSiH− and (SiH3)3SiSiH−) are doublet and for silyl anions (i.e., (SiH3)2SiH−, (SiH3)3Si− and (SiH3)3SiSiH2−) are singlet. The growth of (SiH3)3SiSiH− starts from SiH3SiHSiH2−, which is produced during the initial polymerization reaction of SiH4 + Si2H4−; (SiH3)2SiH−, which leads to the formation of (SiH3)3SiSiH2−, is generated by the reaction SiH4 + Si2H5−.
Potential energy diagrams (relative Born–Oppenheimer potential energy E in kcal mol−1 with respect to reactants) for reaction mechanisms of reactions RA–RD are shown in Fig. 2–5. The elementary steps involved and their classical energies of reaction (ΔE) are listed in Table 3. Energetic values are computed based on geometries optimized at M06-2X/MG3S and single point energies calculated with the same method. All the elementary reactions are bimolecular reactions except for the first step of RB and the third step of RC, which are unimolecular isomerization reactions (intramolecular hydrogen transfer). We considered ion–dipole complex in four of the elementary bimolecular reactions, in which the barrier is negative: RA step 2, RB step 3, RC step 1, and RD step 1; the ion–dipole complex is used in computing tunneling transmission coefficient of the bimolecular reactions.
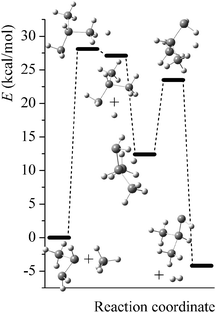 |
| | Fig. 2 Potential energy diagram for reaction mechanism of reaction RA; relative energies (E in kcal mol−1, with respect to reactants SiH3SiHSiH2− + SiH4) are computed at M06-2X/MG3S level. | |
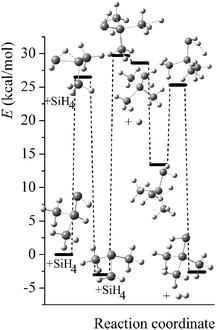 |
| | Fig. 3 Potential energy diagram for reaction mechanism of reaction RB; relative energies (E in kcal mol−1, with respect to reactants (SiH3)2SiHSiH− + SiH4) are computed at M06-2X/MG3S level. | |
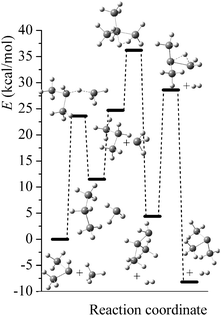 |
| | Fig. 4 Potential energy diagram for reaction mechanism of reaction RC; relative energies (E in kcal mol−1, with respect to reactants (SiH3)2SiH− + SiH4) are computed at M06-2X/MG3S level. | |
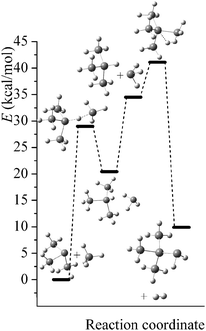 |
| | Fig. 5 Potential energy diagram for reaction mechanism of reaction RD; relative energies (E in kcal mol−1, with respect to reactants (SiH3)3Si− + SiH4) are computed at M06-2X/MG3S level. | |
Table 3 Elementary steps in the proposed reaction mechanisms for reactions RA–RD, and their classical energies of reactions (kcal mol−1) at M06-2X/MG3S level
| Reaction |
Step |
Chemical equation |
ΔE (kcal mol−1) |
| A |
1 |
SiH3SiHSiH2− + SiH4 → (SiH3)2SiHSiH2− + H |
27.1 |
| A |
2 |
(SiH3)2SiHSiH2− + H → (SiH3)2SiHSiH− + H2 |
−31.3 |
| B |
1 |
(SiH3)2SiHSiH− → (SiH3)2SiH2Si− |
−3.0 |
| B |
2 |
(SiH3)2SiH2Si− + SiH4 → (SiH3)3SiSiH2− + H |
31.6 |
| B |
3 |
(SiH3)3SiSiH2− + H → (SiH3)3SiSiH− + H2 |
−31.2 |
| C |
1 |
(SiH3)2SiH− + SiH4 → (SiH3)2SiH2 + SiH3− |
24.7 |
| C |
2 |
(SiH3)2SiH2 + SiH3− → (SiH3)2SiHSiH2− + H2 |
−20.3 |
| C |
3 |
(SiH3)2SiHSiH2− → (SiH3)2SiSiH3− |
−12.6 |
| D |
1 |
(SiH3)3Si− + SiH4 → (SiH3)3SiH + SiH3− |
34.5 |
| D |
2 |
(SiH3)3SiH + SiH3− → (SiH3)3SiSiH2− + H2 |
−24.6 |
4.3. Multi-structural and torsional potential anharmonicity
Multi-structural and torsional potential anharmonicity factors of activation for the forward reactions are tabulated in Table 4, and for the reverse reactions are in ESI.† MS-T standard-state reaction enthalpy ( in kcal mol−1) and reaction Gibbs free energy (
 in kcal mol−1) for all the reactions at 298 K and 1000 K are shown in Table 6, and their values at various temperatures are tabulated in ESI.† The numbers of distinguishable conformers found in the conformational searches for the species that have multiple structures are given in ESI.†
Table 4 MS-T factors for activation at various temperatures for forward reactions computed at M06-2X/MG3S level
|
T/K |
RA |
RB |
RC |
RD |
| Step 1 |
Step 2 |
Step 1 |
Step 2 |
Step 3 |
Step 1 |
Step 2 |
Step 3 |
Step 1 |
Step 2 |
| 298 |
1.41 |
0.57 |
0.93 |
1.91 |
1.68 |
0.52 |
1.64 |
0.75 |
0.70 |
0.52 |
| 300 |
1.41 |
0.57 |
0.93 |
1.90 |
1.68 |
0.52 |
1.64 |
0.75 |
0.70 |
0.52 |
| 400 |
1.50 |
0.61 |
0.92 |
1.70 |
1.69 |
0.47 |
1.65 |
0.82 |
0.66 |
0.57 |
| 500 |
1.55 |
0.66 |
0.96 |
1.52 |
1.72 |
0.42 |
1.68 |
0.91 |
0.62 |
0.61 |
| 600 |
1.56 |
0.70 |
1.02 |
1.36 |
1.74 |
0.38 |
1.72 |
1.02 |
0.58 |
0.66 |
| 700 |
1.55 |
0.75 |
1.09 |
1.24 |
1.77 |
0.35 |
1.76 |
1.13 |
0.55 |
0.70 |
| 800 |
1.53 |
0.80 |
1.17 |
1.13 |
1.80 |
0.32 |
1.82 |
1.25 |
0.52 |
0.74 |
| 900 |
1.50 |
0.85 |
1.25 |
1.05 |
1.82 |
0.29 |
1.87 |
1.37 |
0.49 |
0.78 |
| 1000 |
1.47 |
0.90 |
1.33 |
0.98 |
1.84 |
0.27 |
1.92 |
1.48 |
0.46 |
0.82 |
| 1500 |
1.31 |
1.13 |
1.71 |
0.74 |
1.95 |
0.20 |
2.17 |
2.03 |
0.36 |
1.00 |
The errors for computing the thermal rate constants introduced by ignoring the multi-structural and torsional anharmonicity effects vary between different reactions and temperatures. For reactions RA step 1, RB step 3 and RC step 2, the errors are only slightly temperature dependent; the averaged errors (over 298–1500 K temperature range) for thermal rate constants computed without including MS-T effects for these reactions are respectively 32%, 43%, and 44%, with a standard deviation of 4%, 3%, and 5% between various temperatures. For reaction RB step 1, the MS-T effect can be ignored for temperatures below 800 K, at which temperatures the errors are all smaller than 15%; at 1500 K, one would have an error of 42% in thermal rate constant if the MS-T factor were not included. For reaction RC step 1 at 1500 K, the multi-structural CVT/SCT rate constant is a factor of 5 smaller than the single-structural CVT/SCT rate constant; the ratio of the single-structural harmonic oscillator rovibrational partition function (SS-HO) to the MS-T rovibrational partition function is 0.138 for the TS and is 0.696 for the reactant (SiH3)2SiH−, while the ratio of MS-HO partition function to SS-HO partition function is 2 for the TS and is 1 for (SiH3)2SiH−, which indicates stronger couplings between torsional modes in the TS than in (SiH3)2SiH−.
4.4. High-pressure-limit thermal rate constants
Calculated MS-CVT/SCT rate constants for all the forward reactions are listed in Table 5, and for reverse reactions in the ESI.† The following equations are used to fit the thermal rate constants:70,87| |  | (21) |
where A, n, E and T0 are fitting parameters, T is temperature in Kelvin, and R is the ideal gas constant (1.9872 × 10⁻³ kcal mol−1 K−1). Fitting parameters for forward reactions are shown in Table 6, and those for the reverse reactions are in the ESI.†
Table 5 MS-CVT/SCT rate constants for forward reactions computed at M06-2X/MG3S level at various temperatures. For bimolecular reactions, units of rate constants are cm3 molecule−1 s−1; for unimolecular reactions, units are s−1
|
T/K |
RA |
RB |
RC |
RD |
| Step 1 |
Step 2 |
Step 1 |
Step 2 |
Step 3 |
Step 1 |
Step 2 |
Step 3 |
Step 1 |
Step 2 |
| 298 |
9.08 × 10⁻³² |
3.71 × 10⁻¹⁰ |
1.35 × 10⁻⁷ |
2.23 × 10⁻³⁴ |
3.30 × 10⁻¹⁰ |
6.55 × 10⁻²⁸ |
3.09 × 10⁻²¹ |
3.57 × 10⁻⁶ |
7.30 × 10−41 |
2.01 × 10⁻¹⁸ |
| 300 |
1.22 × 10⁻³¹ |
3.55 × 10⁻¹⁰ |
1.78 × 10⁻⁷ |
3.14 × 10⁻³⁴ |
3.19 × 10⁻¹⁰ |
8.27 × 10⁻²⁸ |
3.35 × 10⁻²¹ |
4.64 × 10⁻⁶ |
9.97 × 10−41 |
2.09 × 10⁻¹⁸ |
| 400 |
8.25 × 10⁻²⁷ |
8.27 × 10⁻¹¹ |
6.33 × 10⁻³ |
1.26 × 10⁻²⁸ |
8.49 × 10⁻¹¹ |
6.27 × 10⁻²⁴ |
1.14 × 10⁻¹⁹ |
9.35 × 10⁻² |
1.58 × 10⁻³⁵ |
1.20 × 10⁻¹⁷ |
| 500 |
8.20 × 10⁻²⁴ |
4.09 × 10⁻¹¹ |
3.82 × 10+0 |
3.32 × 10⁻²⁵ |
4.51 × 10⁻¹¹ |
1.59 × 10⁻²¹ |
1.45 × 10⁻¹⁸ |
3.89 × 10+1 |
2.64 × 10⁻³² |
5.00 × 10⁻¹⁷ |
| 600 |
9.32 × 10⁻²² |
2.76 × 10⁻¹¹ |
2.86 × 10+2 |
7.15 × 10⁻²³ |
3.12 × 10⁻¹¹ |
6.90 × 10⁻²⁰ |
9.62 × 10⁻¹⁸ |
2.19 × 10+3 |
4.28 × 10⁻³⁰ |
1.57 × 10⁻¹⁶ |
| 700 |
2.97 × 10⁻²⁰ |
2.18 × 10⁻¹¹ |
6.47 × 10+3 |
3.60 × 10⁻²¹ |
2.48 × 10⁻¹¹ |
1.08 × 10⁻¹⁸ |
4.20 × 10⁻¹⁷ |
4.15 × 10+4 |
1.79 × 10⁻²⁸ |
4.03 × 10⁻¹⁶ |
| 800 |
4.26 × 10⁻¹⁹ |
1.89 × 10⁻¹¹ |
6.88 × 10+4 |
7.17 × 10⁻²⁰ |
2.15 × 10⁻¹¹ |
8.80 × 10⁻¹⁸ |
1.39 × 10⁻¹⁶ |
3.85 × 10+5 |
3.18 × 10⁻²⁷ |
8.91 × 10⁻¹⁶ |
| 900 |
3.52 × 10⁻¹⁸ |
1.74 × 10⁻¹¹ |
4.39 × 10+5 |
7.66 × 10⁻¹⁹ |
1.97 × 10⁻¹¹ |
4.61 × 10⁻¹⁷ |
3.73 × 10⁻¹⁶ |
2.21 × 10+6 |
3.13 × 10⁻²⁶ |
1.76 × 10⁻¹⁵ |
| 1000 |
1.98 × 10⁻¹⁷ |
1.66 × 10⁻¹¹ |
1.96 × 10+6 |
5.25 × 10⁻¹⁸ |
1.84 × 10⁻¹¹ |
1.78 × 10⁻¹⁶ |
8.69 × 10⁻¹⁶ |
9.04 × 10+6 |
2.04 × 10⁻²⁵ |
3.20 × 10⁻¹⁵ |
| 1500 |
4.54 × 10⁻¹⁵ |
1.71 × 10⁻¹¹ |
1.88 × 10+8 |
2.15 × 10⁻¹⁵ |
1.74 × 10⁻¹¹ |
1.16 × 10⁻¹⁴ |
1.60 × 10⁻¹⁴ |
7.18 × 10+8 |
7.78 × 10⁻²³ |
2.83 × 10⁻¹⁴ |
Table 6 Fitting parameters for MS-CVT/SCT rate constants for forward reactions computed by M06-2X/MG3S and MS-T reaction enthalpy and reaction Gibbs free energy at 298 K and 1000 Ka
| Step |
RA |
RB |
RC |
RD |
| Step 1 |
Step 2 |
Step 1 |
Step 2 |
Step 3 |
Step 1 |
Step 2 |
Step 3 |
Step 1 |
Step 2 |
|
The standard-state pressure is one bar. For bimolecular (bimol) reactions, the units of parameter A are cm3 molecule−1 s−1; for unimolecular (unimol) reactions, the unit is s−1. The parameters T0 and E are in units of K and kcal mol−1 respectively, and n is unitless; enthalpy and free energy are in units of kcal mol−1. Reactions that are endothermic (endo) at 0 K are fit using eqn (21), and those that are exothermic (exo) at 0 K are fit using eqn (21).
|

|
Endo |
Exo |
Exo |
Endo |
Exo |
Endo |
Exo |
Exo |
Endo |
Exo |
| Molecularity |
Bimol |
Bimol |
Unimol |
Bimol |
Bimol |
Bimol |
Bimol |
Unimol |
Bimol |
Bimol |
ln![[thin space (1/6-em)]](https://www.rsc.org/images/entities/char_2009.gif) A A |
−33.986 |
−29.040 |
21.176 |
−33.713 |
−28.1662 |
−31.596 |
−38.010 |
24.442 |
−52.742 |
−38.301 |
|
n
|
4.7020 |
1.8197 |
2.7059 |
4.7496 |
1.3979 |
3.0955 |
4.8766 |
1.9478 |
5.4789 |
4.6543 |
|
T
0
|
110.23 |
50.00 |
107.81 |
99.92 |
42.27 |
114.19 |
186.33 |
10.00 |
104.93 |
255.65 |
|
E
|
18.406 |
−3.673 |
18.594 |
21.577 |
−3.2529 |
15.207 |
5.856 |
21.252 |
19.512 |
2.932 |

|
24.4 |
−29.4 |
−2.9 |
28.5 |
−29.7 |
24.0 |
−21.2 |
−11.9 |
33.4 |
−25.2 |

|
26.9 |
−30.3 |
−2.4 |
33.3 |
−33.2 |
24.3 |
−19.3 |
−12.2 |
33.7 |
−20.9 |

|
25.7 |
−30.5 |
−2.1 |
29.6 |
−30.6 |
23.5 |
−21.0 |
−10.9 |
32.2 |
−24.8 |

|
27.0 |
−32.7 |
−0.5 |
29.4 |
−31.5 |
21.9 |
−22.6 |
−8.2 |
29.1 |
−26.6 |
Fig. 6 shows the computed small-curvature tunneling (SCT) transmission coefficients at various temperatures for the third step in reaction RC. At low temperature, the thermal rate constant can be increased by an order of magnitude due to quantum tunneling. The SCT tunneling transmission coefficient decays rapidly as temperature increases; κSCT decreases from 11.1 at 298 K to 2.0 at 500 K, and to 1.1 at 1500 K.
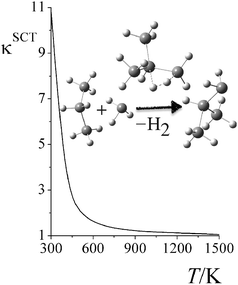 |
| | Fig. 6 Small-curvature tunneling (SCT) transmission coefficient of reaction RC step 2 at various temperatures. | |
4.5. High-pressure-limit activation energy
The Arrhenius activation energies are defined by| |  | (22) |
and are obtained by putting eqn (21) into eqn (22), which yields| |  | (23) |
Computed activation energies for both forward and reverse reactions are shown in ESI.† The temperature dependence of activation energies of forward reactions is depicted in Fig. 7.
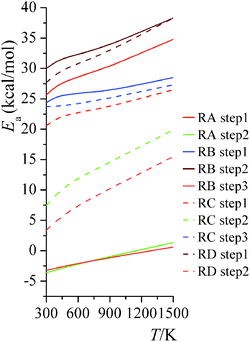 |
| | Fig. 7 High-pressure-limit activation energies for forward reactions at various temperatures. | |
The temperature dependence of activation energy computed based on MS-CVT/SCT rate constants could be quite different from the one computed from conventional transition state theory (TST), because of the effects of tunneling, recrossing, and multi-structural torsional anharmonicity. For instance, in step 2 of reaction RC, the MS-CVT/SCT activation energy is 7.4 kcal mol−1 at 298 K, and it increases by 12.5 kcal mol−1 from 298 K to 1500 K; the conventional single-structural TST (without tunneling) activation energy at 298 K is 10.9 kcal mol−1, which is 3.5 kcal mol−1 higher than MS-CVT/SCT activation energy at 298 K. We also plot the SS-TST, SS-TST/SCT, MS-CVT, and MS-CVT/SCT rate constant for RC step 2 at various temperatures in Fig. 8. The SS-TST/SCT natural logarithm rate constant curve decreases slower than the straight-line-shape of SS-TST curve as 1000 K/T increases; at high temperature, tunneling is negligible and SS-TST overlaps with SS-TST/SCT curve, while at low temperature, SS-TST curve is significantly lower than SS-TST/SCT curve. The MS-CVT/SCT curve differs negligibly from the SS-CVT/SCT curve due to the small MS-T effect.
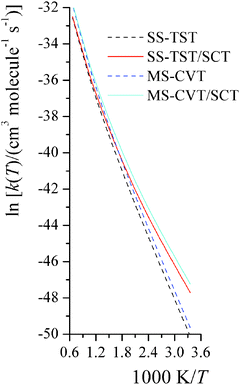 |
| | Fig. 8 The computed high-pressure-limit SS-TST, SS-TST/SCT, MS-CVT, and MS-CVT/SCT bimolecular thermal rate constants (cm3 molecule−1 s−1) for reaction RC step 2 at various temperatures (K). | |
4.6. Falloff effects for unimolecular isomerization reactions
Step 1 of reaction RB and step 3 of reaction RC are unimolecular isomerization reactions. The predicted falloff curves for these two reactions at various temperatures (in K) and pressures (in bar) are shown in Fig. 9. Falloff curves are plotted as log10[k(p)/k(p = ∞)] versus pressure, where k(p) is the thermal unimolecular rate constant at pressure p, and k(p = ∞) is the high-pressure-limit rate constant computed by MS-CVT/SCT theory. The falloff curves for pressures from 10−5 to 1 bar are shown in ESI.†
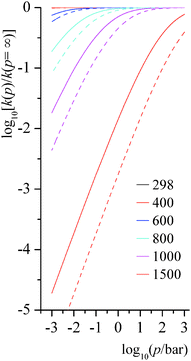 |
| | Fig. 9 Predicted falloff curves for thermal rate constants of unimolecular isomerization reactions at various temperatures (K) and pressures (bar). Solid lines are for reaction RB step 1; dashed lines are for reaction RC step 3. | |
At low and middle temperatures (T < 600 K), falloff effects for these two unimolecular reactions are negligible. At 600 K, the rate constant of RB step 1 at 1000 bar is 2.83 × 10² s−1, and at 0.01 bar it is 2.66 × 10² s−1; the rate constant of RC step 3 at 600 K and 1000 bar is 2.19 × 10³ s−1, while at the same temperature at 0.01 bar it is 1.90 × 10³ s−1. For RB step 1, the collision efficiency coefficient βc at 298 K, 600 K, and 1000 K are 0.34, 0.14 and 0.03, respectively; and for RC step 3, collision efficiency coefficients at 298 K, 600 K, and 1000 K are 0.33, 0.12 and 0.02, respectively.
At high temperature, falloff effects become more significant. At 1500 K, the rate constant of RB step 1 is 1.45 × 10⁸ s−1 at 1000 bar and is 2.66 × 10⁶ s−1 at 1.0 bar, so the 1 bar result is a factor of 0.014 smaller than the high-pressure-limit. The rate constant of RC step 3 at 1500 K is 2.82 × 10⁸ s−1 at 1000 bar and is 1.25 × 10⁶ s−1 at 1 bar, so the high-pressure-limit rate constant is 574 times larger than the one at 1.0 bar.
4.7. Pressure-dependent activation energy
The activation energies for the unimolecular isomerization reactions RB step 1 and RC step 3 depend on both temperature and pressure. We show the pressure-dependent activation energies at 600 K, 800 K, and 1000 K in Fig. 10. At the highest pressures shown (103 bar), the activation energies are at the high-pressure limit. At 600 K and around 0.1 bar, where falloff effects on the rate become notable, the activation energies also start falling as the pressures decreases. At 800 K and 1000 K, the activation energy is significantly pressure dependent; the activation energy decreases almost linearly with respect to the pressure. At the transition pressure p1/2,25 which is defined as the pressure at which the unimolecular rate constant is half of the high-pressure-limit value, the ratio of Ea(p = p1/2) to Ea(p = ∞) is 0.6 for RB step 1 (p1/2 = 0.01 bar) and 0.6 for RC step 3 (p1/2 = 0.03 bar) at 800 K, and it is 0.5 for RB step 1 (p1/2 = 0.3 bar) and 0.4 for RC step 3 (p1/2 = 1 bar) at 1000 K.
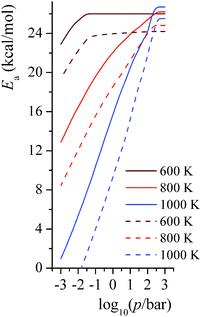 |
| | Fig. 10 Predicted pressure-dependent activation energies (kcal mol−1) for unimolecular isomerization reactions RB step 1 and RC step 3 at 600 K, 800 K, and 1000 K. Solid lines are for reaction RB step 1; dashed lines are for reaction RC step 3. | |
5. Summary
In the current work, we tested various exchange–correlation density functionals for an important system in nanodusty plasmas, in particular silylene and silyl anions reacting with silane molecules. Among the functionals we tested in this work, M06-2X is the most successful hybrid functional and MN15-L is the most successful local functional. Reaction mechanisms for the growth of silicon hydride clusters have been proposed, and the thermal rate constants of the elementary reactions involved in the reaction mechanisms were computed using multi-structural canonical variational transition state theory with the small-curvature tunneling approximation. Two unimolecular isomerization reactions are involved in the reaction mechanism, and their pressure dependent thermal rate constants were estimated based on system-specific quantum RRK (SS-QRRK) theory combined with Lindemann–Hinshelwood theory.
This work provides guidance for choosing density functionals for studying anion–neutral reactions in the silane-based reactive plasma. The methodology for computing thermal rate constants, whose values are rarely available experimentally, is also useful in estimating input kinetic data in plasma modeling for engineering applications. The extension of the SS-QRRK method to unimolecular isomerizations is also of more general use; it may be applied, for example, to atmospheric chemistry and combustion chemistry.
Acknowledgements
The authors appreciate helpful discussion with Steven L. Girshick and Mark J. Kushner and valuable contributions from Prasenjit Seal. This work is supported by the National Science Foundation under award no. CHE11-24752.
References
- U. V. Bhandarkar, M. T. Swihart, S. L. Girshick and U. R. Kortshagen, J. Phys. D: Appl. Phys., 2000, 33, 2731 CrossRef CAS.
- U. V. Bhandarkar, U. R. Kortshagen and S. L. Girshick, J. Phys. D: Appl. Phys., 2003, 36, 1399 CrossRef CAS.
- S. J. Warthesen and S. L. Girshick, Plasma Chem. Plasma Process., 2007, 27, 292 CrossRef CAS.
- P. Agarwal and S. L. Girshick, Plasma Sources Sci. Technol., 2012, 21, 055023 CrossRef.
- A. Gallagher, Phys. Rev. E: Stat. Phys., Plasmas, Fluids, Relat. Interdiscip. Top., 2000, 62, 2690 CrossRef CAS.
- L. Ravi and S. L. Girshick, Phys. Rev. E: Stat., Nonlinear, Soft Matter Phys., 2009, 79, 026408 CrossRef PubMed.
- S. Nunomura, I. Yoshida and M. Kondo, Appl. Phys. Lett., 2009, 94, 071502 CrossRef.
- P. Agarwal and S. L. Girshick, Plasma Chem. Plasma Process., 2014, 34, 489 CrossRef CAS.
- R. V. de Vijver, N. M. Vandewiele, P. L. Bhoorasingh, B. L. Slakman, F. S. Khanshan, H.-H. Carstensen, M.-F. Reyniers, G. B. Marin, R. H. West and K. M. Van Geem, Int. J. Chem. Kinet., 2015, 47, 199 CrossRef.
- J. L. Bao, P. Seal and D. G. Truhlar, Phys. Chem. Chem. Phys., 2015, 17, 15928 RSC.
- J. L. Bao, J. Zheng and D. G. Truhlar, J. Am. Chem. Soc., 2016, 138, 2690 CrossRef CAS PubMed.
- T. Yu, J. Zheng and D. G. Truhlar, Chem. Sci., 2011, 2, 2199 RSC.
- B. C. Garrett and D. G. Truhlar, J. Chem. Phys., 1979, 70, 1593 CrossRef CAS.
- B. C. Garrett and D. G. Truhlar, Acc. Chem. Res., 1980, 13, 440 CrossRef.
-
D. G. Truhlar, A. D. Isaacson and B. C. Garrett, in Theory of Chemical Reaction Dynamics, ed. M. Baer, CRC Press, Boca Raton, 1985, pp. 65–137 Search PubMed.
- J. L. Bao, R. Meana-Pañeda and D. G. Truhlar, Chem. Sci., 2015, 6, 5866 RSC.
- J. L. Bao, P. Sripa and D. G. Truhlar, Phys. Chem. Chem. Phys., 2016, 18, 1032 RSC.
- J. Zheng and D. G. Truhlar, J. Chem. Theory Comput., 2013, 9, 1356 CrossRef CAS PubMed.
- A. Fernández-Ramos, B. A. Ellingson, R. Meana-Pañeda, J. MC Marques and D. G. Truhlar, Theor. Chem. Acc., 2007, 118, 813 CrossRef.
- N. M. Vandewiele, R. V. de Vijver, K. M. Van Geem, M.-F. Reyniers and G. B. Marin, J. Comput. Chem., 2015, 36, 181 CrossRef CAS PubMed.
-
(a) H.-H. Carstensen and A. M. Dean, Compr. Chem. Kinet., 2007, 42, 101 Search PubMed;
(b) J. W. Bozzelli, A. Y. Chang and A. M. Dean, Int. J. Chem. Kinet., 1997, 29, 161 CrossRef CAS;
(c) A. Y. Chang, J. W. Bozzelli and A. M. Dean, Z. Phys. Chem., 2000, 214, 1533 CrossRef CAS.
- J. Troe, J. Chem. Phys., 1977, 66, 4745 CrossRef CAS.
- J. Troe, J. Chem. Phys., 1977, 66, 4758 CrossRef CAS.
-
K. J. Laidler, Chemical Kinetics, McGraw-Hill, New York, 2nd edn, 1965, p. 145 Search PubMed.
-
K. A. Holbrook, M. J. Pilling and S. H. Robertson, Unimolecular Reactions, John Wiley & Sons, New York, 2nd edn, 1996, ch. 2 Search PubMed.
-
T. Baer and W. L. Hase, Unimolecular Reaction Dynamics, Oxford
University Press, New York, 1996, p. 5 Search PubMed.
- A. M. Dean, J. Phys. Chem., 1985, 89, 4600 CrossRef CAS.
- Y. Zhao and D. G. Truhlar, J. Chem. Theory Comput., 2008, 4, 1849 CrossRef CAS PubMed.
- B. J. Lynch, Y. Zhao and D. G. Truhlar, J. Phys. Chem. A, 2003, 107, 1384 CrossRef CAS.
- R. Krishnan, J. S. Binkley, R. Seeger and J. Pople, J. Chem. Phys., 1980, 72, 650 CrossRef CAS.
- T. Clark, J. Chandrasekhar, G. W. Spitznagel and P. Schleyer, J. Comput. Chem., 1983, 4, 294 CrossRef CAS.
- M. J. Frisch, J. A. Pople and J. S. Binkley, J. Chem. Phys., 1984, 80, 3265 CrossRef CAS.
- V. I. Lebedev and L. Skorokhodov, Russ. Acad. Sci. Dokl. Math., 1992, 45, 587 Search PubMed.
-
M. J. Frisch, G. W. Trucks, H. B. Schlegel, G. E. Scuseria, M. A. Robb, J. R. Cheeseman, G. Scalmani, V. Barone, B. Mennucci, G. A. Petersson, H. Nakatsuji, M. Caricato, X. Li, H. P. Hratchian, A. F. Izmaylov, J. Bloino, G. Zheng, J. L. Sonnenberg, M. Hada, M. Ehara, K. Toyota, R. Fukuda, J. Hasegawa, M. Ishida, T. Nakajima, Y. Honda, O. Kitao, H. Nakai, T. Vreven, J. A. Montgomery, Jr., J. E. Peralta, F. Ogliaro, M. Bearpark, J. J. Heyd, E. Brothers, K. N. Kudin, V. N. Staroverov, R. Kobayashi, J. Normand, K. Raghavachari, A. Rendell, J. C. Burant, S. S. Iyengar, J. Tomasi, M. Cossi, N. Rega, J. M. Millam, M. Klene, J. E. Knox, J. B. Cross, V. Bakken, C. Adamo, J. Jaramillo, R. Gomperts, R. E. Stratmann, O. Yazyev, A. J. Austin, R. Cammi, C. Pomelli, J. Ochterski, R. L. Martin, K. Morokuma, V. G. Zakrzewski, G. A. Voth, P. Salvador, J. J. Dannenberg, S. Dapprich, A. D. Daniels, O. Farkas, J. B. Foresman, J. V. Ortiz, J. Cioslowski and D. J. Fox, Gaussian 09 (Revision D. 01), Gaussian, Inc., Wallingford, CT, 2009 Search PubMed.
-
Y. Zhao, R. Peverati, K. Yang, H. Xiao, H. Yu and D. G. Truhlar, MN-GFM version 6.5 computer program module, University of Minnesota, Minneapolis, 2015 Search PubMed.
- E. Papajak and D. G. Truhlar, J. Chem. Phys., 2012, 137, 064110 CrossRef PubMed.
- E. Papajak and D. G. Truhlar, J. Chem. Theory Comput., 2010, 6, 597 CrossRef CAS PubMed.
- R. Peverati and D. G. Truhlar, J. Phys. Chem. Lett., 2012, 3, 117 CrossRef CAS.
- R. Peverati and D. G. Truhlar, Phys. Chem. Chem. Phys., 2012, 14, 13171 RSC.
- H. S. Yu, H. Xiao and D. G. Truhlar, J. Chem. Theory Comput., 2016, 12, 1280 CrossRef CAS PubMed.
- P. J. Stephens, F. J. Devlin, C. F. Chabalowski and M. J. Frisch, J. Phys. Chem., 1994, 98, 11623 CrossRef CAS.
- C. Adamo and V. Barone, J. Chem. Phys., 1999, 110, 6158 CrossRef CAS.
- V. N. Staroverov, G. E. Scuseria, J. Tao and J. P. Perdew, J. Chem. Phys., 2003, 119, 12129 CrossRef CAS.
- J. Sun, R. Haunschild, B. Xiao, I. W. Bulik, G. E. Scuseria and J. P. Perdew, J. Chem. Phys., 2013, 138, 044113 CrossRef PubMed.
- B. J. Lynch, P. L. Fast, M. Harris and D. G. Truhlar, J. Phys. Chem. A, 2000, 104, 4811 CrossRef CAS.
- Y. Zhao, N. E. Schultz and D. G. Truhlar, J. Chem. Phys., 2005, 123, 161103 CrossRef PubMed.
- Y. Zhao and D. G. Truhlar, Theor. Chem. Acc., 2008, 120, 215 CrossRef CAS.
- Y. Zhao, N. E. Schultz and D. G. Truhlar, J. Chem. Theory Comput., 2006, 2, 364 CrossRef PubMed.
- R. Peverati and D. G. Truhlar, J. Phys. Chem. Lett., 2011, 2, 2810 CrossRef CAS.
- R. Peverati and D. G. Truhlar, Phys. Chem. Chem. Phys., 2012, 14, 16187 RSC.
- R. Peverati and D. G. Truhlar, J. Chem. Phys., 2011, 135, 191102 CrossRef PubMed.
- T. W. Keal and D. J. Tozer, J. Chem. Phys., 2005, 123, 121103 CrossRef PubMed.
- A. V. Krukau, O. A. Vydrov, A. F. Izmaylov and G. E. Scuseria, J. Chem. Phys., 2006, 125, 224106 CrossRef PubMed.
- A. D. Boese and N. C. Handy, J. Chem. Phys., 2002, 116, 9559 CrossRef CAS.
- J. D. Chai and M. Head-Gordon, Phys. Chem. Chem. Phys., 2008, 10, 6615 RSC.
- J. A. Pople, M. Head-Gordon and K. Raghavachari, J. Chem. Phys., 1987, 87, 5968 CrossRef CAS.
- Y. Zhao and D. G. Truhlar, J. Phys. Chem. A, 2005, 109, 6624 CrossRef CAS PubMed.
- T. H. Dunning, J. Chem. Phys., 1989, 90, 1007 CrossRef CAS.
- M. Head-Gordon, J. A. Pople and M. J. Frisch, Chem. Phys. Lett., 1988, 153, 503 CrossRef CAS.
- D. G. Truhlar, Chem. Phys. Lett., 1998, 294, 45 CrossRef CAS.
- A. Karton and J. M. L. Martin, Theor. Chem. Acc., 2006, 115, 330 CrossRef CAS.
- A. Halkier, T. Helgaker, P. Jørgensen, W. Klopper, H. Koch, O. Jeppe and A. K. Wilson, Chem. Phys. Lett., 1998, 286, 243 CrossRef CAS.
- Y. Zhao, H. T. Ng, R. Peverati and D. G. Truhlar, J. Chem. Theory Comput., 2012, 8, 2824 CrossRef CAS PubMed.
- J. L. Bao, H. S. Yu, K. Duanmu, M. A. Makeev, X. Xu and D. G. Truhlar, ACS Catal., 2015, 5, 2070 CrossRef CAS.
- K. A. Nguyen, C. F. Jackels and D. G. Truhlar, J. Chem. Phys., 1996, 104, 6491 CrossRef CAS.
- C. F. Jackels, Z. Gu and D. G. Truhlar, J. Chem. Phys., 1995, 102, 3188 CrossRef CAS.
- T. Joseph, R. Steckler and D. G. Truhlar, J. Chem. Phys., 1987, 87, 7036 CrossRef CAS.
- J. Villà and D. G. Truhlar, Theor. Chem. Acc., 1997, 97, 317 CrossRef.
- I. M. Alecu, J. Zheng, Y. Zhao and D. G. Truhlar, J. Chem. Theory Comput., 2010, 6, 2872 CrossRef CAS PubMed.
- J. Zheng and D. G. Truhlar, Faraday Discuss., 2012, 157, 59 RSC.
- J. Zheng and D. G. Truhlar, J. Chem. Theory Comput., 2013, 9, 2875 CrossRef CAS PubMed.
-
J. Zheng, S. L. Mielke, K. L. Clarkson and D. G. Truhlar, MSTor computer program, version 2011, University of Minnesota, Minneapolis, MN, 2011 Search PubMed.
-
J. Zheng, S. Zhang, B. J. Lynch, J. C. Corchado, Y.-Y. Chuang, P. L. Fast, W.-P. Hu, Y.-P. Liu, G. C. Lynch, K. A. Nguyen, C. F. Jackels, A. F. Ramos, B. A. Ellingson, V. S. Melissas, J. Vill_a, I. Rossi, E. L. Coitino, J. Pu, T. V. Albu, R. Steckler, B. C. Garrett, A. D. Isaacson and D. G. Truhlar, POLYRATE, version 2010-A, University of Minnesota, Minneapolis, 2010 Search PubMed.
-
J. Zheng, S. Zhang, J. C. Corchado, Y. Y. Chuang, E. L. Coitino, B. A. Ellingson and D. G. Truhlar, GAUSSRATE, version 2009-A, University of Minnesota, Minneapolis, 2010 Search PubMed.
- Y. Shi, Acc. Chem. Res., 2015, 48, 163 CrossRef CAS PubMed.
- A. Rahman, Phys. Rev., 1964, 136, A405 CrossRef.
- M. J. Kushner, J. Appl. Phys., 1988, 63, 2532 CrossRef CAS.
- A. Dollet, S. de Persisb and F. Teyssandier, Phys. Chem. Chem. Phys., 2004, 6, 1203 RSC.
-
(a) A. W. Jasper, J. A. Miller and S. J. Klippenstein, J. Phys. Chem. A, 2013, 117, 12243 CrossRef CAS PubMed;
(b) A. W. Jasper, K. M. Pelzer, J. A. Miller, E. Kamarchik, L. B. Harding and S. J. Klippenstein, Science, 2014, 346, 1212 CrossRef CAS PubMed.
- J. Troe, J. Phys. Chem., 1979, 83, 114 CrossRef CAS.
- K. R. Yang, A. Jalan, W. H. Green and D. G. Truhlar, J. Chem. Theory Comput., 2013, 9, 418 CrossRef CAS PubMed.
- X. Xu, W. Zhang, M. Tang and D. G. Truhlar, J. Chem. Theory Comput., 2015, 11, 2036 CrossRef CAS PubMed.
- T. J. Lee and P. R. Taylor, Int. J. Quantum Chem., Symp., 1989, 23, 199 CAS.
- J. C. Rienstra-Kiracofe, W. D. Allen and H. F. Schaefer, J. Phys. Chem. A, 2000, 104, 9823 CrossRef CAS.
- M. Martinez-Avila and J. Peiro-Garcia, J. Phys. Chem. Solids, Lett. Sect., 2003, 370, 313 CrossRef CAS.
- N. Lambert, N. Kaltsoyannis, S. D. Price, J. Zabka and Z. Herman, J. Phys. Chem. A, 2006, 110, 2898 CrossRef CAS PubMed.
- J. Zheng and D. G. Truhlar, Phys. Chem. Chem. Phys., 2010, 12, 7782 RSC.
Footnote |
| † Electronic supplementary information (ESI) available: Classical forward barriers and energy of reactions; mean unsigned errors (MUEs) computed by various model chemistries; reaction symmetry numbers; MS-T factors of activation for reverse reactions; MS-CVT/SCT rate constants for reverse reactions; fitting parameters for MS-CVT/SCT rate constants of reverse reactions; activation energies. See DOI: 10.1039/c6cp00816j |
|
| This journal is © the Owner Societies 2016 |
Click here to see how this site uses Cookies. View our privacy policy here.  Open Access Article
 and
Donald G.
Truhlar
*


![[small omega, Greek, macron]](https://www.rsc.org/images/entities/i_char_e0da.gif) in wave numbers (e.g., cm−1). Then the integrals over E are replaced by sums over n, where n is the number of quanta excited at energy E (n = E/hc
in wave numbers (e.g., cm−1). Then the integrals over E are replaced by sums over n, where n is the number of quanta excited at energy E (n = E/hc![[small omega, Greek, macron]](https://www.rsc.org/images/entities/i_char_e0da.gif) , where the zero of energy is the potential energy of the equilibrium structure of A). With this model and with [M] given by the ideal gas law, eqn (4) can be written as:
, where the zero of energy is the potential energy of the equilibrium structure of A). With this model and with [M] given by the ideal gas law, eqn (4) can be written as:

![[small omega, Greek, macron]](https://www.rsc.org/images/entities/i_char_e0da.gif)
![[small omega, Greek, macron]](https://www.rsc.org/images/entities/i_char_e0da.gif) taken as the geometric mean of the s vibrational frequencies of A (where s is 3N − 6, and N is the number of atoms in A), and with E0 and the microcanonical isomerization rate constant k2(E) parameterized by using QRRK theory calibrated to match the MS-CVT/SCT canonical rate constant at high pressure. In QRRK theory, the microcanonical rate constant is a frequency factor A (with units of reciprocal time) times the probability that a molecule with n quanta of vibrational theory has at least m quanta in one of the modes (the reactive mode), where m is given in terms of the threshold energy by eqn (8). This yields24
taken as the geometric mean of the s vibrational frequencies of A (where s is 3N − 6, and N is the number of atoms in A), and with E0 and the microcanonical isomerization rate constant k2(E) parameterized by using QRRK theory calibrated to match the MS-CVT/SCT canonical rate constant at high pressure. In QRRK theory, the microcanonical rate constant is a frequency factor A (with units of reciprocal time) times the probability that a molecule with n quanta of vibrational theory has at least m quanta in one of the modes (the reactive mode), where m is given in terms of the threshold energy by eqn (8). This yields24
![[thin space (1/6-em)]](https://www.rsc.org/images/entities/char_2009.gif) exp(−mhc
exp(−mhc![[small omega, Greek, macron]](https://www.rsc.org/images/entities/i_char_e0da.gif) /RT)
/RT)

![[thin space (1/6-em)]](https://www.rsc.org/images/entities/char_2009.gif) exp[EMS-CVT/SCTa(T)/RT]
exp[EMS-CVT/SCTa(T)/RT]


 in kcal mol−1) and reaction Gibbs free energy (
 in kcal mol−1) for all the reactions at 298 K and 1000 K are shown in Table 6, and their values at various temperatures are tabulated in ESI.† The numbers of distinguishable conformers found in the conformational searches for the species that have multiple structures are given in ESI.†


![[thin space (1/6-em)]](https://www.rsc.org/images/entities/char_2009.gif) A
A


