 Open Access Article
Number density distribution of solvent molecules on a substrate: a transform theory for atomic force microscopy†
Ken-ichi
Amano
*a,
Yunfeng
Liang
b,
Keisuke
Miyazawa
c,
Kazuya
Kobayashi
ab,
Kota
Hashimoto
a,
Kazuhiro
Fukami
d,
Naoya
Nishi
a,
Tetsuo
Sakka
a,
Hiroshi
Onishi
e and
Takeshi
Fukuma
c
aDepartment of Energy and Hydrocarbon Chemistry, Graduate School of Engineering, Kyoto University, Kyoto 615-8510, Japan. E-mail: amano.kenichi.8s@kyoto-u.ac.jp
bEnvironment and Resource System Engineering, Kyoto University, Kyoto 615-8540, Japan
cDivision of Electrical Engineering and Computer Science, Kanazawa University, Kakuma-machi, Kanazawa 920-1192, Japan
dDepartment of Materials Science and Engineering, Graduate School of Engineering, Kyoto University, Kyoto 606-8501, Japan
eDepartment of Chemistry, School of Science, Kobe University, Nada, Kobe, Hyogo 657-8501, Japan
First published on 29th March 2016
Abstract
Atomic force microscopy (AFM) in liquids can measure a force curve between a probe and a buried substrate. The shape of the measured force curve is related to hydration structure on the substrate. However, until now, there has been no practical theory that can transform the force curve into the hydration structure, because treatment of the liquid confined between the probe and the substrate is a difficult problem. Here, we propose a robust and practical transform theory, which can generate the number density distribution of solvent molecules on a substrate from the force curve. As an example, we analyzed a force curve measured by using our high-resolution AFM with a newly fabricated ultrashort cantilever. It is demonstrated that the hydration structure on muscovite mica (001) surface can be reproduced from the force curve by using the transform theory. The transform theory will enhance AFM's ability and support structural analyses of solid/liquid interfaces. By using the transform theory, the effective diameter of a real probe apex is also obtained. This result will be important for designing a model probe of molecular scale simulations.
Introduction
Number density distribution of small spheres (solvent molecules or colloidal particles) on a substrate is important for understanding the liquid/solid interface. The number density distribution contains information about layering intervals of the small spheres, nano-scale wettability (affinity between the small spheres and the substrate), and thermodynamic properties (e.g., partial molar volume, solvation energy). In addition, to microscopically elucidate the mechanisms of catalytic and electrochemical reactions, crystal growth, and biomolecular functions, the understanding of these interfaces is imperative. There are several experimental methods for analyses of the interface, such as X-ray1–4 and neutron4,5 beam technologies, the surface force apparatus (SFA) technique,6,7 and atomic force microscopy (AFM).8–18 The X-ray and neutron beam technologies can measure the number density distribution of the small spheres on a solid substrate. One-dimensional number density distributions have been obtained by using X-ray and neutron reflectivity. Moreover, by using X-ray scattering, three-dimensional (3D) hydration structure on the calcite (104) surface has also been obtained.2,3 SFA can measure a force curve between two wide surfaces of the substrates, and AFM can measure a force curve between a probe and a substrate. The force curves measured by SFA and AFM in a solvent or a colloidal solution generally show an oscillatory shape, and indirectly contain information about the number density distribution of the small spheres on the substrate. Hence, the structure of the small spheres has been virtually predicted from the shape of the force curve. However, interpretation of the force curve is difficult, because the original number density distribution of the small spheres is destroyed by the presence of the probe. Furthermore, the number density distribution of the small spheres around the probe itself should be considered when the original one on the substrate is predicted. In order to obtain the number density distribution of the small spheres on the substrate from the force curve, these problems should be taken into account and theoretically the force curve should be transformed into the number density distribution. In this paper, we try to derive a transform theory and focus on the force curve measured by AFM. This theoretical–experimental study is important for both enhancement of AFM's ability and elucidation of the structure of the solid/liquid interface.For analysis of the interface, AFM is a suitable apparatus, because it can be operated on solid substrates,10,11,13,15 semi-biological membranes,8,11,12,14,16etc., and can even detect 3D force distribution in liquids. These points make AFM more advantageous compared to the X-ray and neutron beam technologies and SFA. Recent AFM can measure the force curve with high spatial and force resolutions from which the oscillatory force (i.e., solvation or colloid-induced force) is measured. By observing the force curve, as mentioned above, the structure of the number density distribution of the small spheres on the substrate is virtually predicted. However, to reveal the number density distribution, the force curve must be theoretically transformed into the number density distribution.
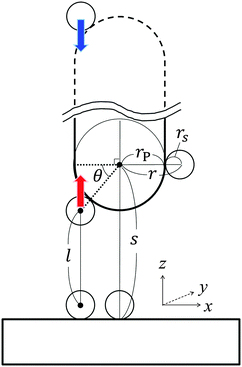
The transformation of the force curve into the number density distribution is one of the imperative challenges in AFM. Firstly, in 2010, Kimura et al.11 proposed a simplified relationship between the force curve and the number density distribution by introducing delta function approximation (DFA). In DFA, the apex of the probe is approximated by a delta function. Secondly, in 2013, Watkins19 and Amano20 independently introduced solvent tip approximation (STA), where the tip apex is approximated by a solvent molecule. DFA and STA helped one to understand the simple relationship between the force curve and the number density distribution. However, they could not reproduce the number density distribution from the real force curve. (Fortunately, they could reproduce the force curve from the number density distribution, and the reproducibility of STA is better than that of DFA.) The reasons for the problems are that the size of the model probes is unnecessarily small and cannot be upsized. Therefore, in this paper, we make it possible to treat larger model probes. In the new model, hemispherical probe approximation (HPA) is introduced, where the apex of the probe is approximated by a hemisphere with arbitrary size and the whole shape of the probe is similar to that of a capped carbon nanotube or a sphere (see Fig. 1).
In the section ‘Transform theory’, we derive a theory that transforms the force curve into the number density distribution by introducing HPA. Before putting HPA transform into practical use, it should be tested in a computationally closed cycle. In the section ‘Model’, we explain parameter settings for the validation tests, and in the section ‘Results and discussion’, the results of the validation tests are given. Then, HPA transform is put into practical use, as the first attempt on the experiment. In the section ‘Conclusions’, it is concluded that HPA transform is useful for estimation of the number density distribution. We expect that the combination of AFM and HPA transform plays an important role in measuring the number density distributions of the solvent molecules and colloidal particles on organic and inorganic crystals and a biological membrane.
Transform theory
In what follows, we derive the transform theory within the system of Fig. 1. In the system, a probe and a flat substrate are immersed in an ensemble of small spheres, where the radius of the small sphere is rS. The probe itself is modeled as a long and thin rod (or a sphere). The apex of the probe is a hemisphere whose radius is rP. The bulk number density of the ensemble of small spheres is ρ0. When the system considered here is a colloidal solution, the colloidal particles in the solution are modeled as small spheres and its background (liquid solution) is hypothesized as a continuum fluid. The space which the center of the small sphere cannot enter is the excluded volume of the probe, and r is the radius of the excluded volume of the hemisphere. As shown in Fig. 1, θ denotes the angle (radian) between the two dotted lines. The separation between the flat surface and the center of the hemisphere is represented as s. The length of the vertical line between the surfaces of excluded volumes is represented as l. In this case, the force acting on the probe (f) is expressed as21–23 | (1) |
 | (2) |
l = s − rS − r![[thin space (1/6-em)]](https://www.rsc.org/images/entities/char_2009.gif) sin sin![[thin space (1/6-em)]](https://www.rsc.org/images/entities/char_2009.gif) θ, θ, | (3) |
cos![[thin space (1/6-em)]](https://www.rsc.org/images/entities/char_2009.gif) θ θ![[thin space (1/6-em)]](https://www.rsc.org/images/entities/char_2009.gif) dθ = −(1/r)dl, dθ = −(1/r)dl, | (4) |
sin![[thin space (1/6-em)]](https://www.rsc.org/images/entities/char_2009.gif) θ = (s − rS − l)/r. θ = (s − rS − l)/r. | (5) |
 | (6) |
| F* = HP, | (7) |
The obtained P is the sum of the pressures from up and down sides, and the pressed surfaces are normal to the z-axis. Subsequently, if we approximate that (I) P fluctuates only by the change of the contact number density of the small spheres on the probe surface and (II) the contact number density can be estimated by the Kirkwood superposition approximation,27,28P is given by a simple equation:21
| P(l) = kBTρ0gCPgBS(rS + l) − kBTρ0gCP, | (8) |
 | (9) |
The advantageous points of HPA transform are that it does not require (a) radial number density distribution between the small spheres gSS, (b) number density distribution of the small spheres around the probe gPS, (c) two-body potential between the small spheres uSS, (d) two-body potential between the probe and the small sphere uPS, and (e) two-body potential between the substrate and the small sphere uBS. For calculation of gBS, the transform theory requires only f, T, ρ0, rS, rP, and gCP. The number of requirements is not so many, which is advantageous for practical use. (gPS is the number density distribution as a function of distance between the probe and the small sphere, while gCP is the value of the number density at the contact.)
If the data of uPS and gPS can be used for the transformation, we can transform f with fewer approximations by applying a theory recently proposed by Amano et al.22 Experimentally, however, it is very difficult to determine the detailed shape of uPS. Furthermore, preparation of gPS from uPS is not an easy task. Thus, the theory recently proposed by Amano et al.22 is not applied in this work. If there are uPS and gPS, the transformation can be done with fewer approximations; however, the Kirkwood superposition approximation, the most unignorable one in the approximations, is also used in this case. As a result, the improved degree is very small. Moreover, if the data of uPS and gPS have some deviations from the true values, it will give rise to lowering of the reproducibility. Therefore, in the present situation, HPA transform which does not require uPS and gPS is explained.
Model
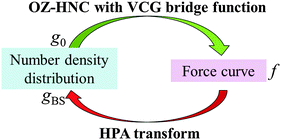
To check the validity of the transform theory, we conduct a computational validation test of the transform theory by using a sophisticated integral equation theory of statistical mechanics of liquids. For calculation of both the force curve (f) and the benchmark of the number density distribution of small spheres on a substrate (g0), we use the Ornstein–Zernike (OZ) equation coupled with the hypernetted-chain (HNC) closure,38 where a bridge function proposed by Verlet–Choudhury–Ghosh (VCG)39 is incorporated. The VCG bridge function is a powerful tool, because when a system is a rigid one, it becomes a bridge function of Verlet type,40,41 which is a highly sophisticated bridge function for the rigid system. Moreover, also in a non-rigid system, it can yield properties of a liquid with high accuracy.39,41 Therefore, the VCG bridge function is suitable for this validation test.The validation test has a closed cycle as shown in Fig. 2. The outline of the validation test is as follows. In step (A), the benchmark of the number density distribution of the small spheres on the substrate g0 is calculated by using OZ–HNC–VCG. In step (B), the number density distribution of the small spheres around the probe gPS is calculated also by using OZ–HNC–VCG. In step (C), the force curve f between the substrate and the probe is calculated also by using OZ–HNC–VCG. In step (D), we would like to transform f into g0; however, in this step, there are no data about gSS, gPS, uSS, uPS, and uBS, because in most cases, it is difficult to prepare these data experimentally and theoretically. Thus, the data we can use here are only f, T, ρ0, rS, rP, and gCP. In the limited condition, transformation from f into g0 cannot be performed by using usual simulations and integral equation theories of liquids. Then, the transform theory derived here is used, and f is transformed into the number density distribution of the small spheres on the substrate, i.e., gBS. If the gBS calculated through the transform theory is similar to the benchmark g0, it is concluded that the transform theory is a valid method for estimation of the number density distribution.
Here, the model systems for the validation test are constructed as follows. A sufficiently large cylindrical substrate and a spherical probe are immersed in an ensemble of small spheres. The cylindrical substrate is placed at the center of the calculation box. The flat surfaces of the cylindrical substrate are normal to the z-axis, i.e., the curved lateral surface of the cylindrical substrate is parallel to the z-axis. The diameter of the small sphere, i.e., dS (=2rS), is set at 0.28 nm. The diameter of the cylindrical substrate is 12dS and its height (thickness) is 2dS. The diameter of the spherical probe denoted by dP (=2rP) is 3dS or 6dS. Grid spacings of the x, y, and z-axes are 0.1dS, 0.1dS, and 0.02dS, respectively. The numbers of grid points of the x, y, and z-axes are 256, 256, and 2048, respectively. The dimensionless value of the bulk number density of the small spheres denoted by ρ0dS3 is 0.6, 0.7, or 0.8. The two-body potential between the two small spheres is expressed as20–22,37
| uSS(hSS) = ∞ for hSS < dS, | (10a) |
| uSS(hSS) = −εSS(dS/hSS)6 for hSS ≥ dS, | (10b) |
| uPS(hPS) = ∞ for hPS < dS/2, | (11a) |
| uPS(hPS) = −(εPS/16)(dS/hPS)4 for hPS ≥ dS/2, | (11b) |
| uBS(hBS) = ∞ for hBS < dS/2, | (12a) |
| uBS(hBS) = −(εBS/8)(dS/hBS)3 exp[–(hBS/10dS)10] for hBS ≥ dS/2, | (12b) |
| Model system # | ρ 0 d S | d P/dS | ε SS/kBT | ε PS/kBT | ε BS/kBT | g CP |
|---|---|---|---|---|---|---|
| 1 | 0.6 | 3 | 0 | 0 | 0 | 3.25 |
| 2 | 0.6 | 6 | 0 | 0 | 0 | 3.56 |
| 3 | 0.7 | 3 | 0 | 0 | 0 | 4.16 |
| 4 | 0.7 | 6 | 0 | 0 | 0 | 4.63 |
| 5 | 0.8 | 3 | 0 | 0 | 0 | 4.43 |
| 6 | 0.8 | 6 | 0 | 0 | 0 | 4.95 |
| Model system # | ρ 0 d S | d P/dS | ε SS/kBT | ε PS/kBT | ε BS/kBT | g CP |
|---|---|---|---|---|---|---|
| 7 | 0.7 | 3 | 1 | 0 | 1 | 3.30 |
| 8 | 0.7 | 6 | 1 | 0 | 1 | 3.51 |
| 9 | 0.7 | 3 | 1 | 1 | 1 | 4.38 |
| 10 | 0.7 | 6 | 1 | 1 | 1 | 4.65 |
| 11 | 0.7 | 3 | 1 | 2 | 1 | 5.70 |
| 12 | 0.7 | 6 | 1 | 2 | 1 | 6.04 |
| Model system # | ρ 0 d S | d P/dS | ε SS/kBT | ε PS/kBT | ε BS/kBT | g CP |
|---|---|---|---|---|---|---|
| 13 | 0.7 | 3 | 1 | 0 | 6 | 3.30 |
| 14 | 0.7 | 6 | 1 | 0 | 6 | 3.51 |
| 15 | 0.7 | 3 | 1 | 3 | 6 | 7.29 |
| 16 | 0.7 | 6 | 1 | 3 | 6 | 7.71 |
| 17 | 0.7 | 3 | 1 | 6 | 6 | 14.06 |
| 18 | 0.7 | 6 | 1 | 6 | 6 | 14.84 |
Results and discussion
Validation tests in the rigid systems
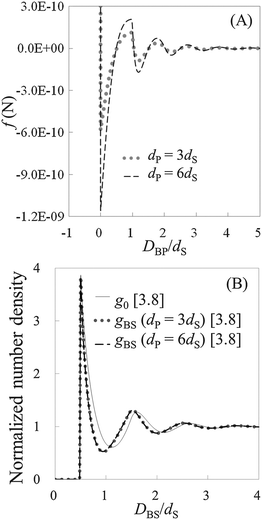
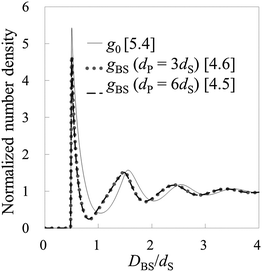
To check the validity of HPA transform, at first, we conduct validation tests in model systems 1–6 (see Table 1). In Fig. 3(A), the force curves, i.e., solvation force curves, of model systems 1 and 2 are shown. It is found that the amplitude of the force curve obtained in model system 2 is larger than that in model system 1, because the diameter of the model probe in model system 2 is two times larger than that in model system 1. Subsequently, we substituted these force curves into HPA transform, and obtained the number density distributions of the small spheres on the substrate, gBS. As shown in Fig. 3(B), it is found that the two gBSs of model systems 1 and 2, represented by the dotted and dashed lines, are very similar to each other.The solid line in Fig. 3(B) is the benchmark structure of g0 for model systems 1 and 2 (g0s for model systems 1 and 2 are exactly the same). Because the bulk number density is not relatively high (ρ0dS = 0.6) and the Kirkwood superposition approximation works well in such a condition, the difference between g0 and gBS is not so large. Fig. 3(B) evidences that HPA transform can reproduce the number density distribution from the force curve semi-quantitatively.
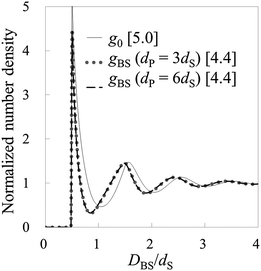
Fig. 4 and 5 show the number density distributions in the cases of ρ0dS = 0.7 and 0.8, respectively. Also in these cases, it is found that HPA transform can semi-quantitatively reproduce the number density distributions from the force curves. By the way, as shown in Fig. 3–5, the contact value of the benchmark structures g0 increases as the bulk number density increases. Similarly, the contact number density calculated by using HPA transform also increases as the bulk number density increases. This behavior reasonably accords with that of the benchmark structure.
Validation tests in the non-rigid systems
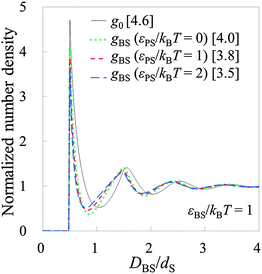
To conduct the validation tests in the non-rigid systems, we prepared model systems 7–18 as shown in Tables 2 and 3. Firstly, model systems 7–12 (Table 2) are tested, where εBS/kBT is fixed at 1 (the substrate is neither solvophobic nor solvophilic, but neutral). Fig. 6 exhibits both g0 on the substrate (solid line) and gBSs obtained in model systems 7–12. As observed in Fig. 6, the shapes of g0 and gBSs are similar to each other. (However, there are some deviations.) It can be said that HPA transform semi-quantitatively reproduced the number density distribution. By the way, there are deviations between gBSs themselves. The amplitude of gBS becomes smaller as the affinity of the probe for the small sphere, εPS/kBT, becomes larger. Generally, the amplitude of the force curve is larger when the affinity is larger, so it seems that the amplitude of gBS becomes larger as the affinity of the probe for the small sphere becomes larger. However, the results were the other way around. It is considered that this contradiction arises from the magnitude of the input gCP. When εPS/kBT is large, gCP is also large, and if such a large value of gCP is substituted into eqn (9), the amplitude of gBS becomes small. Consequently, as εPS/kBT becomes larger, the amplitude of gBS becomes smaller.In ESI,† the further verification tests are provided, where εBS/kBT is 0 and 2 (see Tables S1 and S2, ESI†). The former and latter values respectively correspond to solvophobic and solvophilic substrates. Also in these cases, HPA transform reproduced gBSs semi-quantitatively. As shown in Fig. 6, Fig. S1, and S2, ESI,† the contact value of g0 increases as εBS/kBT increases. The contact value of gBS also increases as εBS/kBT increases. This behaviour is important for analysing the contact number densities on solvophobic and solvophilic substrates. For example, when two unknown substrates X and Y are analysed with the same probe, and if one observes a higher contact number density on X, it indicates that X is solvophilic than Y. That is, if the probe used in the real experiment is consolidated, gBSs obtained on several substrates can be compared.
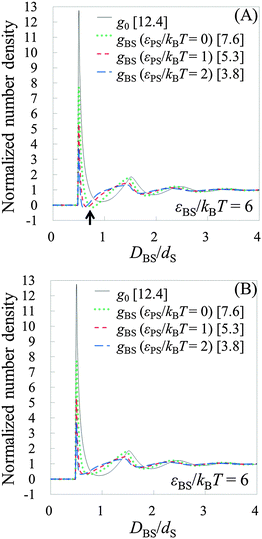
To see the tendency of HPA transform in more extreme conditions, we introduced model systems 13–18 (Table 3), where εBS/kBT is fixed at 6 (the substrate is highly solvophilic). As observed in Fig. 7(A), the amplitudes of gBSs obtained in model systems 15–18 are very small compared with g0, which originate from the large values of gCPs (see eqn (9)). Since HPA transform is derived by introducing approximation (I), it is not good at transformation in the extreme condition. However, even in the extreme condition, HPA transform qualitatively reproduced the number density distribution. Although qualitatively appropriate results were obtained in the extreme condition, the negative value of gBS is erroneously generated (see the arrow in Fig. 7(A)). This kind of problem, generation of the negative density, also exists in a beam experiment.44 For HPA transform, the negative density is derived from the introduction of the Kirkwood superposition approximation. Then, we propose a simple patch method for the negative value. In the patch method, the potential of mean force between the substrate and the small sphere, i.e., φBS, is calculated at first, and then gBS is calculated from φBS by using the exact equation given below:20
| gBS(rS + l) = exp[−φBS(rS + l)/(kBT)]. | (13) |
 | (14) |
Thus, in the patch method, gBS is obtained as follows:
 | (15a) |
 | (15b) |
Example of practical use of HPA transform
As the first step for the practical use of HPA transform, we transform a force curve (Fig. 8) measured on the mica (001) surface in water into the hydration structure gAFM (Fig. 9). The force curve is measured using a Si coated probe recently developed by Miyazawa et al.17 The force curve is obtained by averaging 3D force distribution (see Methods). Fig. 8 displays the short range force, where the long range force is eliminated from the total force. In the condition of AFM measurements, the major factor of the long range force is the electric double layer force, and the minor factor is the van der Waals force.45–48 On the other hand, the short range force mainly corresponds to the steric repulsive force, the chemical bonding force, and the hydration force.45–48 Because the steric repulsive and the chemical bonding forces arise in the very vicinity of the mica surface,45,46,48 the main content of the short range force curve after DMP/dS = 1.0 is supposed to be the hydration force. The input force curve for HPA transform, the hydration force, is obtained by fitting the plot in Fig. 8. The fitting is performed by using a power series function of DMP, where the number of terms is 70 which is sufficiently large for the fitting.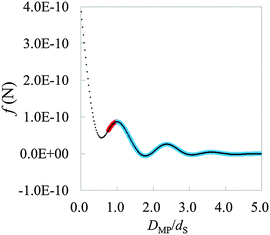 | ||
| Fig. 8 The averaged short range force curve on mica surface measured by AFM, where DMP is the relative distance between the mica surface and the probe. On mica surface, such a typical shape can be measured.13,49 The plot represents the experimental data. The thick curve (pair of red and blue curves) represents the fitted curve. The left and right sides of the first local maximum are colored red and blue, respectively. The blue thick curve is used for HPA transform. | ||
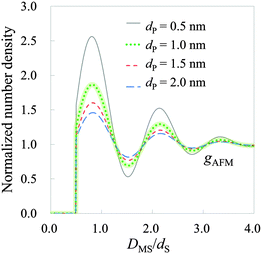 | ||
| Fig. 9 Hydration structure on mica estimated by HPA transform, where DMS is the relative distance between the mica surface and the water molecule. The solid, dotted, short-dashed, and long-dashed lines represent gAFMs calculated with the effective diameters 0.5, 1.0, 1.5, and 2.0 nm, respectively. gAFM calculated with an effective diameter of 1.0 nm is highlighted by a thick line, because it is the most similar in amplitude to those obtained by using X-ray reflectivity,1 MD simulations53,54 and MC55 simulations. | ||
For estimation of gAFM, input data gCP of the real probe is set at 1.6, which is estimated combining three data: experimental results of the surface properties of the probe49 and silica surfaces,50 and results of MD simulations of the hydration structure on silica surface.51,52 The surface of the Si coated tip is considered to be amorphous silica. According to Akrami et al.,49 the surface of the Si coated tip is composed of SiOx, and after immersion of the tip in water, the surface is mainly composed of SiO2. Zhuravlev50 determined the number of OH groups per unit surface area of the amorphous silica as 4.6–4.9 OH nm−2, and Argyris et al.51 calculated the hydration structure on the silica (111) surface of a low hydroxyl surface (4.54 OH nm−2). Although the amorphous silica surface and silica (111) surface are not the same, we supposed that their laterally averaged contact number densities of water are almost the same. Consequently, we determined the normalized contact number density of water on the tip (gCP) as 1.6, which is the same as that on the silica (111) surface.51
The effective diameter of the probe's tip apex (i.e., dP and 2rP) is assumed to be in the nanoscale range, because it has been demonstrated by MD simulations that such a model tip apex can obtain both the two dimensional atomic image of a solid surface31 and the force curve similar to the experimental result.19,31,32 Hence, as the input data for HPA transform, the effective diameter is tentatively set as 0.5, 1.0, 1.5, or 2.0 nm. In the HPA transform, the following parameters are used: T = 298 [K], ρ0 = 3.333 × 1028 [m−3], and 2rS = dS = 0.28 [nm].
As observed in Fig. 9, there are three hydration layers in gAFM. The distance between the first and the second peaks is 1.3dS, and that between the second and the third peaks is 1.2dS. These interlayer spacings are slightly longer than dS. For comparison, we have presented the hydration structures on the mica (001) surface obtained by using X-ray reflectivity,1 MD simulations,53,54 MC simulation,55 and 3D reference interaction site model (RISM)56 in Fig. 10. The interlayer spacings of them are about dS, which are slightly shorter than that of gAFM. In the curves obtained by using X-ray reflectivity, MD simulations, and MC simulations, there are peaks originating from the adsorbed water molecules on the mica surface; however, there is no such a peak in the curve obtained by using 3D-RISM. It has been explained in the paper56 that 3D-RISM also reproduced the adsorbed water molecules; however, it was smoothed out by averaging the 3D hydration structure into a 1D hydration structure.
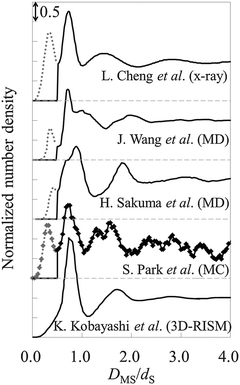 | ||
| Fig. 10 Hydration structures on mica obtained by using X-ray reflectivity,1 MD simulations,53,54 MC simulation,55 and 3D-RISM.56DMS is the relative distance between the mica surface and the water molecule. For visuality, respective hydration structures are longitudinally shifted. The solid line represents the hydration structures. The dotted line (0 ≤ DMS/dS ≤ 0.5) represents adsorbed water molecules. | ||
There is no peak of adsorbed water molecules also in gAFM (see Fig. 9). The reason for the absence is considered to be similar to the case of 3D-RISM.56 Because the force curve (Fig. 8) is obtained by averaging 3D force distribution, it seems that the force originates from the adsorbed water is smoothed out. As a result, gAFM estimated from the force curve does not contain the adsorbed water. The other possible reasons are as follows. The adsorbed water molecules exist just above the local depressions at the center of the honeycomb rings constituting the mica surface.53 In addition, the adsorbed water exists at a slightly lower position than the first hydration layer. Thus, even for a single force curve measurement at the center of the honeycomb ring, the force corresponding to the adsorbed water molecule appears only when the apex of the probe is atomically sharp enough, which is not always the case in real experiments. Moreover, at the probe height where the probe apex directly interacts with the adsorbed water, the probe apex (and its lateral surface) should feel strong steric repulsive force from the mica surface. Therefore, even when the probe satisfies the aforementioned requirement, it is difficult to detect the force originating from the adsorbed water.
Comparing Fig. 9 and 10, gAFM obtained from the effective diameter 1.0 nm is the closest in amplitude to those obtained by using X-ray reflectivity, MD simulations, and MC simulations. Therefore, the effective diameter of the tip apex is roughly determined to be 1.0 nm, which accords with the size of the model tip used in MD simulations.19,31,32 This fact supports that the sizes of the model tips used in MD simulations are valid. We note that we obtained the similar results of the hydration structure and the effective diameter from a force curve measured by Fukuma et al. in 2012.13 Thus, reproducibility of gAFM has been confirmed. (Also in the measurement, an ultrashort cantilever with both ultralow noise and megahertz-order resonance frequencies is used.)
If one uses the mica surface as a standard surface, one can determine the effective diameter of the experimentally used tip apex by performing the comparison between gAFM and a hydration structure obtained by another method. After determination of the effective diameter, hydration structures on arbitrary substrates (e.g., organic and inorganic crystals, and a biological membrane) may be obtained by reusing the value of the effective diameter.
Conclusions
We have proposed a theory (HPA transform) that transforms the force curve f measured by AFM into the number density distribution of the small spheres on the substrate gBS. In the derivation of the transform theory, we have taken into account both ‘the destruction of the original number density distribution on the substrate by the presence of the probe’ and ‘the number density distribution of the small spheres around the probe itself’. To check the validity of the transform theory, the validation tests have been conducted by using OZ–HNC–VCG. Since OZ–HNC–VCG reproduces the number density distributions very precisely, the validation tests have been performed in highly reliable conditions. It has been found that the transform theory can semi-quantitatively reproduce the number density distribution. As the first practical use of the transform theory, we have estimated the hydration structure on muscovite mica (001) surface by using a force curve measured by AFM. In the course of the estimation of the hydration structure, we have found that the effective diameter of the tip apex accords with that of the model probes used in MD simulations.19,31,32 This fact corroborates that the sizes of the model probes used in MD simulations are valid.Until now, the force curve f measured by AFM has not been well transformed into the number density distribution gBS. If DFA (delta function approximation) is applied for the calculation of gBS, the value of gBS far from the surface of the substrate becomes zero. Furthermore, if STA (solvent tip approximation) is applied for the calculation of gBS, the difference between oscillatory amplitudes of gBS and the benchmark structure g0 becomes erroneously large, because the effective diameter of the real tip apex is not (always) as small as the solvent molecule. In fact, the effective diameter of the real probe in this study has been estimated to be about 1.0 nm, which is three to four times larger than that of a water molecule. In this paper, f was properly transformed into gBS through HPA transform. The orders of the oscillatory amplitude and oscillatory length of gBS and g0 fitted each other. Thus, it is expected that HPA transform is a practical theory for AFM to obtain the number density distributions of the solvent molecules and the colloidal particles on a substrate.
Since AFM can be operated in a semi-biological environment,8,11,12,14,16 we expect that the combination of AFM and HPA transform is valuable for the study of biological interfaces. For example, 3D force distribution has already been observed on a membrane composed of GroEL proteins37 by using a bimodal AFM.16 Hence, it is expected in the near future that 3D hydration structure on a biological membrane will be obtained by using both AFM and HPA transform. 3D hydration structure on a solid substrate is also expected to be obtained in the near future. Since X-ray and neutron beam technologies have not elucidated 3D hydration structure on a biological membrane yet, experimental estimation of the 3D hydration structure is thought to be important. In addition, as a general interest, we are interested in the number density distribution of colloid particles on a substrate. Since colloid-induced force has already been measured by colloidal-probe AFM,9,47 we believe that the combination of colloidal-probe AFM and HPA transform will shed light on the analysis of the soft matter interface.
Methods
In the AFM experiments, we used a custom-built frequency modulation AFM (FM-AFM) with an ultra-low noise cantilever deflection sensor57,58 and a high stability photothermal excitation system.13,59 A commercially available phase-locked loop (PLL) circuit (OC4, SPECS) was used for oscillating a cantilever at its resonance frequency (f0) with a constant amplitude (A = 163.5 pm) and for detecting the frequency shift (Δf) induced by the variation in the tip–sample interaction force. The AFM head was controlled with a commercially available AFM controller (ARC2, Asylum Research). We modified the control software to perform 3D Δf measurements. We measured a 3D Δf distribution on a cleaved muscovite mica surface (01877-MB, SPI Supplies) in a 10 mM phosphate buffered saline (PBS) solution (P4417-50TAB, Sigma-Aldrich) at room temperature.The 3D Δf image was obtained by operating the AFM in the 3D scanning force microscopy (3D-SFM) mode.10 The size of the original 3D Δf image was 4 nm × 4 nm × 1.5 nm with 64 × 64 × 256 pixels in xyz directions. The frequency and the amplitude of the z modulation and the lateral scan speed during the 3D measurement were 195.3 Hz, 1.5 nm and 12.2 mm s−1, respectively. We converted the 3D Δf image to the 3D force image using Sader's equation.60 The force curve shown in Fig. 8 was obtained by averaging all the force curves constituting the 3D force image.
We used commercially available small cantilevers (USC-Fk-k30, Nanoworld) with the following modifications.17 We removed the carbon tip fabricated by electron beam deposition (EBD) which comes with an as-purchased USC cantilever. We attached a silica bead with a diameter of 2 μm (43-00-203 Sicastar, Micromod) on the cantilever end. We fabricated an EBD tip with a length of 500 nm and a tip apex radius of less than 10 nm using a field emission scanning electron microscope (FE-SEM) (ERA-8000FE, ELIONIX) with a 30 kV accelerating voltage on the attached silica bead. Just before the experiments, we coated the cantilever with Si (30 nm) using a direct current sputter coater (K575XD, Emitech) to improve the reproducibility of the atomic-scale AFM imaging.51
To convert the Δf curves constituting the 3D Δf image to the force curves, the cantilever deflection sensitivity and the cantilever spring constant (k) must be calibrated. Among the various methods proposed,61–71 we used the thermal noise method61 as described below. At the end of the experiment, we measured a static force curve on the mica surface and estimated the optical beam deflection sensitivity. With the estimated sensitivity, a thermal vibration spectrum of the cantilever was quantitatively measured. We fitted the equation for a simple harmonic oscillator model to the obtained curve and thereby estimated f0, Q factor, and k as 4.36 MHz, 8.0, and 52.6 N m−1, respectively.
Acknowledgements
We appreciate support from Masahiro Kinoshita and Kazuhiro Suzuki. This work was mainly supported by Grant-in-Aid for Young Scientists (B) from the Japan Society for the Promotion of Science (the grant number is 15K21100). This work was partially supported by Grant-in-Aid for Scientific Research (B) from the Japan Society for the Promotion of Science (the grant numbers are 25286009 and 15H03877) and Kanazawa University CHOZEN Project. We are very thankful to Koyomi Nakazawa for drawing the inside front cover.References
- L. Cheng, P. Fenter, K. L. Nagy, M. L. Schlegel and N. C. Sturchio, Phys. Rev. Lett., 2001, 87, 156103 CrossRef CAS PubMed.
- P. Geissbühler, P. Fenter, E. DiMasi, G. Srajer, L. B. Sorensen and N. C. Sturchio, Surf. Sci., 2004, 573, 191–203 CrossRef.
- P. Fenter and N. C. Sturchio, Prog. Surf. Sci., 2005, 77, 171–258 CrossRef.
- M.-C. Bellissent-Funel, R. Sridi-Dorbez and L. Bosio, J. Chem. Phys., 1996, 104, 10023 CrossRef.
- D. Schwnedel, T. Hayashi, R. Dahint, A. Pertsin, M. Grunze, R. Steitz and F. Shchreiber, Langmuir, 2003, 19, 2284–2293 CrossRef.
- R. G. Horn and J. N. Israelachvili, J. Chem. Phys., 1981, 75, 1400 CrossRef CAS.
- H. K. Christenson, Chem. Phys. Lett., 1985, 118, 455–458 CrossRef CAS.
- T. Fukuma, M. J. Higgins and S. P. Jarvis, Biophys. J., 2007, 92, 3603–3609 CrossRef CAS PubMed.
- N. C. Christov, K. D. Danov, Y. Zeng, P. A. Kralchevsky and R. von Klitzing, Langmuir, 2010, 26, 915–923 CrossRef CAS PubMed.
- T. Fukuma, Y. Ueda, S. Yoshioka and H. Asakawa, Phys. Rev. Lett., 2010, 104, 016101 CrossRef PubMed.
- K. Kimura, S. Ido, N. Oyabu, K. Kobayashi, Y. Hirata, T. Imai and H. Yamada, J. Chem. Phys., 2010, 132, 194705 CrossRef PubMed.
- H. Asakawa, S. Yoshioka, K. I. Nishimura and T. Fukuma, ACS Nano, 2012, 6, 9013–9020 CrossRef CAS PubMed.
- T. Fukuma, K. Onishi, N. Kobayashi, A. Matsuki and H. Asakawa, Nanotechnology, 2012, 23, 135706 CrossRef CAS PubMed.
- T. Sugihara, I. Hayashi, H. Onishi, K. Kimura and A. Tamura, Chem. Phys., 2013, 419, 74–77 CrossRef CAS.
- R. Nishioka, T. Hiasa, K. Kimura and H. Onishi, J. Phys. Chem. C, 2013, 117, 2939–2943 CAS.
- E. T. Herruzo, H. Asakawa, T. Fukuma and R. Garcia, Nanoscale, 2013, 5, 2678–2685 RSC.
- K. Miyazawa, H. Izumi, T. Watanabe-Nakayama, H. Asakawa and T. Fukuma, Nanotechnology, 2015, 26, 105707 CrossRef CAS PubMed.
- K. Miyazawa, N. Kobayashi, M. Watkins, A. L. Shluger, K. Amano and T. Fukuma, Nanoscale, 2016, 8, 7334–7342 RSC.
- M. Watkins and B. Reischl, J. Chem. Phys., 2013, 138, 154703 CrossRef PubMed.
- K. Amano, K. Suzuki, T. Fukuma, O. Takahashi and H. Onishi, J. Chem. Phys., 2013, 139, 224710 CrossRef PubMed.
- K. Amano and O. Takahashi, Physica A, 2015, 425, 79–89 CrossRef CAS.
- K. Amano, E. Tanaka, K. Kobayashi, H. Onishi, N. Nishi and T. Sakka, Surf. Sci., 2015, 641, 242–246 CrossRef CAS.
- K. Amano, 2015, arXiv:1505.04360.
- B. V. Derjaguin, Y. I. Rabinovich and N. V. Churaev, Nature, 1977, 265, 520–521 CrossRef CAS.
- M. Oettel, Phys. Rev. E: Stat., Nonlinear, Soft Matter Phys., 2004, 69, 041404 CrossRef CAS PubMed.
- S. Rentsch, R. Pericet-camara, G. Papastavrou and M. Borkovec, Phys. Chem. Chem. Phys., 2006, 8, 2531–2538 RSC.
- J. G. Kirkwood and E. M. Boggs, J. Chem. Phys., 1942, 10, 394–402 CrossRef CAS.
- Y. Karino, R. Akiyama and M. Kinoshita, J. Phys. Soc. Jpn., 2009, 78, 044801 CrossRef.
- S. Asakura and F. Oosawa, J. Polym. Sci., 1958, 33, 183–192 CrossRef CAS.
- M. Kinoshita, Front. Biosci., 2009, 14, 3419–3454 CrossRef CAS.
- M. Watkins, M. L. Berkowitz and A. L. Shluger, Phys. Chem. Chem. Phys., 2011, 13, 12584–12594 RSC.
- B. Reischl, M. Watkins and A. S. Foster, J. Chem. Theory Comput., 2013, 9, 600–608 CrossRef CAS PubMed.
- T. Lazaridis and M. E. Paulaitis, J. Phys. Chem., 1994, 98, 635–642 CrossRef CAS.
- W. L. Jorgensen, J. Chem. Phys., 1982, 77, 5757–5765 CrossRef CAS.
- W. Jorgensen and C. Ravimohan, J. Chem. Phys., 1985, 83, 3050–3054 CrossRef CAS.
- M. Harada and M. Tsukada, Phys. Rev. B: Condens. Matter Mater. Phys., 2010, 82, 1–15 CrossRef.
- K. Amano, H. Oshima and M. Kinoshita, J. Chem. Phys., 2011, 135, 185101 CrossRef PubMed.
- J.-P. Hansen and I. R. McDonald, Theory of Simple Liquids, Academic Press, London, 1986 Search PubMed.
- N. Choudhury and S. K. Ghosh, J. Chem. Phys., 2002, 116, 8517–8522 CrossRef CAS.
- L. Verlet, Mol. Phys., 1980, 41, 183–190 CrossRef CAS.
- D.-M. Duh and D. Henderson, J. Chem. Phys., 1996, 104, 6742 CrossRef CAS.
- D. H. Everett and J. C. Powl, J. Chem. Soc., Faraday Trans. 1, 1976, 72, 619 RSC.
- D. W. Siderius and L. D. Gelb, J. Chem. Phys., 2011, 135, 084703 CrossRef PubMed.
- P. H. Fuoss and L. J. Norton, Phys. Rev. Lett., 1988, 60, 2046–2049 CrossRef CAS PubMed.
- M. A. Lantz, H. J. Hug, R. Hoffmann, P. J. A. van Schendel, P. Kappenberger, S. Martin, A. Baratoff and H.-J. Guntherodt, Science, 2001, 291, 2580–2583 CrossRef CAS PubMed.
- Y. Sugimoto, T. Namikawa, K. Miki, M. Abe and S. Morita, Phys. Rev. B: Condens. Matter Mater. Phys., 2007, 77, 195424 CrossRef.
- S. Grandner, Y. Zeng, R. V. Klitzing and S. H. L. Klapp, J. Chem. Phys., 2009, 131, 154702 CrossRef PubMed.
- Y. Naitoh, T. Kamijo, Y. J. Li and Y. Sugawara, Phys. Rev. Lett., 2012, 109, 215501 CrossRef CAS PubMed.
- S. M. R. Akrami, H. Nakayachi, T. Watanabe-Nakayama, H. Asakawa and T. Fukuma, Nanotechnology, 2014, 25, 455701 CrossRef CAS PubMed.
- L. T. Zhuravlev, Colloids Surf., A, 2000, 173, 1–38 CrossRef CAS.
- D. Argyris, N. R. Tummala, A. Striolo and D. R. Cole, J. Phys. Chem. C, 2012, 13587–13599 Search PubMed.
- D. Argyris, D. R. Cole and A. Striolo, Langmuir, 2009, 25, 8025–8035 CrossRef CAS PubMed.
- J. Wang, A. G. Kalinichev, R. J. Kirkpatrick and R. T. Cygan, J. Phys. Chem. B, 2005, 109, 15893–15905 CrossRef CAS PubMed.
- H. Sakuma and K. Kawamura, Geochim. Cosmochim. Acta, 2009, 73, 4100–4110 CrossRef CAS.
- S. Park and G. Sposito, Phys. Rev. Lett., 2002, 89, 085501 CrossRef PubMed.
- K. Kobayashi, N. Oyabu, K. Kimura, S. Ido, K. Suzuki, T. Imai, K. Tagami, M. Tsukada and H. Yamada, J. Chem. Phys., 2013, 138, 184704 CrossRef PubMed.
- T. Fukuma, M. Kimura, K. Kobayashi, K. Matsushige and H. Yamada, Rev. Sci. Instrum., 2005, 76, 053704 CrossRef.
- T. Fukuma and S. P. Jarvis, Rev. Sci. Instrum., 2006, 77, 1–8 Search PubMed.
- T. Fukuma, Rev. Sci. Instrum., 2009, 80, 023707 CrossRef PubMed.
- J. E. Sader and S. P. Jarvis, Appl. Phys. Lett., 2004, 84, 1801 CrossRef CAS.
- J. L. Hutter and J. Bechhoefer, Rev. Sci. Instrum., 1993, 64, 1868–1873 CrossRef CAS.
- H. J. Butt, B. Cappella and M. Kappl, Surf. Sci. Rep., 2005, 59, 1–152 CrossRef CAS.
- S. M. Cook, K. M. Lang, K. M. Chynoweth, M. Wigton, R. W. Simmonds and T. E. Schäffer, Nanotechnology, 2006, 17, 2135–2145 CrossRef CAS.
- R. Wagner, R. Moon, J. Pratt, G. Shaw and A. Raman, Nanotechnology, 2011, 22, 455703 CrossRef PubMed.
- J. E. Sader, J. A. Sanelli, B. D. Adamson, J. P. Monty, X. Wei, S. A. Crawford, J. R. Friend, I. Marusic, P. Mulvaney and E. J. Bieske, Rev. Sci. Instrum., 2012, 83, 103705 CrossRef PubMed.
- A. D. Slattery, J. S. Quinton and C. T. Gibson, Nanotechnology, 2012, 23, 285704 CrossRef PubMed.
- A. D. Slattery, A. J. Blanch, J. S. Quinton and C. T. Gibson, Nanotechnology, 2012, 24, 015710 CrossRef PubMed.
- A. D. Slattery, A. J. Blanch, J. S. Quinton and C. T. Gibson, Ultramicroscopy, 2013, 131, 46–55 CrossRef CAS PubMed.
- J. E. Sader, J. Lu and P. Mulvaney, Rev. Sci. Instrum., 2014, 85, 113702 CrossRef PubMed.
- A. D. Slattery, A. J. Blanch, V. Ejov, J. S. Quinton and C. T. Gibson, Nanotechnology, 2014, 25, 335705 CrossRef PubMed.
- Y.-P. Song, S. Wu, L.-Y. Xu, J.-M. Zhang, D. J. Dorantes-Gonzalez, X. Fu and X.-D. Hu, Meas. Sci. Technol., 2015, 26, 065001 CrossRef.
Footnote |
| † Electronic supplementary information (ESI) available: Further tests of HPA transform are performed. See DOI: 10.1039/c6cp00769d |
| This journal is © the Owner Societies 2016 |

