Probing the thermal stability and the decomposition mechanism of a magnesium–fullerene polymer via X-ray Raman spectroscopy, X-ray diffraction and molecular dynamics simulations†
Received
16th December 2015
, Accepted 13th January 2016
First published on 13th January 2016
Abstract
We report the microscopic view of the thermal structural stability of the magnesium intercalated fullerene polymer Mg2C60. With the application of X-ray Raman spectroscopy and X-ray diffraction, we study in detail the decomposition pathways of the polymer system upon annealing at temperatures between 300 and 700 °C. We show that there are at least two energy scales involved in the decomposition reaction. Intermolecular carbon bonds, which are responsible for the formation of a 2D fullerene polymer, are broken with a relatively modest thermal energy, while the long-range order of the original polymer remains intact. With an increased thermal energy, the crystal structure in turn is found to undergo a transition to a novel intercalated cubic phase that is stable up to the highest temperature studied here. The local structure surrounding magnesium ions gets severely modified close to, possibly at, the phase transition. We used density functional theory based calculations to study the thermodynamic and kinetic aspects of the collapse of the fullerene network, and to explain the intermediate steps as well as the reaction pathways in the break-up of this peculiar C60 intermolecular bonding architecture.
1 Introduction
Fullerenes and their compounds remain among the most actively studied materials in the world of carbon nanostructures due to their potential application in energy storage or conversion.1 In the former case, they have been successfully applied as reversible H2 solid-state storage media;2,3 in the latter, they are ubiquitously considered suitable acceptors in photoinduced electron processes because of their high electron affinity and ability to transport charge effectively.4 Polymeric networks of fullerenes, in particular, are gaining increasing attention after the remarkable report of the superhard C60-based amorphous phase obtained under pressure, with the bulk modulus exceeding that of diamond.5 C60 polymerization can either be photoactivated,6 caused by external pressure7 or induced by the intercalation of alkali metals that promote Coulomb interaction, thus contracting the fullerene lattice.8 This leads to the formation of either 1D, 2D or 3D networks of fullerenes (some examples are,9–11 respectively) whose binding schemes are mainly driven by the electronic structure of C60 molecules.12 Such versatile structures are due to different possible addition reactions: the most common network is produced in a [2+2] cycloaddition reaction driving the formation of four-membered carbon rings between adjacent fullerenes. This is normally observed in pressure- and photo-polymerized structures, while single C–C bonds are favoured when the C60 LUMO is populated.13 Mixed architectures are also observed.14 This is the case of magnesium intercalated fullerene salt MgxC60. With a relatively high magnesium stoichiometry x = 4, a 2D polymer is created, where C60 molecules connect with a purely [2+2] cycloaddition bonding network.15 For the lower stoichiometry, x = 2, a monoclinic lattice is stabilized and C60 units are interconnected by four member carbon rings and single C–C bonds along orthogonal directions.16 The observation of ionic conductivity in Mg2C6016 makes the study of such a system timely because of its great attractiveness for rechargeable Mg-ion batteries, as already highlighted by the high rate capability of fullerene–magnesium clusters as cathodes.17 The decomposition steps, their chemistry, and activation energies are crucial information when considering the material's safe use in Mg–ion electrochemistry. Furthermore, a thorough understanding of the polymer C60 formation and decomposition has a paramount importance for the successful exploitation of the superhard materials that C60 can create.5 In this work we explore the structural stability of Mg2C60 by a combined X-ray Raman and X-ray diffraction study, and address the thermal decomposition of the polymer and its products. These different probes are sensitive to the long range order (XRD) and to the local structure (XRS) yielding a contrast to size-scales in the decomposition process. We complementarily apply DFT and shed light on the thermodynamics and dynamics of the decomposition pathway after the exposure of the polymer to high temperatures.
2 Methods
2.1 X-ray Raman spectroscopy
X-ray Raman spectroscopy (XRS) is a technique based on the measurement of the energy of X-rays18 and the evaluation of their energy loss yields the energy transfer in the inelastic scattering process. The scattering event can be modelled with the first order perturbation theory describing the transition of an electron from its ground state |i〉 with energy E1 to the final state |f〉 whose energy is E2. During excitation, the incoming photon with polarization ε1 and energy ω1 is transformed to the outgoing one with polarization ε2 and energy ω2. The transition is fully described by the double differential cross section given by| |  | (1) |
where r0 refers to the classical electron radius, whereas the term S(q,ω) is the dynamic structure factor that is expressed by| |  | (2) |
The summation accounts for all possible final states f and electrons j of the system and ℏq and ℏω are, respectively, the momentum and energy transferred to the system in the scattering process.19 XRS yields an information which is fully equivalent to X-ray absorption spectroscopy but includes the advantages of 1- sensitivity to low energy exchange (exploring the region from fractions of meV20 to keV21) and 2- probing depth of hard X-rays which can bring unique bulk chemical information from low-energy absorption edges.
The XRS experiment was performed using the 72-element X-ray Raman spectrometer on the beamline ID20/UPBL6 of the European Synchrotron Radiation Facility (ESRF). The beam was monochromated using a Si(111) double crystal and Si(311) channel-cut monochromators, and focused to a spot size of 20 × 20 μm. The spectrometer employs Si(660) analyzers that reflect X-rays with a fixed photon energy of 9.69 keV with an energy resolution of 0.6 eV. Spectra were collected at room temperature on various thermally treated samples. A suitable background was subtracted from the spectra and they were normalized over the whole edge intensity to a fixed area in the range 280–310 eV for the C K edge and 45–68 eV for the Mg L2,3 edge.22,23
2.2 Materials
The air sensitivity of the materials required their handling under strict oxygen and moisture free conditions (less than 1 ppm O2 and H2O). The Mg2C60 fullerene polymer was prepared using the solid state reaction between magnesium (Alfa Aesar, purity 99.8%) and fullerene powders (MER corp., purity 99.9%) described in a previous paper by some of the authors.16 A few milligrams of this material were carefully sealed in quartz capillaries under an argon atmosphere, prior to their exposure to high temperature for decomposition treatment. Temperature was increased with a constant rate of 100 °C per hour from normal conditions up to the temperature target, where dwelling time of 30 min was applied in all the treatments unless differently specified. Decompositions were performed between 300 °C and 700 °C; at the end all samples were quenched to room temperature. Powder diffraction was performed on two different diffractometers both employing Cu Kα radiation.
2.3 DFT calculations
First-principles quantum mechanical simulations were performed using the Castep module24 of the Materials Studio software, density functional theory and local density approximation25 with ultrasoft pseudopotentials.26 In addition, high temperature dynamics was explored up to 0.5 picosecond with femtosecond steps. Polymer fragments consisting of four fullerene units were enclosed in a triclinic (space group P1) unit cell and their dangling bonds were saturated with hydrogen atoms. In the static calculations, and as the initial structure for the MD calculations, experimental atomic positions and lattice parameters were used for the polymer16 and, likewise, experimental values were set for the C–H distances. The system was simulated as an NVT ensemble using a Nosé thermostat27 and 1000 °C temperature.
3 Results and discussion
3.1 Carbon K edge XRS
X-ray Raman spectroscopy results of the carbon K edge are shown in Fig. 1. In pristine Mg2C60 the π*-type peak is clearly visible at the energy of 285 eV composed of two partially overlapping features located at 284.5 and 286 eV. The edge profile increases at 290 eV and is composed of a broad structure at 292 eV and a more dispersed contribution with its centre of mass around 300 eV. The spectral signatures strongly resemble the ones of the 2D polymer form of C60 created under high pressure and measured by XRS.28 We can therefore assign the merged shape of peaks labelled I and II to the polymer network. When the sample is treated at increasing temperatures peak I is slightly shifted to lower energies and peaks I and II become clearly separated. A further peak (III) emerges at 286.5 eV. Furthermore, peak IV slightly changes from a broad single feature to a double-peak whose separation increases with increasing annealing temperature. The pre-edge peaks labelled I, II and III correspond to the 1s → π* transitions and IV and V correspond to the 1s → σ* transitions,29,30 respectively. The spectral features of the pre-edge were originally discussed by Rueff et al.28 and attributed to the excited states with t1u, t2u and ag symmetries, respectively. The ag state (III), in particular, appears in fullerene monomer only and can be therefore considered as the fingerprint of the breakage of the interlinking C60 molecular bonds, which leads to the formation of C60 monomers at relatively modest temperatures: in this case between 300 and 550 °C.
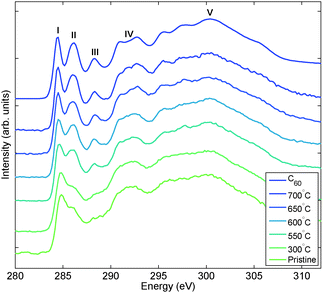 |
| | Fig. 1 X-ray Raman spectra of the carbon K edge for pristine and thermally decomposed Mg2C60 samples. Reference spectrum for pure C60 is included for comparison. The duration of the thermal decomposition was 30 min. | |
3.2 X-ray diffraction
Selected XRD patterns are reported in Fig. 2 and the conservation of the polymer can be clearly noticed by the strong (011) reflection at 2Θ = 13.7° after treatments up to 600 °C. Interestingly, this clearly shows that while the C60 molecular bonds are already compromised at those temperatures, the long-range order takes more energy to be destroyed. Only treatments at T higher than 600 °C result in the decomposition of the polymer shown by the disappearance of the polymer-related diffraction peak. In those cases, we observe an XRD pattern that indicates a cubic structure compatible with the symmetry of pure C60 (s.g. Fm![[3 with combining macron]](https://www.rsc.org/images/entities/char_0033_0304.gif) m) and a lattice parameter a = 14.11 Å. In order to exclude a possible uncertainty in the calibration of the instrument, and thus excluding those peaks belonging to pure C60, whose s.g. Fm
m) and a lattice parameter a = 14.11 Å. In order to exclude a possible uncertainty in the calibration of the instrument, and thus excluding those peaks belonging to pure C60, whose s.g. Fm![[3 with combining macron]](https://www.rsc.org/images/entities/char_0033_0304.gif) m and a = 14.16 Å, the measurements were repeated on two different diffractometers yielding identical results. This cubic phase emerges from the polymer collapse for all temperatures above 450 °C and it appears to be an intermediate decomposition product with a limited thermodynamic stability: decomposition at temperature higher than 600 °C strongly affects its crystallinity and drives the formation of a mainly amorphous structure where only very weak and broad diffraction peaks can be seen.
m and a = 14.16 Å, the measurements were repeated on two different diffractometers yielding identical results. This cubic phase emerges from the polymer collapse for all temperatures above 450 °C and it appears to be an intermediate decomposition product with a limited thermodynamic stability: decomposition at temperature higher than 600 °C strongly affects its crystallinity and drives the formation of a mainly amorphous structure where only very weak and broad diffraction peaks can be seen.
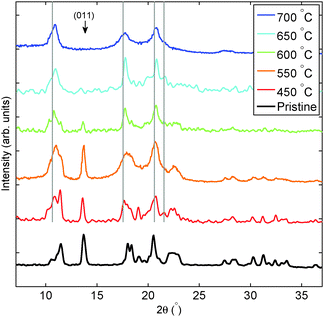 |
| | Fig. 2 X-ray diffraction after thermal treatments of Mg2C60. The duration of the applied thermal treatments was 30 min. Vertical thin grey lines correspond to the reflection of pure C60. | |
3.3 Time evolution of the decomposition reaction
In order to ascertain the character of the final state of the decomposition reaction, we measured samples treated under an extended thermal treatment of 60 min. The resulting XRD and carbon K edge spectra are reported in Fig. 3. The picture presented by XRD shows that the same monomer structure previously achieved can be obtained via a longer treatment at more moderate temperatures. The cubic phase is stabilized at 450 °C and treatments at a higher temperature accordingly result in the same monomer structure. Its crystallinity, however, is strongly affected and diffraction peaks appear much weaker than in the case of shorter treatments for temperatures higher than 600 °C. XRS is in agreement with XRD and shows that longer treatments result in breaking the polymer network and creating C60 monomers. The spectra of the annealed system indeed resemble that of the C60 reference. When comparing the intensity of peak III and the width of I and II after 60 min long exposure to 450 °C and 30 min exposure to either 550 or 600 °C, we notice that they are more intense and sharper, respectively. This shows that the decomposition reaction is further developed towards the release of the C60 monomer. As a conclusion, we can state that within the decomposition process of the network of the C60 molecules, there are two different energy scales involved: the individual C60 short-range bonds can be lost with less thermal energy than is needed to alter the crystalline long-range order. The sheer information on the long-range order does not necessarily imply structural stability on the inter-fullerene scale. This may set new standards in the understanding of the physics and chemistry of fullerene polymers with traditional characterization tools.
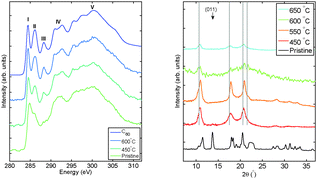 |
| | Fig. 3 Carbon K edge XRS (left panel) and X-ray diffraction (right panel) measurements after extended thermal treatments of Mg2C60. The duration of the applied thermal treatments was 60 min. | |
3.4 Magnesium L2,3 edge XRS
Even further insight into the decomposition reaction is offered by magnesium L2,3 edge XRS spectra in the polymer and in the decomposed phase that we report in Fig. 4. The spectrum of the pristine sample reveals the onset of absorption at around 51 eV and a rather featureless EXAFS region with a weak broad feature at around 4 eV from the onset. The spectrum remains unchanged after 550 °C treatment, where the polymer is still present, according to XRD, while interlinking C60 bonds are already broken, according to XRS. The spectrum changes considerably for the sample treated at 700 °C. From XRD we know that, at that point, the compound is fully decomposed and Mg L2,3 absorption probes the magnesium environment in the cubic phase. The near edge feature at 51 eV seems strongly suppressed while the peak is shifted to higher energies at around 52 eV. The most intriguing aspect of the behaviour of magnesium across decomposition comes from the parallel observation of carbon K edges at the same temperatures. For the pristine sample both C and Mg spectra appear descriptive of the inter-linked C60 and intercalated Mg present in the polymer structure, but their results surprisingly differ at 550 °C. The Mg L2,3 edge is comparable to the one recorded in the pristine sample, which describes magnesium in the polymer phase, while carbon already presents the features (see peak III in Fig. 1) that characterize the monomer C60. This defines the mechanism of Mg2C60 depolymerization: Mg migration and the rearrangement of its local environment takes a higher activation energy than the breaking of the individual C60 bonds. Cautiously estimating, taking into account the limited number of data points, the change of the local structure surrounding Mg ions may coincide with the change in the crystal structure, or at least lies in its vicinity. Depolymerization of fullerenes conserves the symmetry of the system detected by XRD and does not affect Mg ions. For higher temperatures, fullerenes organize in a different cubic lattice for the monomer phase and Mg ions are stabilized in a new local structure, which determines the blue-shift of the spectrum of the sample decomposed at 700 °C. This feature is not to be attributed to a segregation of magnesium. Recorded spectra present a large shift towards higher energies with respect to the edge position in the magnesium metal: such a reference can exclude the existence of segregated metallic Mg. At the same time we know from XRD that the polymer is still present in Mg2C60 treated at 550 °C; thus the spectra of the pristine compound and of the sample treated at 550 °C describe Mg in the oxidation state +2 within the polymer. Therefore, the Mg L2,3 edges provide convincing indication of the intercalated nature of Mg ions (in agreement with the picture of intercalated magnesium confirmed by optical Raman measurements which are reported in the ESI†).
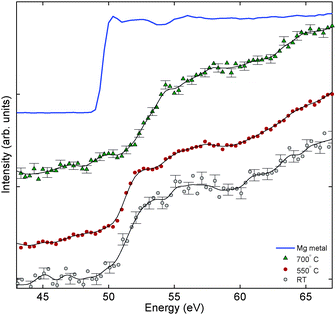 |
| | Fig. 4 Magnesium L2,3 edge spectra in Mg2C60 after treatments of 30 min at different temperatures. The reference spectrum of pure magnesium metal is included. | |
3.5 DFT calculations
In order to get a complementary insight, we addressed the decomposition of Mg2C60 with a static calculation of energetics and with molecular dynamics simulations. A fragment of the polymer consisting of four fullerene molecules, terminated with hydrogen atoms, was built according to the polymer binding network and enclosed in a primitive triclinic cell (P1 symmetry). Since the XRS results showed a little or no influence of magnesium on the decomposition mechanism of the fullerene network, it is justified to omit the intercalated ion from the simulation and hence we explored the dynamics of the bare C60 layer. Double and single inter-fullerene bridging bonds were alternatively cut and their energies were calculated. Fig. 5 reports the energy levels for different structures, relative to the pristine polymer network. The configuration with residual double bonds lies at an energy of 0.28 eV higher than the pristine structure while the other with residual single bonds has an energy higher by 7.44 eV and is close to the fully decomposed polymer (7.89 eV). Since the minimum energy required for the transition to the structure with a double-bond is much lower than the one with a single-bond, the total energy calculations of the system suggest the cleavage of the single bond as the first step of depolymerization. However it should be noted that this static picture does not take into account the activation energy required for the transition. For this reason we performed molecular dynamics calculations to get further insights into the decomposition pathways. We calculated the dynamics of the pristine polymer fragment at 1000 °C and we present the results in Fig. 6. The simulated temperature was intentionally set higher than the experimental ones in order to speed up the structural decomposition within the time window explorable by DFT.
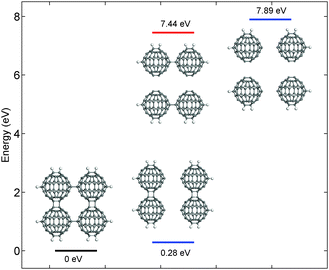 |
| | Fig. 5 Energy levels predicted in different reaction pathways. The simulation included four adjacent C60 units of a single two-dimensional layer terminated with hydrogen atoms. | |
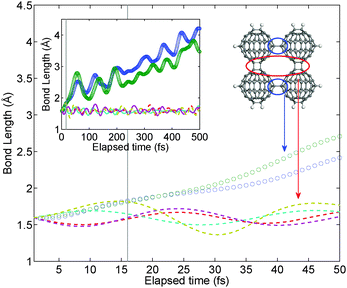 |
| | Fig. 6 Inter-fullerene distance in the molecular dynamics simulation concerning the evolution of a polymer fragment at the temperature of 1000 °C: circles correspond to single bonds, lines to the network of double bonds. Vertical thin lines mark the range of stabilization during simulation. The inset shows the results of the whole simulation up to 0.5 ps. The simulation unit and the bonds concerned are shown. | |
The main panel and the inset report the distance between carbon atoms involved in inter-fullerene bonding: single inter-C60 bonds are shown with circles while double inter-C60 bonds with dashed lines. Vertical thin lines mark the time necessary for the stabilization process (estimated around 17 fs) while the other inset graphically helps in attributing the results. The most intriguing aspect of the dynamical calculation is the agreement with the thermodynamics of the system. During the run both single bonds (whose initial length is 1.584 Å) start stretching and after a quick exposure of 40 fs the distance between C atoms exceeds 2 Å, clearly suggesting the path towards the collapse of the network. The distance of the single bonds keeps increasing during the whole simulation; double bonds, instead, keep oscillating around their average values (1.606, 1.594, 1.578 and 1.588 Å), which are similar to the bond length at room temperature (1.595 Å), thus suggesting that the decomposition has not yet addressed the double bond network. We may therefore conclude that the decomposition of the fullerene polymer Mg2C60 begins via the collapse of the weaker single-bond network, as highlighted by both energetic and kinetic perspectives.
4 Conclusions
By the complementary application of X-ray Raman spectroscopy, X-ray diffraction, as well as DFT calculations for both energetics and kinetics, we provided a thorough description of decomposition for the 2D intercalated fullerene polymer Mg2C60. The inter-fullerene bonding is broken with the lowest activation energy but the system preserves its crystal structure. This takes place at temperatures even below 450 °C, and its detection requires a local probe that is sensitive to the chemical bonds, such as XRS, since the crystal structure is retained. The polymer crystal structure takes more energy to be modified, and the final decomposition product can be identified to consist of fullerene monomers in a cubic phase, which is stable up to the highest temperatures reached here (700 °C). In this compound Mg still conserves its intercalated nature in the fullerene structure, but its local environment is however modified from that of the original compound. Depolymerization, investigated by molecular dynamics simulations, proceeds via a kinetic mechanism starting from the dissociation of the single-bond network. The system evolves into a completely monomeric structure through a successive detachment of double bonds. These results and the complementarity of spectroscopy, diffraction and dynamical methods, sensitive to both short range interactions and long-range order, offer a new scenario for the study of the physics and chemistry of carbon nanostructures.
The authors would like to acknowledge financial support from the Academy of Finland (grants No. 1254065, 1283136, 1259526, 1259599 and 1260204), European Synchrotron Radiation Facility laboratory for beamtime allocation, Dr Christoph Sahle for support during the X-ray Raman scattering experiment and Dr Tiziano Rimoldi for providing optical Raman measurements.
References
- S. D. Dimitrov, S. Wheeler, D. Niedzialek, B. C. Schroeder, H. Utzat, J. M. Frost, J. Yao, A. Gillett, P. S. Tuladhar, I. McCulloch, J. Nelson and J. R. Durrant, Nat. Commun., 2015, 6, 6501 CrossRef CAS PubMed.
- M. Aramini, C. Milanese, D. Pontiroli, M. Gaboardi, A. Girella and G. Bertoni, Int. J. Hydrogen Energy, 2014, 39(5), 2124–2131 CrossRef CAS.
- M. Aramini, M. Gaboardi, G. Vlahopoulou, D. Pontiroli, C. Cavallari, C. Milanese and M. Riccò, Carbon, 2014, 67, 92–97 CrossRef CAS.
- B. C. Thompson and J. M. J. Frèchet, Angew. Chem., Int. Ed., 2008, 47, 58–77 CrossRef CAS PubMed.
- L. Wang, B. Liu, H. Li, W. Yang, Y. Ding, S. V. Sinogeikin, Y. Meng, Z. Liu, X. C. Zeng and W. L. Mao, Science, 2012, 337, 825–828 CrossRef CAS PubMed.
- A. M. Rao, P. Zhou, K. A. Wang, G. T. Hager, J. M. Holden, Y. Wang, W. T. Lee, X. X. Bi, P. C. Ecklund and D. S. Cornett, Science, 1993, 259(5097), 955–957 CrossRef CAS.
- A. M. Rao, P. C. Eklund, U. D. Venkateswaran, J. Tucker, M. A. Duncan, G. M. Bendele, P. W. Stephens, J. L. Hodeau, L. Marques, M. Núñez-Regueiro, I. O. Bashkin, E. G. Ponyatovsky and A. P. Morovsky, Appl. Phys. A: Mater. Sci. Process., 1997, 64(3), 231–239 CrossRef CAS.
- L. Forrò and L. Mihali, Rep. Prog. Phys., 2001, 64, 649–699 CrossRef.
- M. Riccò, D. Pontiroli, M. Mazzani, F. Gianferrari, M. Pagliari and A. Goffredi, J. Am. Chem. Soc., 2010, 132(6), 2064–2068 CrossRef PubMed.
- D. Quintavalle, F. Borondics, G. Klupp, A. Baserga, F. Simon, A. Jànossy, K. Kamaràs and S. Pekker, Phys. Rev. B: Condens. Matter Mater. Phys., 2008, 77, 155431 CrossRef.
- S. Yamanaka, A. Kubo, K. Inumaru, K. Komaguchi, N. S. Kini, T. Inoue and T. Irifune, Phys. Rev. Lett., 2006, 96, 076602 CrossRef PubMed.
- S. Pekker and G. Oszlanyi, Chem. Phys. Lett., 1998, 282, 435–441 CrossRef CAS.
- G. M. Bendele, P. W. Stephens, K. Prassides, K. Vavekis, K. Kordatos and K. Tanigaki, Phys. Rev. Lett., 1998, 80, 736–739 CrossRef CAS.
- M. Riccò, T. Shiroka, M. Belli, D. Pontiroli, M. Pagliari, G. Ruani, D. Palles, S. Margadonna and M. Tomaselli, Phys. Rev. B: Condens. Matter Mater. Phys., 2005, 72, 155437 CrossRef.
- F. Borondics, G. Oszlanyi, G. Faigel and S. Pekker, Solid State Commun., 2003, 127(4), 311–313 CrossRef CAS.
- D. Pontiroli, M. Aramini, M. Gaboardi, M. Mazzani, A. Gorreri, M. Riccò, I. Margiolaki and D. Sheptiakov, Carbon, 2013, 51, 143–147 CrossRef CAS.
- R. Zhang, F. Mizuno and C. Ling, Chem. Commun., 2015, 51, 1108–1111 RSC.
- Y. Mizuno and Y. Ohmura, J. Phys. Soc. Jpn., 1967, 22(2), 445–449 CrossRef CAS.
-
W. Schülke, Electron dynamics by inelastic X-ray Scattering, Oxford university press, Clarendon Street, Oxford, UK, 2007 Search PubMed.
- Y. Shvyd'ko, S. Stoupin, D. Shu, S. P. Collins, K. Mundboth, J. Sutter and M. Tolkiehn, Nat. Commun., 2014, 5, 4219 Search PubMed.
- S. Huotari, J. A. Soininen, T. Pylkkänen, K. Hämäläinen, A. Issolah, A. Titov, J. McMinis, J. Kim, K. Esler, D. M. Ceperley, M. Holzmann and V. Olevano, Phys. Rev. Lett., 2010, 105, 086403 CrossRef PubMed.
- C. J. Sahle, C. Sternemann, C. Schmidt, S. Lehtola, S. Jahn, L. Simonelli, S. Huotari, M. Hakala, T. Pylkkänen, A. Nyrow, K. Mende, M. Tolan, K. Hämäläinen and M. Wilke, Proc. Natl. Acad. Sci. U. S. A., 2013, 110(16), 6301–6306 CrossRef CAS PubMed.
- W. L. Mao, H. K. Mao, P. J. Eng, T. P. Trainor, M. Newville, C. C. Kao, D. L. Heinz, J. Shu, Y. Meng and R. J. Hemley, Science, 2003, 302(5644), 425–427 CrossRef CAS PubMed.
- S. J. Clark, M. D. Segall, C. J. Pickard, P. J. Hasnip, M. I. J. Probert, K. Refson and M. C. Payne, Z. Kristallogr., 2005, 220, 567–570 CAS.
- J. P. Perdew and A. Zunger, Phys. Rev. B: Condens. Matter Mater. Phys., 1981, 23, 5048–5079 CrossRef CAS.
- G. P. Srivastava and D. Weaire, Adv. Phys., 1987, 26, 463–517 CrossRef.
- S. Nosé, Mol. Phys., 1984, 52, 255–268 CrossRef.
- J. P. Rueff, Y. Joly, F. Bartolome, M. Krisch, J. L. Hodeau, L. Marques, M. Mezouar, A. Kaprolat, M. Lorenzen and F. Sette, J. Phys.: Condens. Matter, 2002, 14, 11635 CrossRef CAS.
- M. Terauchi, S. Nishimura and Y. Iwasa, J. Electron Spectrosc. Relat. Phenom., 2005, 143, 167 CrossRef CAS.
- R. S. Kumar, M. G. Pravic, A. L. Cornelius, M. F. Nicol, M. Y. Hu and P. C. Chow, Diamond Relat. Mater., 2007, 16(4), 1250–1253 CrossRef CAS . See ESI,† at [URL to be inserted by publisher] for Raman measurements of decomposed material.
Footnote |
| † Electronic supplementary information (ESI) available: Optical Raman spectra of the MgxC60 decomposed compound. See DOI: 10.1039/c5cp07783d |
|
| This journal is © the Owner Societies 2016 |
Click here to see how this site uses Cookies. View our privacy policy here.  Open Access Article

![[3 with combining macron]](https://www.rsc.org/images/entities/char_0033_0304.gif) m) and a lattice parameter a = 14.11 Å. In order to exclude a possible uncertainty in the calibration of the instrument, and thus excluding those peaks belonging to pure C60, whose s.g. Fm
m) and a lattice parameter a = 14.11 Å. In order to exclude a possible uncertainty in the calibration of the instrument, and thus excluding those peaks belonging to pure C60, whose s.g. Fm![[3 with combining macron]](https://www.rsc.org/images/entities/char_0033_0304.gif) m and a = 14.16 Å, the measurements were repeated on two different diffractometers yielding identical results. This cubic phase emerges from the polymer collapse for all temperatures above 450 °C and it appears to be an intermediate decomposition product with a limited thermodynamic stability: decomposition at temperature higher than 600 °C strongly affects its crystallinity and drives the formation of a mainly amorphous structure where only very weak and broad diffraction peaks can be seen.
m and a = 14.16 Å, the measurements were repeated on two different diffractometers yielding identical results. This cubic phase emerges from the polymer collapse for all temperatures above 450 °C and it appears to be an intermediate decomposition product with a limited thermodynamic stability: decomposition at temperature higher than 600 °C strongly affects its crystallinity and drives the formation of a mainly amorphous structure where only very weak and broad diffraction peaks can be seen.


