 Open Access Article
Creative Commons Attribution 3.0 Unported Licence
Cross-plane heat transfer through single-layer carbon structures†
Huaichen
Zhang
 *,
Silvia V.
Nedea
,
Camilo C. M.
Rindt
and
David M. J.
Smeulders
Technische Universiteit Eindhoven, De Rondom 70, 5612 AP, Eindhoven, The Netherlands. E-mail: h.zhang@tue.nl; Tel: +31 40 247 3172
First published on 21st January 2016
Abstract
Graphene-based nano-structures have been recently proposed to function as additives to improve the conductivity of thermally sluggish phase change materials (PCMs). Based on the existing research studies, the improvement is dependent not only on the matrix material, but also on the geometry of the carbon structure. To gain more insight into the nano-scale thermal transport problem, we launched the current pilot research using water as the matrix material, to represent the hydroxyl-group-rich sugar alcohols as PCMs. We have found that the heat conduction across a graphene layer to water is much faster than the heat conduction to the graphene layer itself. Also, the high graphene–water thermal contact resistance fails to acknowledge the fast thermal kinetics of the low frequency phonons. In the investigation of the geometry effect, the cross-plane heat transfer coefficient is found to decrease with decreasing CNT diameter except CNT(9,9).
1 Introduction
The fast thermal dissipation in graphene-based structures provides a new solution to increase the heat transfer in low conductivity materials. For example, in heat storage systems, solar energy or waste heat can be compactly stored in phase change materials (PCMs) in analogy to a charged battery. However, in the discharge mode, the low heat conduction in the PCMs results in a low output power,1 thus limiting their potential applications. One way to solve the problem is by mixing in carbon nanostructures. Recent studies show a manyfold increase in thermal conductivity of PCMs by adding in mere 5% carbon nanostructures.2–5 Additionally, the phase equilibrium can be altered in favor of heat storage applications.6,7 It seems that the specific improvement of heat transfer depends not only on the PCM itself, but also on the size, shape, or even the oxidation of the graphene-based structures.8,9 To further replicate the preliminary success, a more in-depth understanding of the nano-scale carbon–PCM interaction and heat transfer is therefore indispensable.A viable way to link the nano-scale thermal transport properties to the overall heat conductivity of the complex material is through effective medium approximations. A key parameter used in these approximations is the contact resistance, also named Kapitza resistance, RK.10,11 In the literature referring to carbon nanotubes (CNTs) embedded in various materials, this RK value varies from 0.76 to 20 × 10−8 K m−2 W−1 depending on the matrix material and the experimental technique.11–13 The newly developed PCMs of our interest are sugar alcohols (SAs), a category of sugar derived materials with multiple hydroxyl groups. Our aim is to gain insight into the nano-scale thermal transport in order to design efficient carbon–PCM composites based on a specific PCM. For such a purpose, it is hard to conclude which RK value to use in the lack of further carbon–SA system information. To start with, we initiated our research based on carbon–water systems instead. Water is also a high-performance PCM and its phase equilibria and nanoscale heat transfer kinetics are well studied both theoretically and experimentally. The fact that water molecules also possess hydroxyl groups and can form a hydrogen bond network helps to set up a good basis for and provide insights into our future carbon–SA research studies.
Apart from various experimental efforts, many theoretical studies have been carried out for both carbon–PCM systems9,14–17 and carbon–water systems.11,18 According to these studies, molecule modeling turned to be a very proficient tool in studying nano-scale thermal transport problems. Using molecular simulation techniques, heat transfer can be directly monitored and the property calculations are straightforward. It is also advantageous to study the phonon transport, a process potentially important in such nano-structured systems.19–21 In the work of Hu et al.,22 the concept of phonon temperature is used to analyze the internal phonon mode equilibration within graphene layers. This phonon equilibration effect may also influence the carbon–water system.
In this study, we choose molecular dynamics simulations to tackle the cross-plane carbon–water heat transfer problem. The study starts with a 1-D heat transfer problem (graphene–water) and is then extended to 2-D heat transfer problems (carbon nanotube–water to investigate the geometry effect on the carbon–water heat transfer). Whereas other theoretical studies are based on various carbon–water interactions, this work is mainly based on a recently developed force field by Pascal et al.23 because of its good prediction on mechanical and thermal properties of graphene. We first introduce the molecular simulation method and models in Section 2. Then the 1-D graphene–water heat transfer problem is studied in Section 3. Using the preferred force field, we extend our study to a variety of single-layer carbon nanotubes (CNTs) focusing on the cross-plane heat transfer to demonstrate the size effects in Section 4. In Section 5, we will further discuss on how our results can be applied to determine the overall heat transfer kinetics of complex materials.
2 Methodology
2.1 Molecular dynamics simulations
In this study, we use molecular dynamics (MD) simulations as the toolbox for quantifying the nanoscale heat transfer phenomena. In MD simulations, the atoms are modeled as point masses which interact with each other according to a set of conservative potentials, called the force fields. The system follows Newton's equations of motion. In our non-equilibrium simulations, temperature coupling is achieved using Nosé–Hoover dynamics.24 The equation of motion in Nosé–Hoover dynamics has an additional term compared with the Newtonian dynamics which is expressed as | (1) |
 | (2) |
In the simulations, it is more intuitive to use the period τT of the oscillations of kinetic energy between the system and the reservoir instead of mξ. The period τT is related to mξvia25
 | (3) |
2.2 Intra-carbon and carbon–water interactions
There are many force fields available for graphene-based structures. In this work, we use a qmff-cx-LJ12-6 (qmcxlj) force field for intra-graphene and intra-carbon nanotube (CNT) interactions.27 This recently developed force field is claimed to correctly reproduce both the thermal and mechanical properties of graphite. On the other hand, this force field is developed towards a dedicated system of pure graphite and not specifically optimized for carbon–water systems. Therefore we choose another two general purposed force fields for comparison: CHARMM (charmm)28 and generalized AMBER (gaff).29 The water model used in this work is the TIP4P-2005 four point model.30 This model reproduces a good phase diagram of water and is used in various solid–liquid phase change studies.31–33 We consider this an important aspect since the carbon structures are proposed to function in solid–liquid phase change materials as mentioned in the Introduction. The non-bonded interactions between water and carbon follow the LJ12-6 form with Wu and Aluru's parameters34 specifically designed for water–graphene/CNT simulations.2.3 Simulation setups
There are three different simulation setups in this work, as illustrated in Fig. 1. (a) The graphene–water out-of-plane heat transfer simulations use single-layer graphene as a heat source at TC = 700 K and its surrounding water as a heat sink at Tw = 300 K. This temperature setting helps to minimize fitting errors in the thermal relaxation simulations while keeping a relatively low carbon temperature. (b) The graphene–water cross-plane simulation uses two graphene layers to separate the water molecules into two compartments. The heat source is the water in one compartment at Tw1 = 320 K and the sink is the water in the other compartment at Tw2 = 280 K. The first two setups would help to investigate the same problem from two perspectives: whether to consider graphene as a heat dissipating source or as a thermal transport medium. (c) Similar to the second setup, the periodic CNT separates the water molecules from the inside to the outside. The inner molecules are used as a heat source at Tw1 and the outer molecules as a sink at Tw2.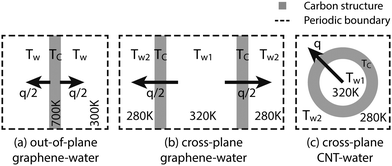 | ||
| Fig. 1 Graphical illustration of the simulation setups used in this work. The graphene layers are roughly of sizes 8 nm × 8 nm and the CNTs are about 5 nm or 12 nm long. | ||
In common, all initial configurations are generated using iterative energy minimization and MD equilibration simulations. The equilibration simulations for each setup are at least 1 ns long and are believed to have reached equilibrium. The detailed preparation for each setup will be introduced in later sections.
In all simulations, periodic boundary conditions are applied. The time step is set to 1 fs. The rigid water molecules are constrained using the LINCS algorithm of order 4 and iterations 4. Particle meshed Ewald summation (PME) is applied to long-range electrostatics with a Fourier spacing of 0.12 nm. The long-range LJ interaction is gradually switched off from 1.2 nm to 1.4 nm. In the equilibration simulations, a Berendsen thermostat (300 K) and barostat (1.0 bar) are applied with time constants τT = 0.1 ps and τp = 0.5 ps, respectively. In the non-equilibrium simulations for heat transfer calculations, τT is set to 0.5 ps with no pressure coupling. The trajectories and velocities are outputted every 5 ps and the energies are outputted every 0.1 ps for data analysis.
3 Heat transfer between graphene and water
3.1 Heat transfer from directly heated graphene
For simulation setup (a), the initial configuration contains 11![[thin space (1/6-em)]](https://www.rsc.org/images/entities/char_2009.gif) 000 water molecules and a single-layer graphene of 2508 carbons. After equilibration at 300 K, the box size is approximately 8.0 × 8.0 × 5.5 (out-of-plane direction) nm3. The end configuration is named ‘conf-A’. Graphene is then heated to 700 K using a Berendsen thermostat while its surrounding water is maintained at 300 K. After simulating for 1 ns, the system is considered to be in the steady state. We name the end configuration as ‘conf-B’. Using conf-B as a starting point, we run a 500 ps non-equilibrium simulation with neither temperature coupling nor pressure coupling (NVE ensemble).
000 water molecules and a single-layer graphene of 2508 carbons. After equilibration at 300 K, the box size is approximately 8.0 × 8.0 × 5.5 (out-of-plane direction) nm3. The end configuration is named ‘conf-A’. Graphene is then heated to 700 K using a Berendsen thermostat while its surrounding water is maintained at 300 K. After simulating for 1 ns, the system is considered to be in the steady state. We name the end configuration as ‘conf-B’. Using conf-B as a starting point, we run a 500 ps non-equilibrium simulation with neither temperature coupling nor pressure coupling (NVE ensemble).
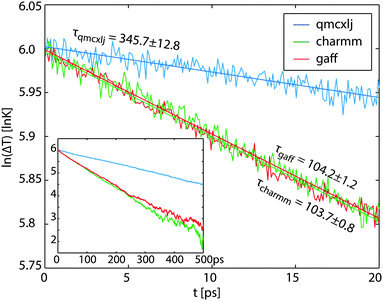
For each force field, the above procedure is repeated. The temperature of graphene drops as simulations go on. Assuming a constant contact resistance RK between water and graphene, using the lumped capacitance method, the following equation can be established based on the heat flow rate from graphene to water
 | (4) |
 | (5) |
 | (6) |
| Force field | τ/(ps) | c C/(J mol−1 K−1) | R DH1K/(m2 K W−1) | U DH2K/(W m−2 K−1) | R DH2K/(m2 K W−1) | U CPK/(W m−2 K−1) | R CPK/(m2 K W−1) | k w/(W m−1 K−1) |
|---|---|---|---|---|---|---|---|---|
| Note: values in the parentheses represent the standard deviations of the last digits. Other related calculation data are given in Tables S1–S3 (ESI). | ||||||||
| qmcxlj | 345(13) | 24.5(10) | 46.9(39) × 10−8 | 2.197(1) × 106 | 45.52(2) × 10−8 | 95.0(3) × 106 | 0.526(2) × 10−8 | 0.95(6) |
| charmm | 104(1) | 24.4(6) | 13.5(5) × 10−8 | 7.851(3) × 106 | 12.73(1) × 10−8 | 141.6(5) × 106 | 0.353(1) × 10−8 | 0.90(5) |
| gaff | 104(1) | 24.3(7) | 13.9(6) × 10−8 | 7.752(3) × 106 | 12.90(1) × 10−8 | 129.1(4) × 106 | 0.387(1) × 10−8 | 0.89(7) |
For convenience, we can rewrite eqn (6) as NCcC = λNwcw. Taking TC and Tw from the simulations and cw as a known constant, the graphene heat capacity cC and the ratio λ are calculated for each simulation and the results of cC are listed in Table 1. Here, we use the molar heat capacity of TIP4P-2005 water cw = 84.71 J mol−1 K−1 reported by Pascal et al.31 To compare, experimental cexpC of graphite at 300 K is evaluated which is about 8.5 J mol−1 K−1.35 However this does not contradict with the larger simulated values. Both simulated cw in the reference and simulated cC in this work are the apparent (classical) molar heat capacities without quantum corrections, since the total conserved energy in the constant energy simulations is calculated as such. This classical cC is close to cexpC at the high temperature limit which is about 25 J mol−1 K−1.35 In other simulation studies, Konatham et al.16 used 23 J mol−1 K−1 for contact resistance calculations. Finally, based on eqn (5) and the heat capacity ratio λ, the contact resistance can be obtained as
 | (7) |
Although the above thermal relaxation method has been used in many studies as an ordinary way to characterize RK,11,16 the temperature drop in graphene may have influences on the RK value. To characterize RK at a constant temperature, we propose to use the source-sink algorithm using a Nosé–Hoover thermostat. The total amount of heat Q transferred from graphene to water can be easily monitored and calculated using eqn (2). For comparison and validation purposes, we choose conf-B as a starting point and run a 500 ps non-equilibrium simulation using a Nosé–Hoover thermostat and no pressure coupling. After the simulations, the contact resistances are calculated using
| RDH2K = 1/UDH2K = 2AΔT/q, | (8) |
The RK values from both methods show good agreement in the range of standard deviations. In ordinary non-equilibrium simulations utilizing Fourier's conduction law, the source and the sink are placed far apart and only the linear temperature profile region is used to calculate the temperature gradient.36 This is because Fourier conduction law applies only to the diffusive transfer regime with a linear temperature profile.37 Close to the thermostats, at distances below a phonon mean free path, the temperature profiles are no longer linear. It is not clear whether this non-diffusive behavior is influenced or even induced by the thermostats. Similarly, in the case of directly heated graphene, it is not known if the thermostat can influence the temperature jump at the boundary and hence the heat transfer rate. By comparing the resistance values calculated using the relaxation method and the source-sink method, we are convinced that the thermostats directly in contact have no major impact on the heat transfer rate. Therefore, the simulations carried out after this subsection use only the source-sink algorithm, due to its advantage in maintaining constant temperature differences.
It is observed from Table 1 that the qmcxlj force field results in a higher contact resistance compared with the other two. The equivalent Kapitza radius rK = RKkw, representing the distance from the interface where the temperature drops the same amount as it drops at the interface under the same heat flux, is about 287 nm in this case, given the experimental heat conductivity of water kexpw = 0.63 W m−1 K−1. This large rK value could cancel much of the advantage of adding carbon structures of sub-micron sizes. As comparison, other literature studies reported a range from 0.76 × 16−8 to 20.0 × 16−8 m2 K−1 W−1 resistance values using various theoretical and experimental techniques.11,13
3.2 Heat transfer across single-layer graphene
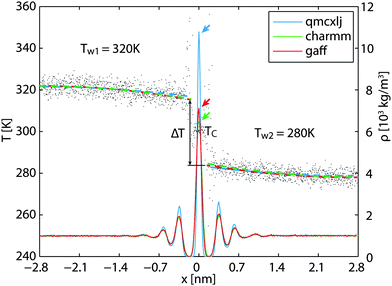
Bearing in mind the ballistic heat transfer characteristics of the nano-scale structures, we realize that the heat transfer across the graphene layer may be different.8 Therefore, to backup and compare the counter-intuitively high resistance values, simulations are carried out using setup b (Fig. 1b). To start, conf-A is duplicated in the out-of-plane direction. The two compartments of water and graphene layers are then coupled at 280 K, 320 K, and 300 K, respectively, at 1.0 bar for 1000 ps as equilibration processes. After equilibration, the thermostat for graphene is removed while the thermostats for water are switched to Nosé–Hoover with no pressure coupling for 500 ps.Using the 500 ps simulation data, a steady state density profile and a temperature profile can be established, as illustrated in Fig. 3. As a finite temperature effect, the density peaks in the low temperature region z > 0 are higher than those on the other side. The qmcxlj gives a higher carbon density peak. This usually means that the qmcxlj graphene is more rigid and might be the reason for its large RK. In Fig. 3, there is an evident temperature jump ΔT near the interface. This jump can be quantified using curve fitting tools. In the liquid region, the phonon mean free paths are very short. Therefore the heat transfer within the liquid region can be considered to be diffusive. Because the thermostat in water removes statistically the same amount of energy per molecule, or, approximately the same amount of energy per unit volume, the temperature profile of water along the out-of-plane direction should be quadratic in the diffusive heat transfer regime. Therefore we use quadratic curves to fit Tw(x) and extrapolate ΔT. In fact, the thermal conductivity of water kw is related to the second derivative of the fitted profile Tw(x) via
 | (9) |
Using ξ and pξ outputted from the simulation and eqn (2), the heat flow Q across the graphene layer over time is computed. The heat flow rate q can then be fitted as the slope of the Q–t curves (Fig. S1 in the ESI†). Finally, the cross-plane contact resistance is calculated according to its definition
| 2RCPK = 1/UCPK = 2AΔT/q, | (10) |
3.3 Phonon equilibration within the carbon structure
The order of the magnitude difference between RDHK (at 700 K) and RCPK (at 300 K) in Table 1 is striking. Additional simulations at TC = 320 K show that RDHK equals to 51.4(14), 16.3(2), and 16.5(2) × 10−8 m2 K W−1, for the three force fields, respectively (see Table S4, ESI†), resulting in even larger resistance values. The major difference lies between the two simulation setups. The same discrepancy was observed by Hu et al.22 By applying a thermostat, the energy is equally pumped to all vibration modes. However, only the low frequency phonons participate in the out-of-plane heat transfer.39 This brings in an additional equilibration process within the carbon structure which acts as an extra resistance. Because the qmcxlj carbon is more rigid, the high frequency phonons are harder to scatter and hence the resistance RK is higher. In fact, the low frequency heat carrying phonons (below 300 cm−1) can transmit through the graphene layer, following a ballistic transfer path.20,21,39,40 To further prove this, we calculated the phonon density of states (DoS) of graphene in both conf-A and conf-B, by additional 20 ps simulations with no temperature or pressure coupling. The DoS of conf-A (Seq) is considered as an equilibrium DoS while the DoS of conf-B (Sneq) is considered as a non-equilibrium DoS. The phonon temperatures as a function of their frequencies can then be expressed as | (11) |
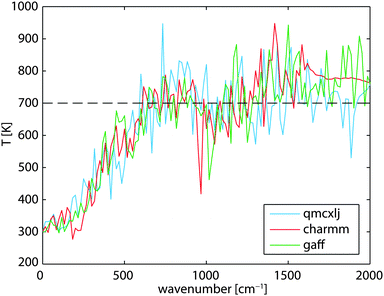 | ||
| Fig. 4 Non-equilibrium phonon temperature of graphene at various frequencies. The mean graphene temperature is at 700 K while its surrounding water is at 300 K. | ||
Indeed, the two systems illustrated in Fig. 1a and b do not have the same heat transfer problem. In fact, both RK values represent reality, with the one from thermal relaxation in analogy to a laser flash experiment while the cross-plane value representing a traditional axial flow method. In carbon structure enhanced composite materials, the liquid matrix material is the major heat carrier. The heat transferred to either graphene or the CNT needs to be transferred back to the matrix material. This is in contrast to systems using carbon micro/nano-fins for chip cooling. Therefore we consider the cross-plane resistance as a more reasonable choice to characterize the contact resistance.
4 Geometry effects on cross-plane heat transfer
Apart from graphene nano-platelets, CNTs are also common additives for heat conduction enhancement. Prior research has shown dramatic geometry effects on another transport property—diffusivity.41 When the confinement size of the CNT is comparable to the water molecules' diameter, water inside may form special structures and behave different from their bulk state.42 This geometry effect may influence the water–carbon heat transfer as well. We hence consider it necessary to check if the CNTs have the same contact resistances as the planar graphenes.CNTs with 10 different diameters are modeled, all in armchair configuration. The CNT(30,30) to CNT(10,10) are 5 nm in length, while the CNT(9,9) to CNT(6,6) are 12 nm in length. These CNTs are solvated in either 7500 or 12![[thin space (1/6-em)]](https://www.rsc.org/images/entities/char_2009.gif) 000 water molecules at 300 K and equilibrated for 1.5–3.0 ns, depending on when the number of water molecules inside the tubes become steady. Then the equilibrium structures along with the water molecules inside are extracted from the end configurations and rotated to align the z-axis of the simulation boxes. These structures are then applied with periodic boundary conditions to form periodic tubes. The top view of the thinnest tubes along with the solvent molecules enclosed is illustrated in Fig. 5. These periodic tubes are then solvated into 4500–9000 water molecules and equilibrated for another 1 ns. The above steps are similar to those used by Pascal et al.42 After this preliminary equilibration, the inside water, the CNTs, and the outside water are coupled at 320 K, 300 K, and 280 K, respectively, for an additional 500 ps equilibration, at a pressure of 1.0 bar. This is to prepare the initial configuration for the heat transfer simulation. Lastly, the temperature coupling is switched to Nosé–Hoover for both water inside and outside the CNT. For the CNT itself, the temperature coupling is switched off. The pressure coupling for the system is also switched off. Simulations of 500 ps long are used to calculate the cross-plane heat transfer.
000 water molecules at 300 K and equilibrated for 1.5–3.0 ns, depending on when the number of water molecules inside the tubes become steady. Then the equilibrium structures along with the water molecules inside are extracted from the end configurations and rotated to align the z-axis of the simulation boxes. These structures are then applied with periodic boundary conditions to form periodic tubes. The top view of the thinnest tubes along with the solvent molecules enclosed is illustrated in Fig. 5. These periodic tubes are then solvated into 4500–9000 water molecules and equilibrated for another 1 ns. The above steps are similar to those used by Pascal et al.42 After this preliminary equilibration, the inside water, the CNTs, and the outside water are coupled at 320 K, 300 K, and 280 K, respectively, for an additional 500 ps equilibration, at a pressure of 1.0 bar. This is to prepare the initial configuration for the heat transfer simulation. Lastly, the temperature coupling is switched to Nosé–Hoover for both water inside and outside the CNT. For the CNT itself, the temperature coupling is switched off. The pressure coupling for the system is also switched off. Simulations of 500 ps long are used to calculate the cross-plane heat transfer.
4.1 Equilibrium structures and density profiles
The equilibrium structures strongly depend on the CNT diameter. In CNT(6,6) and CNT(7,7), the narrow tube diameters only allow water molecules to align on the central axis. In CNT(8,8) and CNT(9,9), the diameters are larger allowing water molecules to form a ‘ring’ structure, resulting in a larger in-tube water number density. The number of confined water molecules per unit length of CNT N/l is given in Table 2. Also given in the table are the tube diameters d and the effective density ρeff of the confined water. This effective density is calculated based on the effective diameter defined as , where σCO = 0.34352 nm is the radius term between carbon and oxygen atoms in the Lennard-Jones potential. It is to be noted that the effective density of water in CNT(8,8) is higher than the bulk value of 997 kg m−3.
| CNT | d/(nm) | N/l/(nm−1) | ρ eff/(kg m−3) | U CP/(W m−2 K−1) |
|---|---|---|---|---|
| a Water bulk density at 300 K. | ||||
| Graphene | +∞ | +∞ | 997a | 95.0(3) × 106 |
| (30,30) | 4.029(5) | 349.0(25) | 1001(8) | 91.0(10) × 106 |
| (20,20) | 2.693(3) | 139.3(13) | 997(10) | 84.9(7) × 106 |
| (17,17) | 2.288(1) | 93.7(13) | 987(14) | 79.2(9) × 106 |
| (14,14) | 1.884(0) | 58.0(10) | 983(16) | 71.3(10) × 106 |
| (12,12) | 1.615(1) | 38.6(7) | 972(18) | 66.2(13) × 106 |
| (10,10) | 1.347(0) | 23.5(4) | 966(18) | 54.7(14) × 106 |
| (9,9) | 1.210(0) | 17.4(2) | 977(9) | 9.4(11) × 106 |
| (8,8) | 1.076(0) | 13.8(1) | 1101(12) | 26.0(11) × 106 |
| (7,7) | 0.941(0) | 4.8(2) | 588(20) | 10.5(4) × 106 |
| (6,6) | 0.806(1) | 3.6(0) | 785(11) | 8.0(7) × 106 |
The density profile in the radial direction is plotted in Fig. 6. The density peaks roughly sit at the same positions in all cases. In general, smaller tubes give rise to more evident density peaks. In particular, CNT(6,6) has a strong primary peak and CNT(10,10) has a strong secondary peak. The steady state temperature profiles in the radial direction resemble those plotted in Fig. 3, with quadratic temperature profiles being on the left (inner) side of the CNT layers and temperature jumps on both sides of the CNTs.
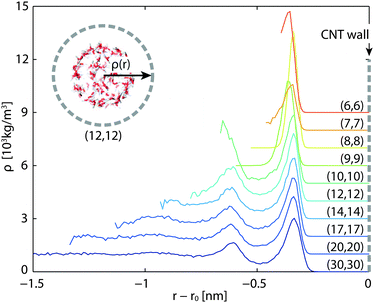 | ||
| Fig. 6 Density profiles of in-tube water in the radial direction. The densities are shifted 1000 kg m−3 each upward. Horizontal axis labels the radial position relative to the CNT wall. | ||
4.2 Heat transfer coefficient
The cross-plane water–water heat transfer coefficients UCP are calculated in a similar way as described in Section 3.2 and are plotted in Fig. 7 and listed in Table 2. As the diameter decreases, the heat transfer coefficient also decreases, but not monotonically. We see a dramatic decrease in the CNT(9,9) case, and a moderate increase in CNT(8,8).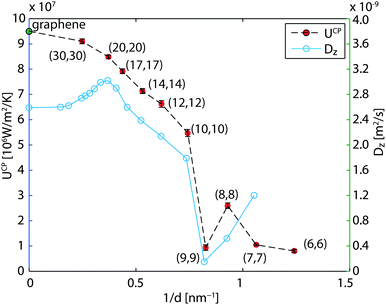 | ||
| Fig. 7 Heat transfer coefficients across the CNTs and axial diffusion coefficient41 of confined water versus reciprocal diameter. In the limit of the infinite diameter, the result of graphene is marked. | ||
The water in CNT(9,9) in many studies is believed to be ice-like, which may help explain the low heat transfer coefficient. In the literature, the ice-like structure is related to the stronger hydrogen bonds43 and its enthalpy stabled structure42 which leads to a very low spatial diffusivity.41,43 The ice-like structure inside the CNT(9,9) results in a phonon mode mismatch to the liquid water outside and hampers the heat transfer,22 in analogy to the graphene–water heat transfer described in Section 3.1. To get more details of the fundamental differences between water confined in CNT(9,9) and CNT(10,10), we further calculated the phonon density of state of water in both cases. The results are plotted in Fig. 8 with reference to bulk liquid water and solid ice-Ih. The water in CNT(10,10) is indeed liquid-like. The flatter curve indicates more phonon scattering and the non-zero spectral density at zero frequency shows that the molecules are diffusive.44 On the other hand, the water confined in CNT(9,9) is almost non-diffusive. The phonons are less scattered at lower frequencies. At a wavenumber above 170 cm−1, there are some red shifts of the spectral peaks compared to the bulk solid curve and the peak heights are lower. Therefore, although the water is solid-like, it should be distinguished from the solid ice Ih state. In the case of CNT(8,8), the heat transfer coefficient is higher than both of its neighbours. Compared with CNT(9,9), the single-file diffusion41 may allow the water inside to couple with some low frequency phonon modes for a more efficient heat transfer. Here we have noticed an interesting correlation between UCP and the axial diffusion coefficient of confined water41 from CNT(20,20) to CNT(8,8) according to Fig. 7. However, the correlation breaks in the case of CNT(7,7) and the heat transfer rate seems to drop alongside the effective density (47% vs. 60% drop in Table 2). This correlation is not surprising considering that the major component of heat transfer, the kinetic energy transfer, scales with the number density of interacting molecules.45
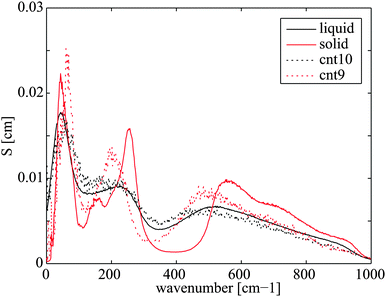 | ||
| Fig. 8 Phonon density of state of water confined in CNT(10,10) and CNT(9,9) with reference to bulk liquid water and overheated ice-Ih, both at 300 K. | ||
5 Discussion
The results presented in Section 3 show that the heat transfer from graphene to water is not simply dependent on the overall temperature of graphene, but also depends on the different mode contributions to the temperature—the Fourier transformed kinetic energy in the form of phonon temperatures. This is in line with the ballistic heat transfer mechanisms often observed in nano-scale systems.8 In the use of graphene or CNTs as additives for heat conduction enhancement, the heat first flows into the carbon structure and takes the advantage of the fast thermal dissipation of the carbon before the heat is conducted out. In this process, the phonons as heat carriers travel through the carbon structure. Although the overall contact resistance between carbon and water is quite high, the phonon transmission coefficient for low frequency phonons is high, allowing fast thermal equilibration of low frequency phonons to the environment.39 According to Sääskilahti et al., the low frequency phonons are also the main heat carriers within the CNTs and have much higher spectral thermal conductivity.46 In this way, graphene or CNT can still work as a good additive for the PCMs. The high overall carbon–water resistance RDHK underestimates the heat carrying capability of the low frequency phonons while the cross-plane resistance RCPK characterizes the resistance for low frequency heat carrying phonons. In fact, direct simulations of mixed graphene platelets and PCM would not be observed with any substantial gain in conductivity if the Kapitza radius rK at around 100 nm is used (Section 3.1). This is in contrast to the work of Huang et al. where 30% gain is observed using graphene nano-platelets as additives.47 Therefore, we recommend to use the cross-plane RCPK as the resistance for estimating the effective conductivity of the carbon–PCM composites, when an effective medium approach is applied.11Based on the results of Section 4, the nano-scale confinement has obviously altered the properties of water inside. Although the heat transfer rate trends lower for smaller sized tubes, the trend is not monotonic (Fig. 7). At diameters less than 1.2 nm, the properties of water confined become case-specific. It is noted that in these narrow tube cases, the heat transfer coefficient has decreased one order of magnitude. If converted to the Kapitza resistance using RK = 1/(2U), the values correspond to an increase from the graphene case of 0.5 × 10⁻⁸ m2 K−1 W−1 to the CNT(6,6) case of 6.2 × 10⁻⁸ m2 K−1 W−1. In this argument, the smaller sized tubes may be unfavorable to be used as additives for heat transfer enhancement if their lengths are the same.
6 Conclusions
Using the molecular dynamics simulation method and advanced data analyzing techniques, the cross-plane heat transfer of single-layer carbon structures submerged in liquid water is studied in depth. In this study, we found that the heat transfer kinetics across graphene from water to water is much faster than the heat transfer from graphene to their surrounding water molecules. The dramatic difference lies within the non-diffusive nature of heat transfer in nano-scale systems. Both cross-plane and out-of-plane systems are studied quantitatively and characterized using Kapitza resistance. We showed that the cross-plane resistance RCPK represents better the resistance for low frequency phonons, which are the major heat carriers. Therefore the RCPK values are more favorable to be used in effective medium approaches for the effective conductivity calculations of composites. The research is further extended to CNT–water systems to include the size effect of wrapped graphene layers. We found that the heat transfer coefficients decrease with decreasing diameter, but not monotonically. The very low heat transfer coefficient across CNT(9,9) is found to be related to the water confined forming an ice-like structure. The results obtained in this research provided a deeper understanding of the nano-scale heat transfer of carbon structures submerged in water and used as conductivity enhancement additives, and provided valuable data for carbon–PCM composite material designs.Acknowledgements
The research leading to these results has received funding from the European Community's Seventh Framework Programme (FP7/2007–2013) under grant agreement 296006.References
- L. Fan and J. Khodadadi, Renewable Sustainable Energy Rev., 2011, 15, 24–46 CrossRef CAS.
- F. Yavari, H. R. Fard, K. Pashayi, M. A. Rafiee, A. Zamiri, Z. Yu, R. Ozisik, T. Borca-Tasciuc and N. Koratkar, J. Phys. Chem. C, 2011, 115, 8753–8758 CAS.
- W. Yu, H. Xie, X. Wang and X. Wang, Phys. Lett. A, 2011, 375, 1323–1328 CrossRef CAS.
- M. Li, Appl. Energy, 2013, 106, 25–30 CrossRef CAS.
- L.-W. Fan, X. Fang, X. Wang, Y. Zeng, Y.-Q. Xiao, Z.-T. Yu, X. Xu, Y.-C. Hu and K.-F. Cen, Appl. Energy, 2013, 110, 163–172 CrossRef CAS.
- W. Alshaer, E. P. del Barrio, M. Rady, O. Abdellatif and S. Nada, Int. J. Heat Mass Transfer, 2013, 1, 297–307 Search PubMed.
- J.-N. Shi, M.-D. Ger, Y.-M. Liu, Y.-C. Fan, N.-T. Wen, C.-K. Lin and N.-W. Pu, Carbon, 2013, 51, 365–372 CrossRef CAS.
- A. M. Marconnet, M. A. Panzer and K. E. Goodson, Rev. Mod. Phys., 2013, 85, 1295 CrossRef CAS.
- Y.-R. Huang, P.-H. Chuang and C.-L. Chen, Int. J. Heat Mass Transfer, 2015, 91, 45–51 CrossRef CAS.
- E. T. Swartz and R. O. Pohl, Rev. Mod. Phys., 1989, 61, 605 CrossRef.
- V. Unnikrishnan, D. Banerjee and J. Reddy, Int. J. Therm. Sci., 2008, 47, 1602–1609 CrossRef CAS.
- S. T. Huxtable, D. G. Cahill, S. Shenogin, L. Xue, R. Ozisik, P. Barone, M. Usrey, M. S. Strano, G. Siddons and M. Shim, et al. , Nat. Mater., 2003, 2, 731–734 CrossRef CAS PubMed.
- A. A. Balandin, SPIE NanoScience + Engineering, 2011, p. 810107 Search PubMed.
- N. Singh and D. Banerjee, 2010 14th International Heat Transfer Conference, 2010, pp. 427–431.
- H. Babaei, P. Keblinski and J. Khodadadi, Int. J. Heat Mass Transfer, 2013, 58, 209–216 CrossRef CAS.
- D. Konatham, D. Papavassiliou and A. Striolo, Chem. Phys. Lett., 2012, 527, 47–50 CrossRef CAS.
- N. Singh, V. Unnikrishnan, D. Banerjee and J. Reddy, Int. J. Comput. Methods Eng. Sci. Mech., 2011, 12, 254–260 CrossRef CAS.
- S. Maruyama, Y. Igarashi, Y. Taniguchi and Y. Shibuta, Proceedings of the First International Symposium on Micro and Nano Technology, 2004.
- A. A. Balandin and D. L. Nika, Mater. Today, 2012, 15, 266–275 CrossRef CAS.
- L. Chen, Z. Huang and S. Kumar, Appl. Phys. Lett., 2013, 103, 123110 CrossRef.
- M. Shen and P. Keblinski, J. Appl. Phys., 2014, 115, 144310 CrossRef.
- L. Hu, T. Desai and P. Keblinski, Phys. Rev. B: Condens. Matter Mater. Phys., 2011, 83, 195423 CrossRef.
- T. A. Pascal, N. Karasawa and W. A. Goddard III, J. Chem. Phys., 2010, 133, 134114 CrossRef PubMed.
- M. Esposito and T. Monnai, J. Phys. Chem. B, 2010, 115, 5144–5147 CrossRef PubMed.
- B. Hess, C. Kutzner, D. van der Spoel and E. Lindahl, J. Chem. Theory Comput., 2008, 4, 435–447 CrossRef CAS PubMed.
- H. J. Berendsen, J. P. M. Postma, W. F. van Gunsteren, A. DiNola and J. Haak, J. Chem. Phys., 1984, 81, 3684 CrossRef CAS.
- T. A. Pascal, N. Karasawa and W. A. Goddard III, J. Chem. Phys., 2010, 133, 134114 CrossRef PubMed.
- A. D. MacKerell Jr., D. Bashford, M. Bellott, R. L. Dunbrack, J. D. Evanseck, M. J. Field, S. Fischer, J. Gao, H. Guo, S. Ha, D. Joseph-McCarthy, L. Kuchnir, K. Kuczera, F. T. K. Lau, C. Mattos, S. Michnick, T. Ngo, D. T. Nguyen, B. Prodhom, W. E. Reiher, B. Roux, M. Schlenkrich, J. C. Smith, R. Stote, J. Straub, M. Watanabe, J. Wiórkiewicz-Kuczera, D. Yin and M. Karplus, J. Phys. Chem. B, 1998, 102, 3586–3616 CrossRef PubMed.
- J. Wang, R. M. Wolf, J. W. Caldwell, P. A. Kollman and D. A. Case, J. Comput. Chem., 2004, 25, 1157–1174 CrossRef CAS PubMed.
- J. L. Abascal and C. Vega, J. Chem. Phys., 2005, 123, 234505 CrossRef CAS PubMed.
- T. A. Pascal, D. Schärf, Y. Jung and T. D. Kühne, J. Chem. Phys., 2012, 137, 244507 CrossRef PubMed.
- E. Sanz, C. Vega, J. R. Espinosa, R. Caballero-Bernal, J. L. F. Abascal and C. Valeriani, J. Am. Chem. Soc., 2013, 135, 15008–15017 CrossRef CAS PubMed.
- J. Benet, L. G. MacDowell and E. Sanz, Phys. Chem. Chem. Phys., 2014, 16, 22159–22166 RSC.
- Y. Wu and N. Aluru, J. Phys. Chem. B, 2013, 117, 8802–8813 CrossRef CAS PubMed.
- E. Pop, V. Varshney and A. K. Roy, MRS Bull., 2012, 37, 1273–1281 CrossRef CAS.
- J. Shiomi, Annu. Rev. Heat Transfer, 2014, 17, 177–203 CrossRef.
- M. Wang, N. Yang and Z.-Y. Guo, J. Appl. Phys., 2011, 110, 064310 CrossRef.
- Y. Mao and Y. Zhang, Chem. Phys. Lett., 2012, 542, 37–41 CrossRef CAS.
- M. Shen, P. K. Schelling and P. Keblinski, Phys. Rev. B: Condens. Matter Mater. Phys., 2013, 88, 045444 CrossRef.
- P. Keblinski, S. Phillpot, S. Choi and J. Eastman, Int. J. Heat Mass Transfer, 2002, 45, 855–863 CrossRef CAS.
- A. Barati Farimani and N. Aluru, J. Phys. Chem. B, 2011, 115, 12145–12149 CrossRef CAS PubMed.
- T. A. Pascal, W. A. Goddard and Y. Jung, Proc. Natl. Acad. Sci. U. S. A., 2011, 108, 11794–11798 CrossRef CAS PubMed.
- L. B. Da Silva, J. Nanostruct. Chem., 2014, 4, 1–5 Search PubMed.
- T. A. Pascal, S.-T. Lin and W. A. Goddard III, Phys. Chem. Chem. Phys., 2011, 13, 169–181 RSC.
- G. Bird, Molecular Gas Dynamics and the Direct Simulation of Gas Flows, Clarendon Press, 1994 Search PubMed.
- K. Sääskilahti, J. Oksanen, S. Volz and J. Tulkki, Phys. Rev. B: Condens. Matter Mater. Phys., 2015, 91, 115426 CrossRef.
- X. Huang, W. Xia and R. Zou, J. Mater. Chem. A, 2014, 2, 19963–19968 CAS.
Footnote |
| † Electronic supplementary information (ESI) available. See DOI: 10.1039/c5cp07715j |
| This journal is © the Owner Societies 2016 |

