Kinetic isotope effects for fast deuterium and proton exchange rates
Received
3rd December 2015
, Accepted 8th March 2016
First published on 9th March 2016
Abstract
By monitoring the effect of deuterium decoupling on the decay of transverse 15N magnetization in D–15N spin pairs during multiple-refocusing echo sequences, we have determined fast D–D exchange rates kD and compared them with fast H–H exchange rates kH in tryptophan to determine the kinetic isotope effect as a function of pH and temperature.
Introduction
In the parlance of magnetic resonance, chemical exchange is a process where a nucleus undergoes a change of its environment.1 The determination of the exchange rates of labile protons can provide valuable insight into both structural and dynamic aspects of a wide range of molecules,2–4 such as the opening of base-pairs in nucleic acids and protection factors in protein–ligand complexes.5,6 In this paper, we shall focus on measurements of D–D exchange rates kD and their comparison with H–H exchange rates kH in tryptophan.7 The knowledge of kinetic isotope effects, i.e., of the ratio kH/kD that expresses the reduction of D–D exchange rates kD compared to H–H exchange rates kH, may contribute to the characterization of reaction mechanisms.8,9 The kinetic isotope effect can give insight into the stability of hydrogen-bonded secondary structures in biomolecules.10 In this work, we shall consider exchange processes involving labile DN deuterons and HN protons that are covalently bound to the nitrogen atom in the indole ring of tryptophan.†
Experimental section
We have adapted to the case of deuterium (spin S = 1) a scheme that was originally designed to determine fast exchange rates of protons7,11,12 (spin S = 1/2) by monitoring the effect of deuterium decoupling on the decay of transverse 15N magnetization during multiple-refocusing sequences (CPMG).‡13,14 The modified pulse sequence is shown in Fig. 1. The scheme requires isotopic enrichment with 15N and 13C, since the 15N coherence is excited by transfer from neighboring protons through two successive INEPT transfer steps via1J(13C,1H) and 1J(15N,13C). The decay of the 15N coherence is monitored indirectly after transferring the coherence back to the proton of origin. The 15N,13C-labelled isomers of tryptophan are dissolved in either D2O or H2O to determine the kinetic isotope effect kH/kD of the following reactions:| | | N–D + D′+ → N−D′ + D+ rate kD | (1) |
| | | N–H + H′+ → N−H′ + H+ rate kH | (2) |
where kD and kH are the pseudo-first order rate constants since the concentration of the solvent D2O or H2O, which is the source of the incoming D′+ or H′+ ions, is constant and much higher than the concentration of the solute.§
 |
| | Fig. 1 (left) Pulse sequence for measurements of the indole D–D exchange rate kD. The π/2 and π pulses are represented by narrow filled and wide open rectangles respectively while wide open rectangles depict decoupling sequences. All phases are along the x-axis unless indicated otherwise. The phase cycling is: Φ1 = 16(y), 16(−y); Φ2 = x, −x; Φ3 = 2(x), 2(−x); Φ4 = 4(x), 4(−x); Φ5 = 8(x), 8(−x) and the receiver phase is Φrec = x, −x, −x, x, 2(−x, x, x, −x), x, −x, −x, x, −x, x, x, −x, 2(x, −x, −x, x), −x, x, x, −x. The delays are: τ1 = 1/(4JCH) = 1.56 ms and τ2 = 1/(4JCN) = 16 ms. The gradient pulses G that bracket π-pulses at positions 1 and 6 are of equal strength and polarity to cancel effects of pulse imperfections. The gradients applied at positions 2, 3, 4 and 5 are used to purge any undesired transverse magnetization, as the magnetization of interest is aligned with z during the corresponding intervals. (top right) Proton signals of tryptophan at pD 8.7 and T = 300 K. The red lines correspond to experiment A without decoupling while the green lines stem from experiment B with deuterium decoupling. (top) IA/IB = 0.59 with τ = 10.6 ms and nCPMG = 2. (bottom) IA/IB = 0.78 with τ = 5.3 ms and nCPMG = 4. (bottom right) Consecutive coherence transfer steps from the blue 1H to the red 15N via13C and back in 2D, 13C, and 15N labelled tryptophan. | |
The first and last parts of the pulse sequence in Fig. 1 lead to a transfer of the magnetization from the blue non-exchanging ‘spy’ proton to 15N and back, via the adjacent 13C nuclei, by two successive pulse sequences for Insensitive Nuclei Enhanced by Polarization Transfer (INEPT).15 The first INEPT sequence transforms longitudinal proton magnetization Hz into two-spin order 2HzCz. The second INEPT sequence converts 2HzCz into 2CzNz. WALTZ-16 proton decoupling16 is used to suppress the evolution under 1J(1H, 13C) during the intervals of the INEPT sequences where the coherence is transferred from 13C to 15N. The antiphase coherence 2NyCz excited at the beginning of the multiple-refocusing CPMG interval decays in the course of this pulse train. At this point, two variants (A and B) of the experiments must be performed. In experiment B, continuous wave (CW) deuterium decoupling is applied during the CPMG pulse train, while in experiment A the deuterium irradiation is applied for the same duration but prior to the CPMG pulse train in order to avoid differences in temperature.
The remaining coherence 2NyCz is transferred back to the ‘spy’ proton for detection. The intensity of the resulting peak near 7.22 ppm in the proton spectra is proportional to the magnitude of the nitrogen 2NyCz coherence that remains at the end of the CPMG interval. In order to extract kD one can determine the ratio IA/IB of the peak intensities recorded without decoupling during the CPMG pulse train (experiment A) and with deuterium decoupling (experiment B). The delay τ is defined as one-half of the interval between consecutive nitrogen π-pulses. The τ delays need to be long enough to ensure that the ratio IA/IB is significantly different from 1. Typically, values of τ = 10.6 or 21.2 ms have been used. The scalar coupling is 1J(15N,2D) = 15.4 Hz, smaller than 1J(15N,1H) = 98.6 Hz by the factor γ(2D)/γ(1H) ≈ 0.15, but 1J(15N,2D) is still large enough to act as an efficient vehicle of scalar relaxation.
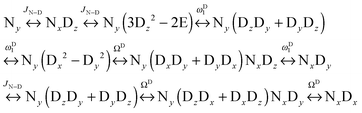
We can construct the matrix representations of the 4 × 9 = 36 Cartesian operators that span a complete basis set for a system comprising a 15N nucleus with spin I = 1/2 and a 2D nucleus with spin S = 1.17 When a CPMG multiple echo sequence is applied to the 15N spins with an on-resonance rf field at the chemical shift of 15N, while deuterium decoupling is applied with an amplitude ωD1 at an offset ΩD with respect to the chemical shift of 2D. The rf pulses applied to the 15N spins are considered to be ideal. Starting from an operator Ny, coherent evolution leads to the following terms:18
| |  | (3) |
Therefore the dimension of the basis set can be reduced from 36, leaving only 9 terms:
| | 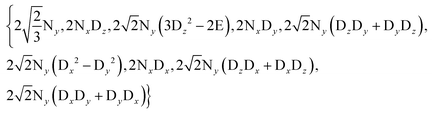 | (4) |
Note that in the experiments of
Fig. 1, the single-quantum coherence at the beginning of the CPMG period is an antiphase operator 2N
yC
z. Since the presence of the C
z term affects the signal intensities in experiments A and B equally, this C
z term can be omitted without loss of generality. The solution of the Liouville-von Neumann equation
19 up to the
nth echo is:
| | | σ(t = 2nτ) = [exp(−Lτ)·RN·exp(−Lτ)]nσ(0) | (5) |
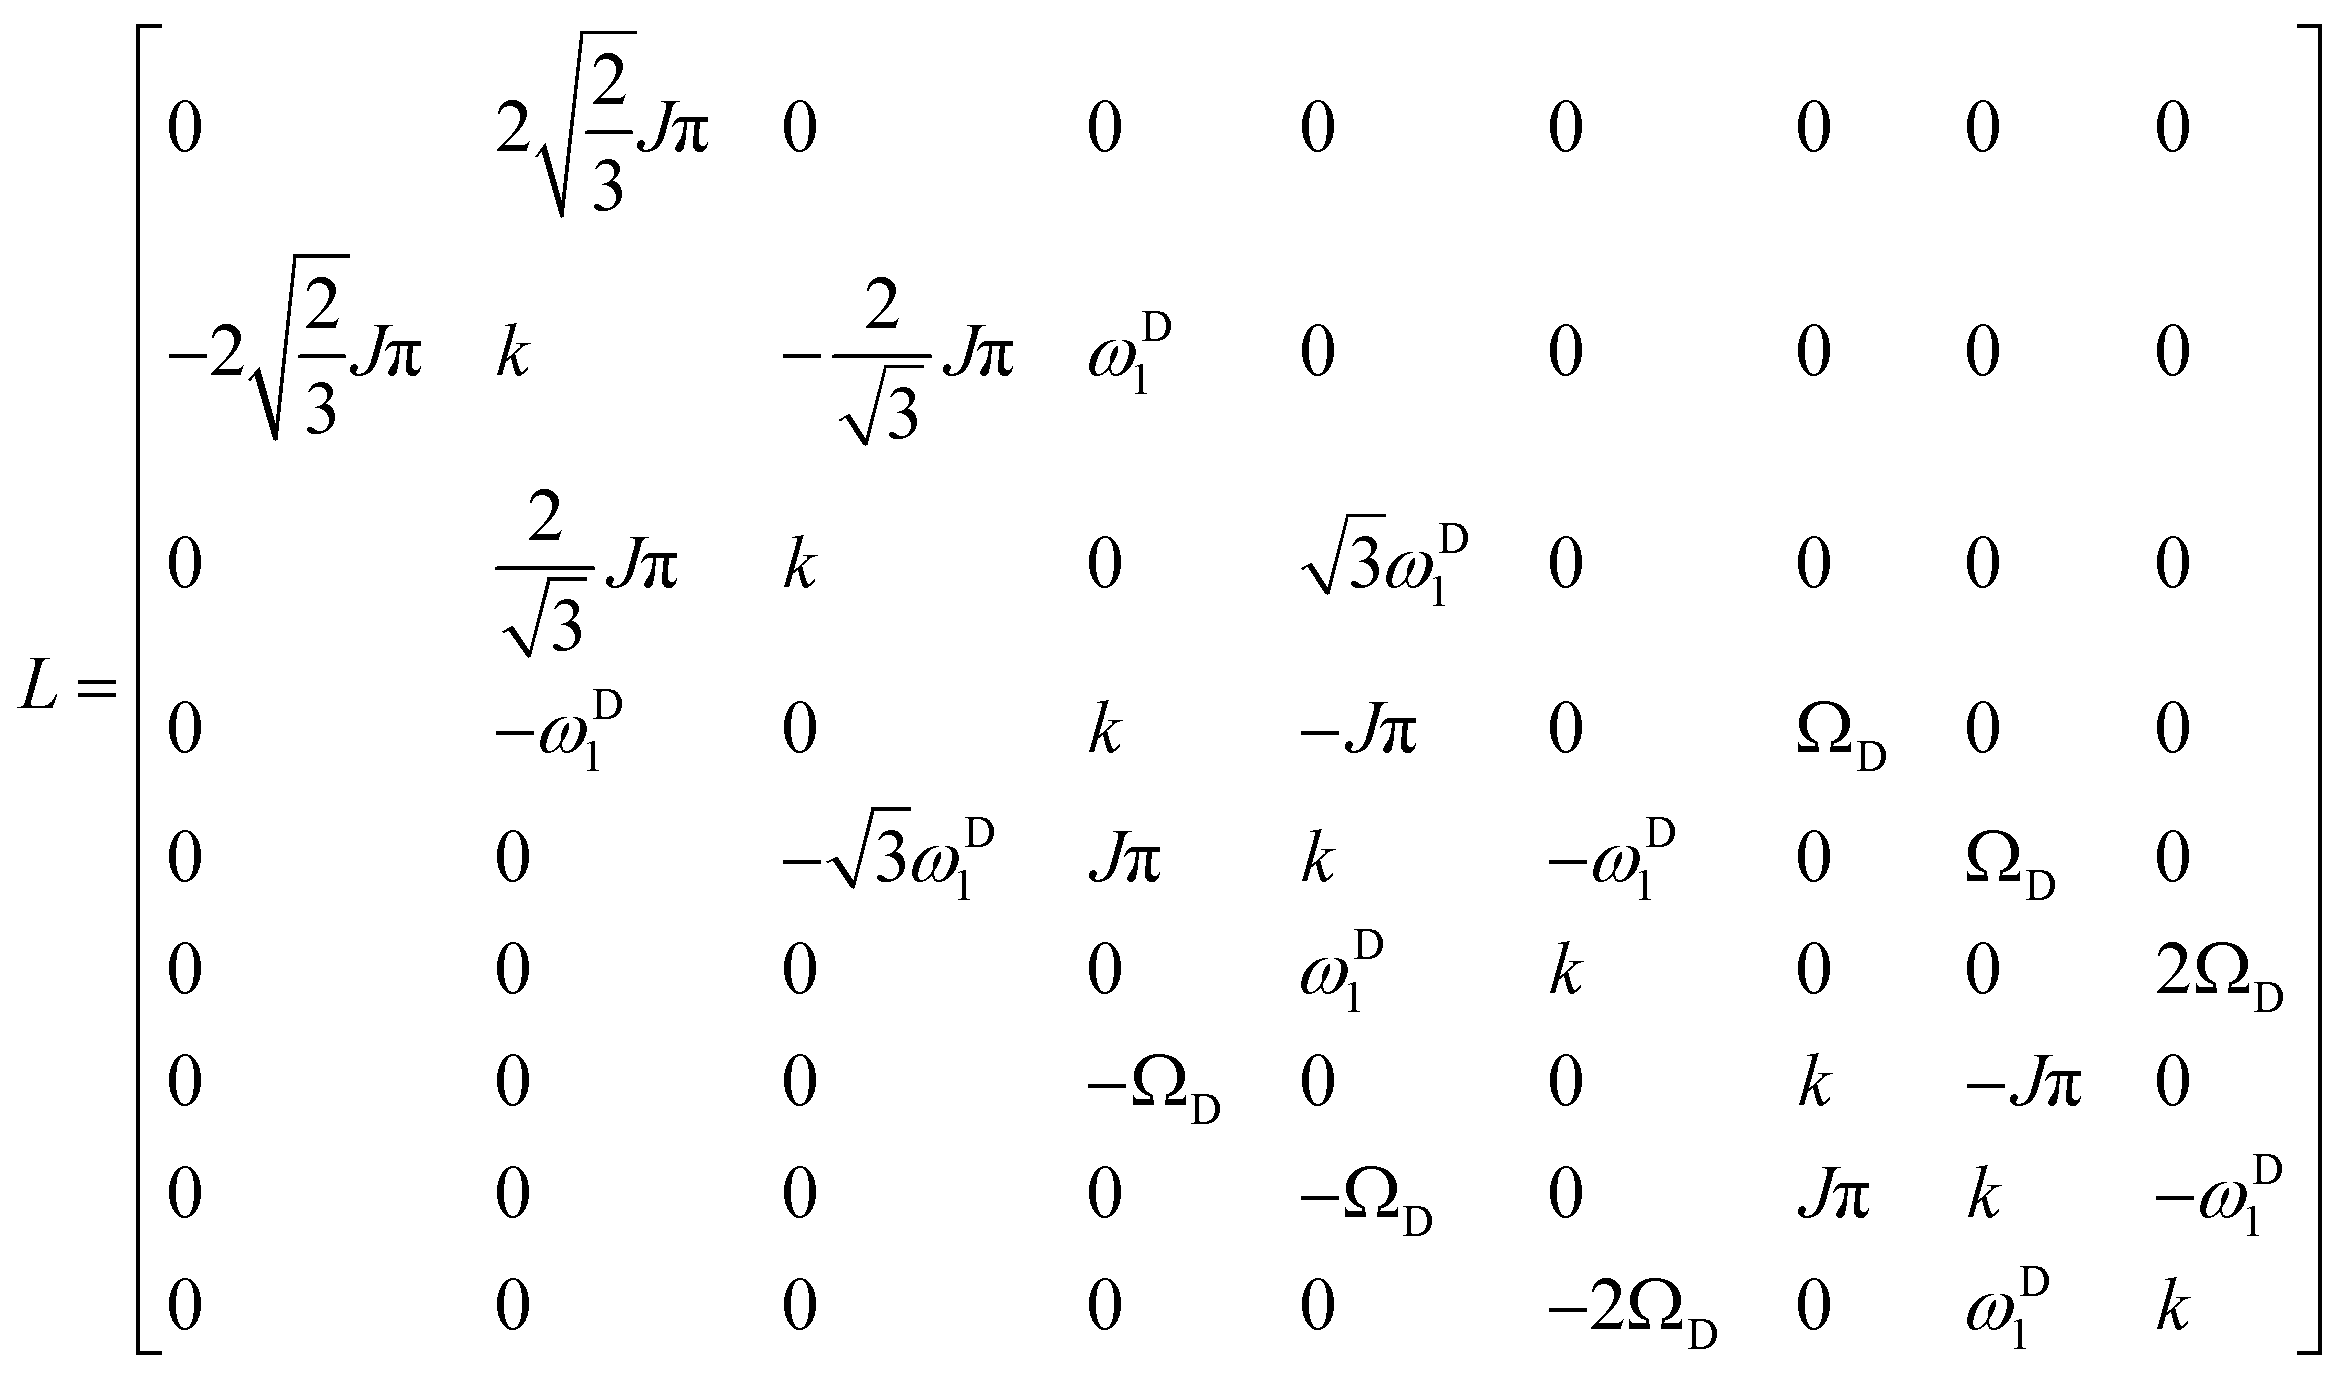
The matrix representation of the Liouvillian
L in the basis of
eqn (4) is:
| |  | (6) |
The matrix representation of
RN represents a π
y pulse applied to the
15N spins:
| |  | (7) |
If the
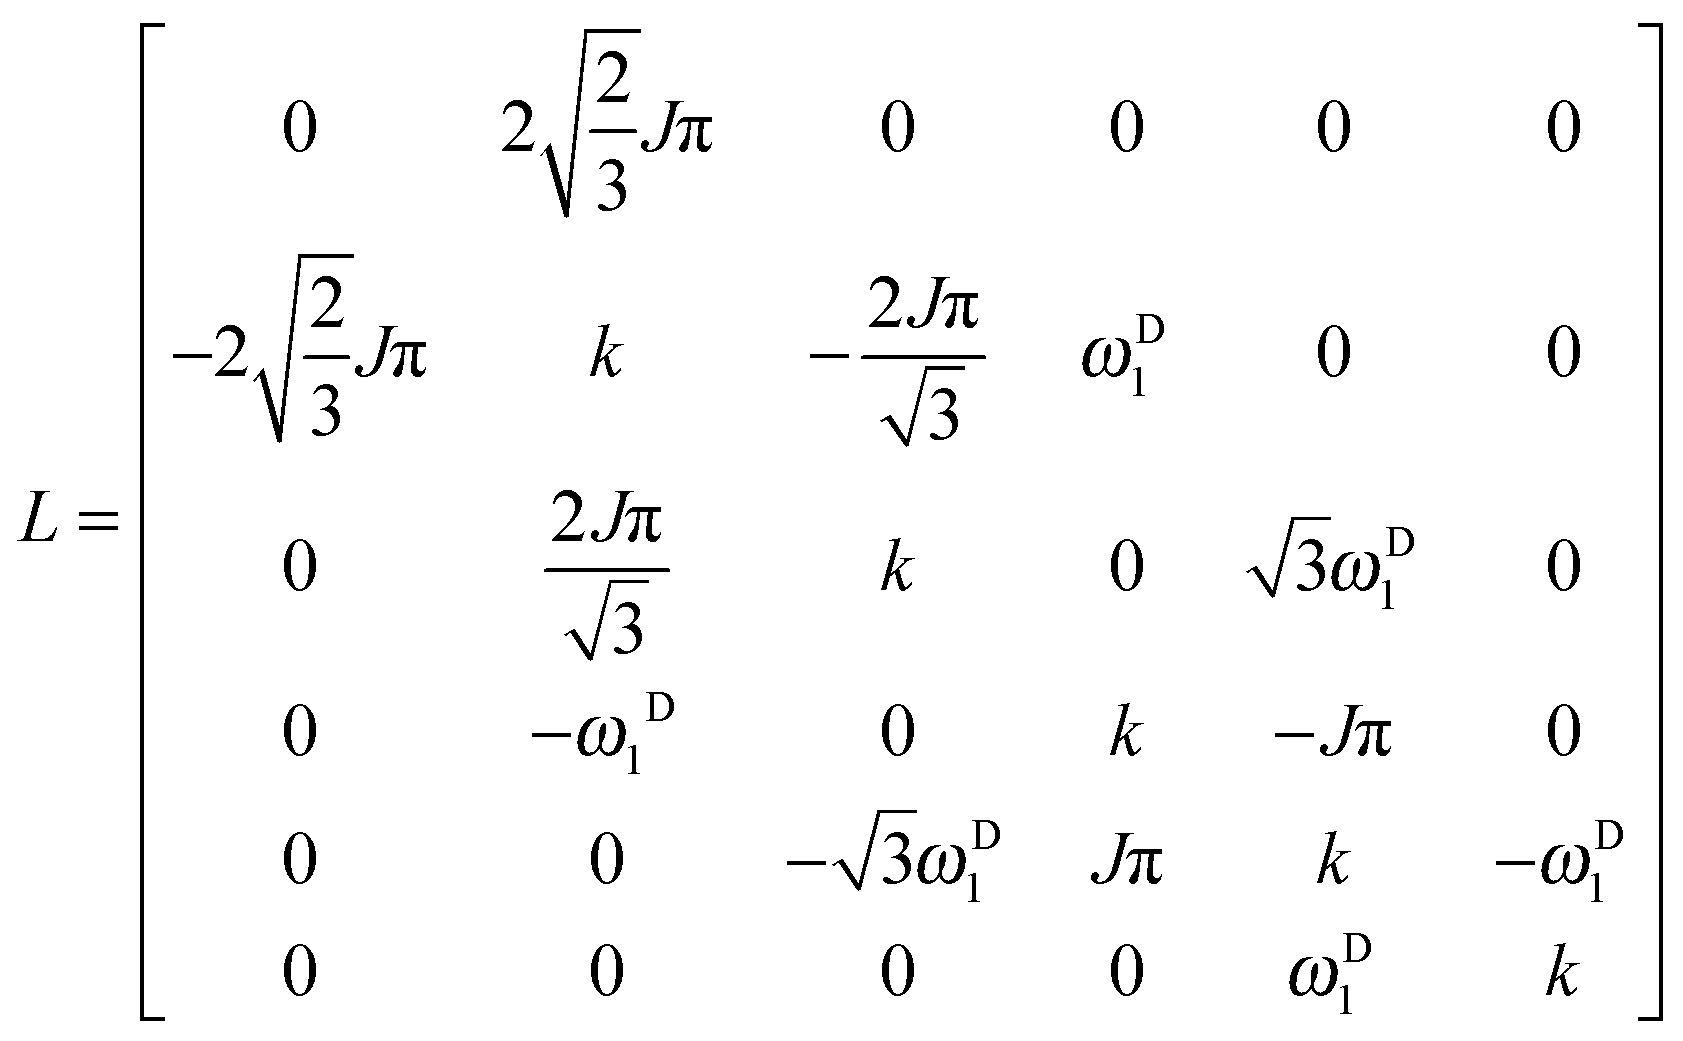
rf field for deuterium decoupling is applied on resonance, the evolution of the density operator can be described in a simplified base comprising only 6 product operators:
| |  | (8) |
In this reduced base, the matrix representation of the Liouvillian is:
| |  | (9) |
For the π
y pulse applied to the
15N spins one obtains in this reduced base:
| |  | (10) |
In the experiment of
Fig. 1, the amplitude
νD1 of the continuous-wave
rf field applied to the deuterium spins should be chosen carefully. The higher the
rf amplitude
νD1, the more efficient the decoupling, although one should avoid excessive heating. On the other hand, if the
rf amplitude is too low, the ratio
IA/
IB is affected in a manner that can lead to erroneous measurements of the exchange rates. By way of illustration, at pD 7.7 and
T = 300 K, where the exchange rate is very low (see
Table 1), the ratio
IA/
IB has been determined as a function of the
rf amplitude for
τ = 10.6 ms and
nCPMG = 2. For these experimental conditions, the amplitude can be attenuated as low as
νD1 =
ωD1/(2π) = 100 Hz without affecting significantly the ratio
IA/
IB. For lower amplitudes the ratio is very sensitive to the exact amplitude. An
rf field with an amplitude
νD1 = 3 kHz seems to be a safe value regardless of the exchange rates and can be used for all experiments. The ratio
IA/
IB also depends on the offset
ΩD of the
rf carrier with respect to the exchanging
2D spins, since decoupling becomes less efficient when the carrier is off-resonance. The ratio
IA/
IB has the smallest value when the carrier coincides with the chemical shift of the exchanging
2D spins,
i.e., when
ΩD = 0 (
Fig. 2). The heteronuclear scalar coupling constant
1J(
15N,
2H) = 15.4 Hz at pD 7.7 was determined experimentally from the doublet in the
2H spectrum and corresponds to the expected value
1J(
15N,
2H) =
1J(
15N,
1H)
γ(
2H)/
γ(
1H) with
1J(
15N,
1H) = 98.6 Hz.
Table 1 Pseudo first-order exchange rate constants kD [s−1] without corrections for contributions due to quadrupolar relaxation as a function of temperature and pD
| pD |
290 K |
pD |
300 K |
pD |
310 K |
pD |
320 K |
| 1.05 |
273 ± 21 |
1.05 |
491 ±63 |
1.05 |
697 ± 110 |
1.05 |
1670 ± 250 |
| 1.49 |
56.9 ± 11 |
1.49 |
65.9± 13 |
1.49 |
81.6 ± 17 |
1.49 |
91.6 ± 19 |
| 2.18 |
49.7 ± 4.8 |
2.18 |
47.9 ± 4.2 |
2.18 |
57.6 ± 11 |
2.18 |
61.8 ± 8.7 |
| 3.29 |
39.1 ± 1.9 |
3.29 |
30.2 ± 1.8 |
3.29 |
26.3 ± 1.5 |
3.29 |
23.6 ± 0.7 |
| 4.78 |
36.2 ± 3.0 |
4.78 |
26.2 ± 3.3 |
4.78 |
20.9 ± 2.9 |
4.78 |
16.5 ± 3.2 |
| 5.98 |
37.1 ± 3.1 |
5.98 |
27.1 ± 1.9 |
5.98 |
22.9 ± 1.9 |
5.98 |
18.7 ± 1.4 |
| 6.43 |
38.7 ± 5.7 |
6.43 |
28.6 ± 4.2 |
6.43 |
23.7 ± 3.1 |
6.43 |
19.4 ± 2.6 |
| 7.97 |
41.4 ± 6.4 |
7.69 |
31.6 ± 4.3 |
7.41 |
27.2 ± 3.4 |
7.13 |
23.8 ± 3.1 |
| 9.11 |
82.4 ± 15 |
8.83 |
88.1 ± 8.2 |
8.55 |
110 ± 11 |
8.27 |
182 ± 31 |
| 9.68 |
121 ± 13 |
9.40 |
328 ± 17 |
9.12 |
507 ± 24 |
8.84 |
860 ± 49 |
| 10.8 |
831 ± 42 |
10.52 |
1546 ± 90 |
10.24 |
2670 ± 330 |
9.96 |
4330 ± 380 |
| 12.1 |
3220 ± 840 |
11.82 |
8060 ± 2200 |
11.54 |
11![[thin space (1/6-em)]](https://www.rsc.org/images/entities/char_2009.gif) 800 ± 2600 800 ± 2600 |
11.26 |
18800 ± 1700 |
| 12.97 |
14000 ± 3400 |
12.69 |
17600 ± 6300 |
12.41 |
40400 ± 11000 |
— |
— |
 |
| | Fig. 2 (top) Experimental ratio IA/IB as a function of the amplitude νD1 of the rf field applied to the deuterium spins recorded at pD 7.7 and T = 300 K with τ = 10.6 ms and nCPMG = 2. Anomalous ratios IA/IB > 1 only occur when the rf amplitude is too low, in particular in the vicinity of 1J(15N,2H). (bottom) Experimental ratio IA/IB as a function of the offset ΩD of the carrier frequency with respect to the deuterium resonance for pD 9.4, T = 300 K, τ = 10.6 ms, and nCPMG = 2. The lines correspond to eqn (9) (top) and eqn (6) (bottom). For the blue lines, we have assumed that different operator products involving deuterium terms have distinct quadrupolar relaxation rates that depend on the spectral density. For the green lines, we have assumed that all deuterium terms have the same relaxation rate. For strong on-resonance rf fields, as we have used for the determination of exchange rates, the ratios IA/IB do not change significantly if one assumes a single or several distinct relaxation rates. | |
All experiments were performed at 14.1 T (600 MHz for 1H, 151 MHz for 13C, 92 MHz for 2H, and −61 MHz for 15N) using a Bruker Avance III spectrometer equipped with a cryogenically cooled TXI probe. The samples were prepared by dissolving 20 mM tryptophan (fully 13C and 15N enriched) in 100% D2O buffered with 20 mM citrate, acetate, Tris or phosphate buffer depending on the pH range. We determined kH in our earlier work7 using 97% H2O and 3% D2O. The pH was adjusted by DCl or NaOD; the indicated pH values include corrections to take into account that the pH was measured in D2O with an electrode calibrated for H2O according to the following equation20
| | | pD = pHapparent + 0.4 | (11) |
Results and discussion
For each pH and temperature, the exchange rates kD have been determined from three to seven ratios IA/IB of the signal intensities corresponding to six to fourteen experiments performed with variable numbers of π-pulses 2 ≤ n ≤ 8 in the CPMG trains, and different intervals, τ = 2.6, 5.3, 10.6 and 21.2 ms, but with the same total relaxation time 2τnCPMG. A minimum of two ratios IA/IB at different delays are required for an unambiguous determination of kD, since two rates can be compatible with a single IA/IB ratio. Fig. 3 shows how this ambiguity is lifted by changing the inter-pulse delay 2τ in the CPMG pulse train. The pseudo first-order exchange rate constants were found to lie in a range 0 < kD < 40000 s−1, depending on pH and temperature (Table 1). At each temperature, the exchange rate kD was found to be slowest for pDmin 4.8. When the exchange rate kD is very low, one cannot neglect contributions due to the difference in relaxation rates of the in-phase 15N coherence and other rates in the relaxation matrix of eqn (6). From an earlier study of the exchange of indole protons,7 we know that the exchange rate kH almost vanishes near pHmin. On the other hand, as can be seen in Table 1, the exchange rates kD do not vanish near pDmin. Moreover, if one neglects relaxation of deuterium, some apparent exchange rates increase at lower temperatures, which is physically impossible. Hence, we incorporated a temperature-dependent quadrupolar relaxation rate RQ in eqn (12) and subtracted it from the apparent exchange rates at all pD. The use of a single constant RQ to describe the effects of deuterium relaxation is rather naive. In particular for weak rf fields or large deuterium offsets, this assumption may lead to errors. We can calculate the relaxation rates of operator products containing terms such as Dz, (3Dz2 − 2E), Dx, Dy, (Dx2 − Dy2), (DyDz + DzDy) and (DxDz + DzDx).21 However, we have verified that under the conditions for which the rates of Fig. 4 were obtained, i.e., for strong rf fields and vanishing deuterium offsets, the exchange rates are barely affected if we assume that all deuterium terms have a common relaxation rate. The errors in the experimental ratios IA/IB were determined from standard deviations. The error propagation was further simulated by the Monte Carlo technique. The errors in the exchange rates kD were estimated from the curvature around the minima of χ2 and found to lie in a range between 3 and 28%.
 |
| | Fig. 3 Simulated ratios IA/IB as a function of the exchange rates kD. The curves correspond to τ = 21.2 ms and nCPMG = 2, τ = 10.6 ms and nCPMG = 4, and finally τ = 5.3 ms and nCPMG = 8, keeping the total time 2τnCPMG constant. | |
 |
| | Fig. 4 Exchange rate constants kD with corrections of Table 2 for the contributions due to quadrupolar relaxation as a function of pD over the temperature range 290 ≤ T ≤ 320 K. Solid lines result from fits to eqn (12). | |
If the exchange rate constants kD are plotted as a function of pD on a logarithmic scale, one obtains a V-shaped curve that is characteristic of acid catalysis by D+ ions and basic catalysis by OD− ions, the latter being more efficient (Fig. 4). In the cationic, zwitterionic and anionic forms of tryptophan, the exchange rates result from sums of acidic and basic contributions. The overall exchange rate constant kD can be written as:2,22
| | | kD = kcDfc[D+]c + kzDfz[D+]z + kzODfz[OD−]z + kaODfa[OD−]a + RQ | (12) |
where the rate
RQ expresses contributions due to the quadrupolar deuterium relaxation to the decay of antiphase
15N coherences. The indices D and OD represent the contributions of acidic and basic mechanisms (see below) for the cationic, zwitterionic and anionic forms of tryptophan, abbreviated by
c,
z, and
a in
Fig. 5.
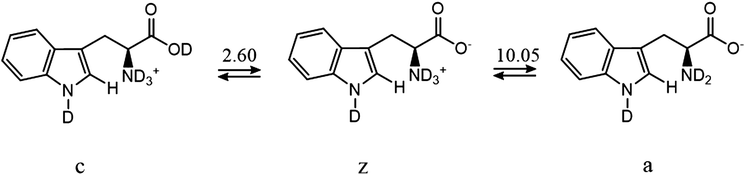 |
| | Fig. 5 Tryptophan exists in three forms c (cationic), z (zwitterionic) and a (anionic), with mole fractions fc, fz and fa that depend on pD. | |
The mole fractions fc, fz and fa of the cationic, zwitterionic and anionic forms of tryptophan are:
| fc = (1 + 10pD−pKa1 + 102pD−pKa1−pKa2)−1 |
| fz = (1 + 10−pD+pKa1 + 10pD−pKa2)−1 |
| | | fa = (1 + 10−pD+pKa2 + 10−2pD+pKa1+pKa2)−1 | (13) |
Where [D
+] = 10
−pD, [OD
−] =
KW10
pD. The auto-ionization constant
KW of D
2O depends on the temperature.
23 In H
2O at 25 °C, p
Ka1 = 2.46 for the protonation of the carboxyl group, while p
Ka2 = 9.41 corresponds to the protonation of the amine group. In D
2O at 25 °C, we have determined that p
Ka1 = 2.60 and p
Ka2 = 10.05.
24 The variation of p
Ka with temperature
23 has been taken into account.
Fig. 4 and
Table 2 show the results of the fitting of the exchange rate constants
kD to
eqn (12), which allows one to obtain the catalytic rate constants for the contributions of acid and basic mechanisms for each of the three forms
c,
z, and
a. The basic contribution of the cationic form and the acidic contribution of the anionic form are masked by other terms and can be neglected.
Table 2 Exchange rate constants kD and kH [s−1] derived by fitting to eqn (12)
| |
290 K |
300 K |
310 K |
320 K |
|
300 K |
310 K |
320 K |
|
Proton exchange rates were not measured at these temperatures.7
|
|
R
Q
|
36.2 ± 5.6 |
26.51 ± 3.7 |
19.4 ± 9.7 |
16.6 ± 3.3 |
R
Q
|
0.37 ± 0.03 |
|
|
| log(kcD) |
2.91 ± 0.64 |
3.31 ± 0.27 |
3.49 ± 0.32 |
3.01 ± 1.20 |
log(kcH) |
2.91 ± 0.04 |
|
|
| log(kzD) |
3.80 ± 0.95 |
3.74 ± 0.64 |
3.70 ± 1.22 |
4.14 ± 0.24 |
log(kzH) |
3.31 ± 0.05 |
|
|
| log(kzOD) |
7.89 ± 0.07 |
8.10 ± 0.06 |
8.28 ± 0.03 |
8.41 ± 0.08 |
log(kzOH) |
8.13 ± 0.02 |
8.29 ± 0.29 |
8.47 ± 0.41 |
| log(kaOD) |
6.64 ± 0.20 |
6.69 ± 0.30 |
6.87 ± 0.12 |
7.19 ± 0.19 |
log(kaOH) |
7.53 ± 0.05 |
7.72 ± 0.27 |
7.97 ± 0.37 |
The activation energy Ea of the transition state provides a measure of the strength of N–D or N–H bonds.25 The activation energy Ea is defined by the Arrhenius equation
where
A is an empirical pre-exponential “frequency factor”,
R the universal gas constant,
T the temperature and
k the exchange rate. The dependence of
Ea on pH or pD for H–H and D–D exchange processes and the activation energies and pre-exponential frequency factors are shown in
Table 3 for protons and in
Table 4 for deuterium.
Table 3 Activation energies Ea and pre-exponential frequency factors A for the indole proton HN in tryptophan
| pH |
E
a [kJ mol−1] |
ln(A) |
| 6.3 |
88 ± 2 |
37 ± 1 |
| 7.41 |
84 ± 2 |
37 ± 1 |
| 8.31 |
83 ± 4 |
39 ± 1 |
| 9.08 |
82 ± 6 |
40 ± 2 |
| 10.01 |
86 ± 14 |
43 ± 5 |
| 10.6 |
94 ± 12 |
47 ± 4 |
Table 4 Activation energies Ea and pre-exponential frequency factors A for the indole deuterium DN in tryptophan. The activation energies and the pre-exponential factors are strongly correlated
| pD |
E
a [kJ mol−1] |
ln(A) |
| 1.0 |
38 ± 17 |
20 ± 7 |
| 1.5 |
40 ± 12 |
20 ± 5 |
| 2.0 |
35 ± 11 |
17 ± 4 |
| 7.0 |
87 ± 3 |
35 ± 1 |
| 8.0 |
86 ± 8 |
37 ± 3 |
| 9.0 |
82 ± 9 |
38 ± 3 |
| 10.0 |
73 ± 14 |
36 ± 6 |
| 11.0 |
72 ± 7 |
36 ± 3 |
| 12.0 |
87 ± 23 |
44 ± 9 |
One can speak of a kinetic isotope effect when the exchange rate is affected by isotopic substitution.26 In the present case, we compare the exchange rates of indole protons in tryptophan with H2O on the one hand, and analogous exchange rates of indole deuterons with D2O on the other. The kinetic isotope effect is defined as the ratio of the rate constants kH/kD. The change in exchange rates results from differences in the vibrational frequencies of the N–H or N–D bonds formed between 15N and 1H or 2D.27–29 Deuterium will lead to a lower vibrational frequency because of its heavier mass (lower zero-point energy). If the zero-point energy is lower, more energy is needed to break an N–D bond than to break an N–H bond, so that the rate of the exchange will be slower. Moreover, one expects Ea to be larger for deuterium. The results in Tables 3 and 4 do not support this expectation, but if one assumes the same pre-exponential frequency factor for H and D, Ea is indeed larger for the heavier isotope.
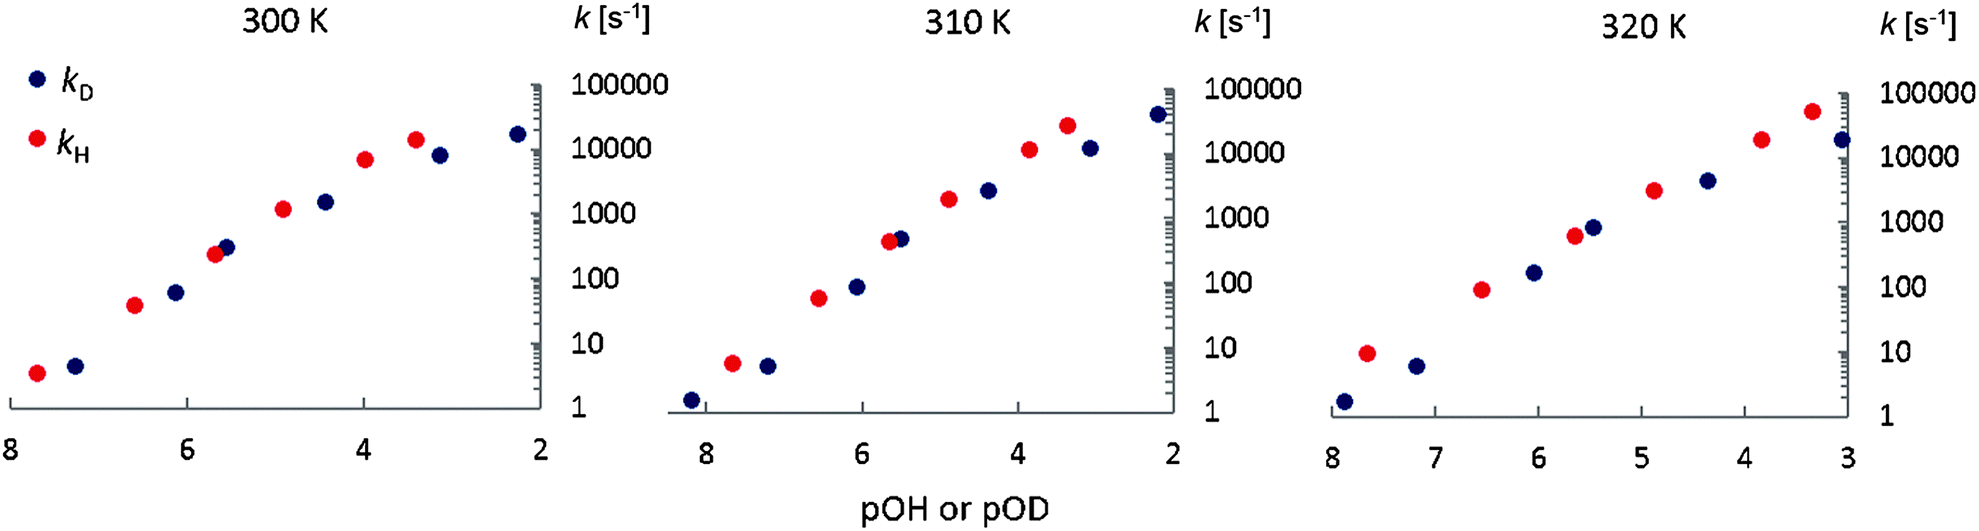
Fig. 6 shows exchange rates kD and kH at 300 K. For acid catalyzed exchange, kD/kH > 2.5 because D3O+ is a stronger acid than H3O+. For base catalyzed exchange, kD/kH < 1. However, to compare the difference between catalysis by OH− and OD−, we need to take into account the difference of the ionization constants: pKW(D2O) = 14.95 and pKW(H2O) = 13.99 at 25 °C.
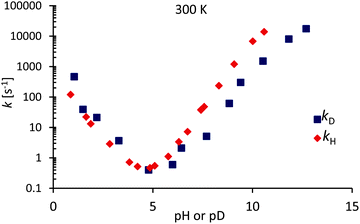 |
| | Fig. 6 Deuterium and proton exchange rates kD (blue) and kH (red) as a function of pH or pD at 300 K. The pD scale has been corrected according to eqn (11) to take into account the use in D2O of a glass electrode designed for H2O. | |
Fig. 7 shows the base-catalyzed exchange rate constants kD and kH as a function of pOH or pOD. The exchange rates kD are slightly lower than kH, giving the approximate kinetic isotope effects: kH/kD = 2.2 ± 0.3, 2.3 ± 0.3 and 2.1 ± 0.3 at 300 K, 310 K and 320 K respectively (Fig. 7.) These values result from averages of the exchange rate constants for the zwitterionic and anionic forms (Table 5).
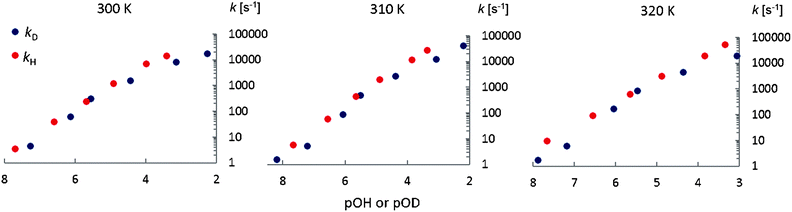 |
| | Fig. 7 Base catalyzed exchange rates kD and kH as a function of pOH or pOD at different temperatures. | |
Table 5 Kinetic isotope effects (KIE) kH/kD for the exchange rate constants of each of the three forms of tryptophan in solution: c (cationic), z (zwitterionic), and a (anionic)
| |
300 K |
310 K |
320 K |
|
Proton exchange rates were not measured at these temperatures.7
|
|
k
c
H/kcD |
0.40 ± 0.04 |
|
|
|
k
z
H/kzD |
0.37 ± 0.09 |
|
|
|
k
z
OH/kzOD |
1.1 ± 0.1 |
1.0 ± 0.3 |
1.1 ± 0.5 |
|
k
a
OH/kaOD |
7 ± 2 |
7 ± 2 |
6 ± 3 |
In Table 5 the KIE is defined as kiH/kiD for acid catalysis or as kiOH/kiOD for base catalysis, where i = c, z, and a stand for the cationic, zwitterionic, and anionic forms of tryptophan in solution, with the heaviest isotope always in the denominator. If tunneling can be neglected, the KIE depends on the nature of the transition state. The maximum isotope effect for N–H bonds is kH/kD ≈ 9, assuming that the bond is completely broken in the transition state (TS). The KIE can be reduced if the bonds are not completely broken in the TS. The KIE can be close to 1 if the TS is very similar to the reactant (N–D bond nearly unaffected) or very similar to the product (N–D bond almost completely broken).
The experimental ratio kaOH/kaOD is near its maximum when pH > pKa2, which suggests that the N–D bond is broken in the rate-limiting step and that the deuteron is half-way between the donor and the acceptor. However the ratio kzOH/kzOD ≈ 1 suggests that the N–D bond is either only slightly or almost completely broken in the TS. The protonation of the amine withdraws electron density and increases the acidity of the HN group which favors the formation of the anionic form. This explains why kzOH/kaOH > 1 and kzOD/kaOD > 1. For the acid-catalyzed exchange constants, we observe an inverse kinetic isotope effect. This can happen when the degree of hybridization of the reactant is lower than that of the reaction center in the TS during the rate-limiting step.
The mechanisms for proton or deuteron exchange have been thoroughly reviewed.30–32 Englander30 and his collaborators pointed out that the rate of the exchange of protons attached to nitrogen depends on the ability to form hydrogen-bonded complexes in the transition state involving the donor (tryptophan) and the acceptor (D2O or OD−). This occurs in three steps: (i) encounter of the donor and the acceptor, (ii) formation of the transition state involving the donor and acceptor, and (iii) cleavage of the N–D bond. The mechanism of acid-catalyzed exchange consists of the addition onto the nitrogen of a D+ ion from the solvent, followed by removal of D+ by D2O (Fig. 8). The mechanism of the base-catalyzed reaction involves removing the indole deuterium to create the conjugate base, which then abstracts a D+ from D2O to regenerate the indole (Fig. 9).
 |
| | Fig. 8 Acid-catalyzed mechanism of exchange. The transition state is shown in brackets. | |
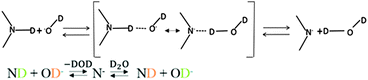 |
| | Fig. 9 Base-catalyzed mechanism of exchange. The transition state is shown in brackets. | |
Altogether we can say that the rate-limiting step in the base-catalyzed mechanism is the removal of the proton or deuteron from the nitrogen. On the other hand, for the acid-catalyzed mechanism, is the donation of a proton or deuteron by H3O+ respectively D3O+. Finally, the curves of logkDvs. pD and of logkHvs. pH show a combination of specific base catalysis at high pH, and a specific acid catalysis at low pH, which becomes more important at higher temperatures.
Conclusions
We have adapted our method that was originally designed for measuring fast H–H exchange rates kH to the study of D–D exchange rates k. In tryptophan in aqueous solution over a range of pH, respectively pD, the kinetic isotope effect, defined as the ratio kH/kD between the H–H and D–D exchange rates, was determined at several temperatures. The dependence of the activation energies on pH provides new insight into the mechanisms of the exchange processes. The results agree with the mechanisms discussed by Englander et al.30
Abbreviations
| CPMG | Carr Purcell Meiboom Gill |
| KIE | Kinetic isotope effect |
| TS | transition state |
Acknowledgements
The authors thank Dr Akansha Ashvani Sehgal, Dr Fatiha Kateb and Dr Roberto Buratto for valuable assistance. This work was supported by the Swiss National Science Foundation (SNSF), the Ecole Polytechnique Fédérale de Lausanne (EPFL), the Swiss Commission for Technology and Innovation (CTI), the French CNRS, and the European Research Council (ERC contract ‘Dilute para-water’).
Notes and references
- A. D. Bain, Prog. Nucl. Magn. Reson. Spectrosc., 2003, 43, 63–103 CrossRef CAS.
- C. E. Dempsey, Prog. Nucl. Magn. Reson. Spectrosc., 2001, 39, 135–170 CrossRef CAS.
- M. Hoshino, H. Katou, Y. Hagihara, K. Hasegawa, H. Naiki and Y. Goto, Nat. Struct. Biol., 2002, 9, 332–336 CrossRef CAS PubMed.
- F. Persson and B. Halle, Proc. Natl. Acad. Sci. U. S. A., 2015, 112(33), 10383–10388 CrossRef CAS PubMed.
- M. Guéron, M. Kochoyan and J. L. Leroy, Nature, 1987, 328, 89–92 CrossRef PubMed.
- Y. Paterson, S. W. Englander and H. Roder, Science, 1990, 249, 755–759 CAS.
- F. Kateb, P. Pelupessy and G. Bodenhausen, J. Magn. Reson., 2007, 184, 108–113 CrossRef CAS PubMed.
- D. B. Northrop, Biochemistry, 1975, 14(12), 2644–2651 CrossRef CAS PubMed.
- R. Sharma, T. J. Strelevitz, H. Gao, A. J. Clark, K. Schilknegt, R. S. Obach, S. L. Ripp, D. K. Spracklin, L. M. Tremaine and A. D. N. Vaz, Drug Metab. Dispos., 2012, 40, 625–634 CrossRef CAS PubMed.
- S. W. Englander, T. R. Sosnick, J. J. Englander and L. Mayne, Curr. Opin. Struct. Biol., 1996, 6, 18–23 CrossRef CAS PubMed.
- T. Segawa, F. Kateb, L. Duma, G. Bodenhausen and P. Pelupessy, ChemBioChem, 2008, 9, 537–542 CrossRef CAS PubMed.
- A. A. Sehgal, L. Duma, G. Bodenhausen and P. Pelupessy, Chem. – Eur. J., 2014, 20, 6332–6338 CrossRef CAS PubMed.
- H. Carr and E. Purcell, Phys. Rev., 1954, 94, 630–638 CrossRef CAS.
- S. Meiboom and D. Gill, Rev. Sci. Instrum., 1958, 29, 688–691 CrossRef CAS.
- G. A. Morris and R. Freeman, J. Am. Chem. Soc., 1979, 101(3), 760–762 CrossRef CAS.
- A. J. Shaka and J. Keeler, Prog. Nucl. Magn. Reson. Spectrosc., 1987, 19, 47–129 CrossRef CAS.
- P. Allard and T. Härd, J. Magn. Reson., 2001, 153, 15–21 CrossRef CAS PubMed.
-
R. R. Ernst, G. Bodenhausen and A. Wokaun, Principles of Nuclear Magnetic Resonance in One and Two Dimensions, Clarendon Press, New York, 1987 Search PubMed.
- A. D. Bain and B. Berno, Prog. Nucl. Magn. Reson. Spectrosc., 2011, 59, 223–244 CrossRef CAS PubMed.
- P. K. Glasoe and F. A. Long, J. Phys. Chem., 1960, 64(1), 188–190 CrossRef CAS.
- O. Millet, D. R. Muhandiram, N. R. Skrynnikov and L. E. Kay, J. Am. Chem. Soc., 2002, 124, 6439–6448 CrossRef CAS PubMed.
- Y. Bai, J. S. Milne, L. Mayne and S. W. Englander, Proteins, 1993, 17(1), 75–86 CrossRef CAS PubMed.
-
D. R. Lide, CRC Handbook of Chemistry and Physics, CRC Press, Boca Raton, 85th edn, 1999 Search PubMed.
- A. Krezel, J. Inorg. Biochem., 2004, 98, 161–166 CrossRef CAS PubMed.
- K. Laidler and C. King, J. Phys. Chem., 1983, 87(15), 2657 CrossRef CAS.
- S. Scheiner, Biochim. Biophys. Acta, 2000, 1458, 28–42 CrossRef CAS.
- P. F. Cook, Isot. Environ. Health Stud., 1998, 34, 3–17 CrossRef CAS PubMed.
- F. H. Westheimer, Chem. Rev., 1961, 3, 265–273 CrossRef.
- G. P. Connelly, Y. Bai, M.-F. Jeng and S. W. Englander, Proteins, 1993, 17, 87–92 CrossRef CAS PubMed.
- S. W. Englander, N. W. Downer and H. Teitelbaum, Annu. Rev. Biochem, 1972, 41, 903–924 CrossRef CAS PubMed.
- in Chemical Kinetics: Proton Transfer, ed. C. H. Bamford, R. G. Compton and C. F. H. Tipper, Elsevier Scientific Publishing Co., Amsterdam, 1977, vol. 8 Search PubMed.
- M. Eigen, Angew. Chem., Int. Ed., 1964, 3(1), 1–72 CrossRef.
Footnotes |
| † Despite IUPAC recommendations, we use the notation 2D rather than 2H. |
| ‡ We use the symbol 2D when referring to isotopes as in the expressions 1J(1H,15N) or 1J(2D,15N). |
| § We shall refer to H or D for atoms that appear in molecular formulae and to HN or DN in N–H and N–D groups. For the Cartesian components of angular momentum operators, we have used Hx, Hy, Hz, Dx, Dy, Dz, Nx, Ny, Nz, Cx, Cy, Cz rather than the common notation Ix, Rx, Sx, etc. |
|
| This journal is © the Owner Societies 2016 |
Click here to see how this site uses Cookies. View our privacy policy here. 
 Open Access Article
 This Open Access Article is licensed under a