 Open Access Article
Creative Commons Attribution 3.0 Unported Licence
Pair correlations that link the hydrophobic and Hofmeister effects†
Quinn Alexander
Besford
 *,
Maoyuan
Liu
and
Angus
Gray-Weale
*
School of Chemistry, The University of Melbourne, Melbourne, Australia. E-mail: quinn.besford@gmail.com; gusgw@gusgw.net
First published on 29th February 2016
Abstract
The Hofmeister effect describes how different ions make solutes more or less hydrophobic. The effect is thought to occur due to structural changes in the solvent induced by the ion's presence, particularly in water. In this study, the structural changes in water due to the presence of ions are investigated by molecular dynamics simulations of various monatomic ions in the SPC/E water model. Structural analyses reveal specific orientations of solvating waters around each of the ions studied. Using a new method, these orientations are quantified by a set of pair correlation functions that describe dipole–ion correlations in structure. These correlations are shown to contribute to the potential of mean force between waters and the ion of interest, and therefore to the free energy of the system. The magnitude of this free energy is found to result in a Hofmeister series for the various ions studied, therefore demonstrating a Hofmeister effect with respect to water's structure that is quantified by pair correlation functions. Most crucially, the pair correlations that lead to this Hofmeister effect also contribute to the hydrophobic effect (the entropy of hydrophobic solvation) [Liu et al., J. Chem. Phys., 2015, 142, 114117], and those which dominate the hydrophobic effect are modulated by an ion's presence, therefore demonstrating a mechanistic link between the two effects.
Cellular organisation and the biochemistry of an organism depend on water and dissolved ions.1–4 Different ions affect the conformations and activities of proteins, as well as protein solubility, crystallisation, and protein–protein interactions.5–8 The effects induced by ions in water are not limited to protein phenomena but also include the solubility of salts9 and hydrophobes,10 altered cloud points,11 altered reorientation dynamics of water in the first hydration shells,12,13 increased or reduced surface tensions,14–16 and changed molecular forces and colloidal stability.17 Furthermore, anions and cations have different affinities for the aqueous/air interface.18–20 The electric field around an ion causes the water molecules to re-arrange themselves,21 and it is thought that different ions exert their effects by changing the hydrogen bonding properties of water.22 This article investigates the perturbation of water's structure due to different monatomic ions by using a new method that accounts for pair correlations in structure. We recently used this method to account for the entropy of hydrophobic solvation.23 The aim here is to explore the contribution of pair correlations to the solvation free energy of ions in water, and whether a Hofmeister series can be found in these correlations.
The original Hofmeister series, proposed in 1888 by Franz Hofmeister,24 ordered various neutral salts on the minimal concentration required to precipitate a given protein from solution.25 This simple series showed that different ions make proteins more or less hydrophobic. The series has expanded since the time of Hofmeister to include more physical effects.8,17 The ordering of the series can change depending on the phenomena of interest,16,26 but broadly is classified into two extremes; kosmotropes and chaotropes. These terms are used to describe the capacity of a particular ion to “make” or “break” water structure, respectively, as this was thought to be central to the mechanism of the effect.15,27 However, the notion that the series exists due to changes in bulk water has not reached consensus and is still quite controversial.27,28 That water molecules in the first solvation shells of ions do not have the same average hydrogen bonding, in terms of extent, geometry, and dynamics as those in bulk water is beyond controversy.21 The situation for water molecules outside the first shell is less clear.
Diffraction measurements and molecular dynamics simulations have provided information on the structure of the solvation shells of ions. Näslund et al.29 reported X-ray absorption spectroscopy and X-ray Raman scattering data for ion solvation in water, finding that the hydrogen bonding network, in terms of forming and breaking, remains unchanged and only the waters closest to the ion are affected (i.e. the first solvation shell). This conclusion is supported by Funkner et al.30 who found from a systematic terahertz absorption spectroscopy and molecular dynamics studies of a variety of divalent salts, that ion induced effects are confined to the first shell. Further complemented by femtosecond pump–probe spectroscopy measurements reported by Omta et al.,31 who found the addition of ions had no influence on the rotational dynamics of water molecules outside the first solvation shell, suggesting the ions do not enhance or breakdown the hydrogen bond network in liquid water.
On the other hand, Mancinelli et al.32 interpreted neutron diffraction data from monovalent ionic solutions and found that the second solvation shell is perturbed from the bulk, indicating a larger range of an ion's perturbation of waters. This is supported by Tielrooij et al.33 who used a coupled terahertz dielectric relaxation and femtosecond infrared spectroscopy to study water dynamics around different ions to conclude that in some cases the ion induced effects on water molecules extends well beyond the first solvation shell. A different approach by O'Brien et al.34 used infrared photodissociation spectroscopy to study the solvation patterns of SO42−(H2O)n clusters in the gas phase. O'Brien et al. found that for small clusters with n < 43 the maximum of the OH vibrational band is blue-shifted from that of bulk water. That such a large number of water molecules show this pattern indicates ion-specific effects beyond the first solvation shell,35 since the first solvation shell contains about 12 water molecules.36 For larger clusters n > 43 the broad frequency features increasingly resemble bulk water. This suggests that long-range structural effects beyond the first solvation shell can be observed.35 Some difficulty in interpreting structure past the ion may be compounded by the choice of the geometrics37 and the thermodynamics38 of a hydrogen bond. More structural detail is needed in order to reconcile these different data on ion induced effects on water's network, and subsequent changes in hydrogen bonding.
Early models for the thermodynamics in aqueous systems generally treat the solvent as structureless.17 The Born theory of solvation39 models interactions between the ion and solvent as purely electrostatic in origin with the ion viewed as a charged sphere of radius r and the solvent as a dielectric continuum of dielectric constant ε.40 The free energy of transferring the ion from vacuum to the solvent is given by
 | (1) |
Dispersion forces between charged objects in an aqueous electrolyte system can be described by DLVO theory,43 which treats interparticle interactions in terms of a balance of attractive quantum mechanical treatment of van der Waals forces and repulsive electrical double-layer forces.8 The van der Waals forces are treated by Lifshitz theory,44 whereas the electrostatic forces are handled by a nonlinear Poisson–Boltzmann description.45 One of the major approximations in DLVO theory is the use of the Poisson–Boltzmann equation to describe the electrostatic interactions, as the method treats ions in solution as point-charges, thus losing the ion specificity,8 and therefore an account of the Hofmeister series.46 In addition, since van der Waals forces are intimately coupled to double layer electrostatic forces,47 more work is needed to improve the theory of dispersion forces in aqueous systems to reveal more detail on Hofmeister phenomena.
This article aims to show that structural changes induced by an ions presence in liquid water can be quantified by pair correlation functions that describe dipole–ion correlations in structure. These correlations ultimately contribute to the free energy of the system. In the following, simulations of various atomic ions in the SPC/E water model48 are reported along a with rigorous structural analysis of waters around each ion. Pair correlation functions are derived for dipole–ion correlations and these will be shown to make a large contribution to the solvation free energy of the ions in water.
1 Simulation method
Classical molecular-dynamics (MD) simulations were performed using the SPC/E model of water. The Lennard-Jones potential parameters for SPC/E water used are the same as those given by Paschek49 with σ = (O) 3.1656 Å, εkB−1(O) = 78.2 K, and q(H) = 0.4238 e. The SPC/E water model is chosen so as to compare results from these simulations to those reported by us23 for the entropy of hydrophobic solvation in SPC/E water. All ten ions were represented by a point charge with a Lennard-Jones (LJ). The non-polarisable potential parameters for water–ion interactions are the same as those used by Koneshan et al.,50 and are summarised in Table S1 of the ESI.†The simulations were performed in the isobaric–isothermal (NPT) ensemble with 512 water molecules and one ion. Simulations were performed using the Nosé–Hoover chain thermostat and barostat,51,52 with relaxation times of 1.5 and 2.4 ps, respectively. The electrostatic potentials were calculated using the P3M method on a grid of 16 × 16 × 16 with an Ewald convergence parameter η = 0.18.53 Bond constraints are handled using the SHAKE algorithm,54 and the integration performed using a timestep of 1 fs. Short-range interactions were cut-off at 18.5255 bohr. The simulations were equilibrated for 10 ps, and statistics collected over 1 ns trajectories. Statistics were sampled at 0.5 ps (500 MD steps). All simulations were performed over a range of temperatures from 260 K to 340 K at intervals of 10 K, and 1 atm pressure.
2 Results and discussion
2.1 Structure around ions
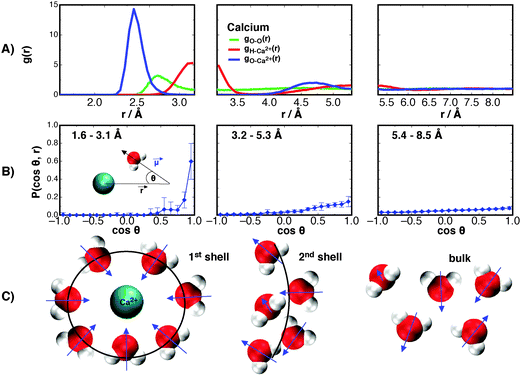
The radial distribution function (RDF) between waters' oxygen and hydrogen centers with the Ca2+ ion are shown in Fig. 1A. These are examined first so that the range of correlations in density may be later compared to ranges of dipole fluctuations.The RDF for oxygen–ion correlations, gO–Ca2+, in the first solvation shell surrounding the Ca2+ shows the first solvation shell to be intensely populated with a peak maximum of about 14.31 at 2.46 Å from the Ca2+ center, similar to the result obtained by Koneshan et al.50 For the hydrogen–ion correlation, gH–Ca2+(r), the maximum is at 3.15 Å with a height of 5.30. Both functions decay to almost zero after the first solvation shell (see Table S2 in ESI†), suggesting a tightly bound “crowd” of waters that do not leave the ion throughout the simulated trajectories. The second solvation shells for both functions are relatively small and both approach 1 at a distance of about 5.82 Å from the Ca2+ center. For clarity, these functions are separated into three regions that roughly correspond to the first and second solvation shells, and bulk water for the gO–Ca2+(r) function. This is done so as to explore the distribution of dipole moment vectors, ![[small mu, Greek, vector]](https://www.rsc.org/images/entities/i_char_e0e9.gif) , around the Ca2+ ion. The distributions are calculated as the angle formed between the chemical dipole moment vector (+ve → −ve) of each water and the displacement vector,
, around the Ca2+ ion. The distributions are calculated as the angle formed between the chemical dipole moment vector (+ve → −ve) of each water and the displacement vector, ![[r with combining right harpoon above (vector)]](https://www.rsc.org/images/entities/i_char_0072_20d1.gif) , to the ions center. The results are shown in Fig. 1B.
, to the ions center. The results are shown in Fig. 1B.
In the first solvation shell there is a strong orientation of waters' dipole moment vector directly towards the Ca2+ ion center. The orientational preference acts not only to shield the highly charged Ca2+ ion from surrounding waters, but also to stabilise the solvation shells around the ion, and therefore contribute to the free energy of solvation. We later show how this orientational preference leads to the lowering of the free energy of the surrounding waters. Interestingly, it can be seen that this orientation effect decays rapidly away from the first solvation shell. At the second solvation shell there is only a mild preference for an orientation towards the ion, and by 5.82 Å outwards from the ion there is little preference for orientation, showing that the presence of the divalent ion does not significantly perturb the orientational structure of water past the second solvation shell into the bulk. Only the first solvation shell has a significant preference. These results are similar to those of Krekeler and Delle Site,55 who through Car–Parrinello MD of systems containing 32, 64, and 128 water molecules simulated for 5 ps, observed only the first solvation shell exhibits orientational effects. However, by simulating a larger system (512 water molecules) for a longer period of time (1 ns) we observe a mild orientational preference at the second solvation shell. Though other orientation effects, described by other correlation functions, may persist further into the bulk. These dipole moment orientation results are shown schematically in Fig. 1C.
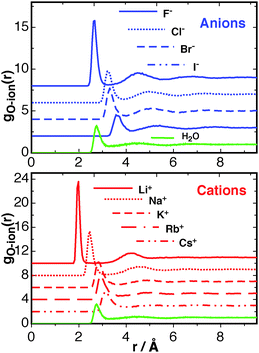
The RDFs for F−, Cl−, Br−, I−, Li+, Na+, K+, Rb+, Cs+ are shown in Fig. 2. The height of the first peak for both the anion and cation series follows a typical Hofmeister series;56 anions F− > Cl− > Br− > I−; cations Ca2+ > Li+ > Na+, K+ > Rb+ > Cs+. These data show excellent agreement to other simulations reported by Lee and Rasaiah,57 giving confidence in the reproducibility of the simulated system. The smaller ions, most noticeably F−, Li+, and Na+, pull more waters into the first solvation shell than is usual for a water–water RDF. This may be viewed as a “structure-making” effect, but given that this effect is mainly limited to the 1st and only mildly to the 2nd solvation shells of the Ca2+ ion (Fig. 1), the effect for the monovalent ions should be smaller. The solvation structure of the K+ and Rb+ ions starts to resemble a population of waters that is usual for water–water correlations. The larger Cs+ ion, and also the Cl−, Br−, and I− ions, occupy more space, therefore the first peak in the gO–ion(r) for these ions occurs at a larger distance than the water–water g(r). With respect to the free energy of solvation, the larger ions occupy more space that would otherwise be occupied by water, therefore creating a destabilising cavity contribution to the free energy. This is explored further later in this article The RDF results are summarised in Table S2 of the ESI,† with the distance at the first peak in the RDF along with the corresponding minima, and the same for the second solvation shell shown. The first minima in all the O–ion RDFs are much smaller than the first minimum of the water–water RDF, revealing a relatively tight binding of the first solvation shell for all ions studied.
The distribution of orientations of waters for each of the monovalent ions are shown in Fig. 3. The distributions are averaged over only the first solvation shell for each ion. The lower and upper limits for the averaging is the start of the first peak in the RDF for each ion, and the distance to the first minima, as given in Table S2 (ESI†). Similar to the case for Ca2+, it is seen that the cations cause the hydrating waters to preferentially orientate their dipole vector directly at the ion. The strongest orientational constraint is found for the Li+ ion, and this eases into a broader distribution of angles in travelling down the group 1 series to Cs+. The anions have a more defined distribution at cos![[thin space (1/6-em)]](https://www.rsc.org/images/entities/char_2009.gif) θ ≈ −0.7, indicating the first hydrating waters orientate themselves to point one hydrogen atom at the ion. This is similar for all the halides. In the following an analysis of how far these orientational preferences perturb water correlations out towards the bulk is given.
θ ≈ −0.7, indicating the first hydrating waters orientate themselves to point one hydrogen atom at the ion. This is similar for all the halides. In the following an analysis of how far these orientational preferences perturb water correlations out towards the bulk is given.
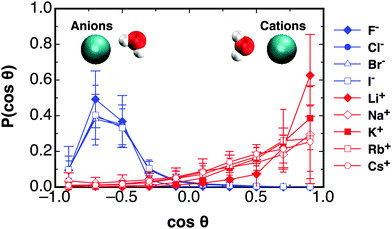 | ||
| Fig. 3 The distribution of angles between waters' dipole moment vector and the displacement to the ion for all the monovalent ions studied at the first peak in each of their RDFs, as given in Table S1 in ESI,† given at 300 K and 1 atm in the NPT ensemble. | ||
2.2 Dipole–ion correlations
As shown above in the structural analyses of water around ions, there is a definite change in structure of the first solvation shell of an ion. We show here that the restricted orientations of water's dipole moments around each ion occurs so as to lower the free energy of the system and stabilise the solvation shells. This stabilisation may be quantified by pair correlation functions that contribute to the potential of mean force between each water and the ion, and to the free energy. Recently, we23 reported derivations for water–water and water–solute pair correlation functions, and found that these correlations can explain the entropy of hydrophobic solvation of small non-polar species in water. This was similar to results obtained by Lazaridis and Paulaitus,58 who found that the entropy and heat capacities of hydrophobic hydration are well accounted for by solute–water correlations alone. In the following the water–water and water–solute correlation functions are applied to the simulated aqueous systems.Water–ion correlations as a function of separation r, may be written in terms of a potential of mean force ψ(r) (see Section 3 of Liu et al.23 for derivations), given as
 | (2) |
 | (3) |
 | (4) |
 | (5) |
 | (6) |
 | (7) |
The contribution of ΔGψ to the free energy of solvation for each of the ions is compared in Fig. 4. Fig. 4 shows that a large stabilising free energy exists due to the correlation of waters' dipole moments with each ion, for both the anions and cations. The free energy has a weak temperature dependence, where the free energy becomes more negative with increasing temperature. The magnitude of ΔGψ is about an order of magnitude lower than the experimental free energy of solvation,60 which is to be expected as great as the total free energy of solvation is dominated by direct Coulombic interactions (calculated through the simple Born model in eqn (1)). It is seen here that a significant contribution to the free energy of solvation arises purely from correlations between dipole moment orientations and ions in solution.
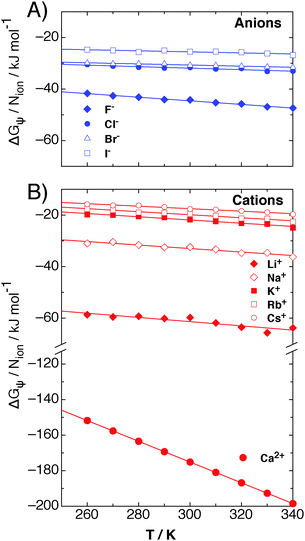 | ||
| Fig. 4 The contribution of dipole–ion correlations, ψ(r), to the free energy of solvation, denoted by ΔGψ, for (A) anions and (B) cations, as calculated from eqn (7), for each of the atomic ions in SPC/E water at 1 atm in the NPT ensemble. The lines are fits to eqn (8) for each ion. | ||
The lower plot of Fig. 4 shows ΔGψ for the Ca2+ ion in SPC/E water, where a much larger contribution from the divalent ion is seen, about an order of magnitude greater than that for the Cs+ ion. At room temperature the stabilisation due to ψ(r) for calcium is of the order of −170 kJ mol−1, about −165 kJ mol−1 greater than ψ(r) for the solvation of methane.23 The increase in the magnitude of ψ(r) for the calcium ion hints at a simple scaling relationship stemming from the charge.
Most intriguing is that the sequence of stabilisation due to ψ(r) in going from most stabilising to least stabilising follows the typical Hofmeister series. Fig. 4 shows specific ion effects where the smallest ions stabilise the solvating waters to the greatest extent, such as the F−, Ca2+ and Li+, whereas the larger ions do this to a lesser degree, especially for I− and Cs+, indicating a more hydrophobic like character of these larger ions. This Hofmeister series follows the one given by Kunz56 exactly, however there is not one unique Hofmeister series as the series changes order depending on the property of interest, such as surface tensions or protein denaturing. The order of the series found in ψ(r), with respect to the magnitude of −ΔGψ, follows
Anions
| F− > Cl− > Br− > I− |
| Ca2+ > Li+ > Na+ > K+ > Rb+ > Cs+ |
 | ||
| Fig. 5 A cartoon illustrating how the solvating waters are orientated around the fluoride, iodide, cesium and lithium ions. | ||
The right hand side of the series begins to approach a similar ΔGψ as that which is found from correlations between waters' dipole moments and small hydrophobic molecules. For example, in other work we found23 that ΔGψ for xenon at 300 K is about −7 kJ mol−1, whereas that for cesium is about −18 kJ mol−1. This demonstrates that the larger ions do become more hydrophobic with increasing ionic radius, and that this analysis is consistent with previous work.23
The lines in Fig. 4 are fits to the form,61
 | (8) |
 . The solvation entropies, due to ψ(r) are shown in Table 1 for each of the ions at 300 K and 1 atm, along with the free energy contributions from ψ(r). It can be seen in Table 1 that the entropic component of ψ(r) is positive for all ions, however this is small compared to the total entropy of solvation.
| Ions | ΔGψ/kJ mol−1 | ΔSψ/kB |
|---|---|---|
| F− | −44.2 | 8.4 |
| Cl− | −31.7 | 3.5 |
| Br− | −30.8 | 2.6 |
| I− | −25.5 | 2.5 |
| Ca2+ | −175.21 | 19.4 |
| Li+ | −59.7 | 9.9 |
| Na+ | −32.4 | 8.2 |
| K+ | −21.8 | 7.6 |
| Rb+ | −19.4 | 7.1 |
| Cs+ | −17.6 | 5.9 |
The changes in structure due to ψ(r) are large and may therefore disrupt water–water correlations. Recently, we23 derived an asymptotic expression for water–water correlations that is denoted ϕ(r) to distinguish it from water–solute correlations (ψ(r)). The form of ϕ between two thermally rotating dipole moments, in SPC/E water, was found to be
 | (9) |
 | (10) |
 | (11) |
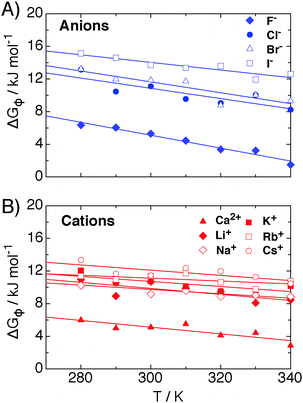 | ||
| Fig. 6 The contribution of ϕ(r) to the free energy of solvation for each of the (A) anions and (B) cations studied, in SPC/E water at 1 atm in the NPT ensemble. The change in free energy due to ϕ is calculated by difference of eqn (11) for pure water and ionic simulations. The lines are linear fits to each data set, and the dielectric properties for the bulk system are given in Fig. S4 of the ESI.† | ||
Fig. 6 shows that each ion causes a positive change in free energy due to their disrupting effect on ϕ(r) between waters. The magnitudes of these positive changes in free energy are greater for the larger more hydrophobic atoms but is still less than the negative stabilising free energy due to ψ(r). The decrement in ΔGϕ for the monovalent ions is significantly lower than the stabilisation due to ψ(r) by some 20–50 kJ mol−1, and about 170 kJ mol−1 for calcium, meaning that the stabilisation due to ψ(r) represents a large, stabilising contribution to the free energy of solvation that exceeds dipolar correlations that are lost due to the ions presence.
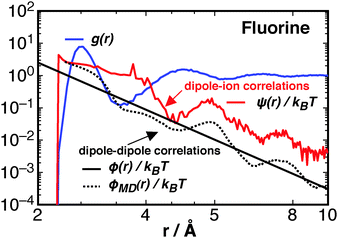
The different correlation functions, ψ(r) and ϕ(r), are compared for the fluorine ion in water at 300 K in Fig. 7. The asymptotic ϕ(r) (eqn (10)), solid black line, is shown with the full expression ϕMD(r), black dotted line, which is calculated from simulated trajectories of pure water (see Section 3 of Liu et al.23), as
 | (12) |
The dipole–ion correlations follow the same qualitative long-range behaviour as ϕMD(r), at least within the 12 Å studied, where the second and third peaks between ϕMD(r) and ψ(r) roughly line up, though the ψ(r) contribution is about an order of magnitude greater. This result shows that the ion's presence is felt at a longer range than the first solvation shell. This is not due to hydrogen bonding, the quantity commonly checked through experiment, but is due to correlations between rotations that contribute to potential of mean force between water molecules and the ion. These ion–water interactions are greater than the ϕ(r) interactions between waters and thus represents a significant change in solution thermodynamics due to the ions presence. At short ranges the stabilisation due to ψ decays approximately as r−2, the same as what is expected for a fixed dipole (or constrained)–charge pair potential.62
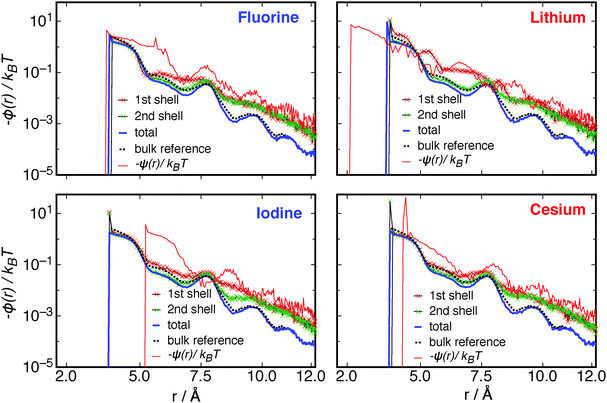
For a closer analysis of ϕ(r) between waters in these systems, ϕ(r) was calculated between waters where at least one water molecule is within the first and also the second solvation shell of the ion. These results are shown in Fig. 8, along with the ϕ(r) for the entire system, a reference ϕ(r) for a bulk system, and also the ψ(r) functions, for each of the extreme anionic and cationic monovalent ions.
Fig. 8 shows features that are specific to each ion type. The fluoride ion causes an enhancement of ϕ(r) between waters just at the first solvation shell, while the second solvation shell ϕ(r) is almost the same as the bulk system. ψ(r) for this system is greater than all other components of the dipole correlation free energy for almost the entirety of the distance up to rcut. The iodine ion causes a similar effect to that caused by fluorine, but to a lesser extent. For lithium, the waters in the first solvation shell have a substantially increased correlation with other waters, where ϕ(r) even exceeds ψ(r) in some places along the correlation curve. The cesium ion, on the other hand, causes very little enhancement of water–water correlations around the ion. Even though there are enhancements of water–water correlations in the solvation shells around the ions, the overall contribution to the systems free energy is small, where there are only few waters in each shell thus averaging over all waters in the system still results in a system size decrement in ϕ(r) between waters. This can be seen as the blue curves in Fig. 8 in comparison to the bulk reference (black dotted lines).
The data in Fig. 8 reveal a complex modulation of water–water interactions depending on the distance from the ion. This may contribute to the observed inconsistencies between different experiments on hydrogen bonding as a function of distance from the ion (see introduction). However, the orientational correlations observed in Fig. 8 are long-ranged interactions that are distinct from hydrogen bonding and as such does not indicate if hydrogen bonding has changed.
As has been shown by Liu et al.,23 the ϕ(r) interaction is responsible for the hydrophobic effect. These data in Fig. 8 reveal a new mechanism for the direct influence of ions on hydrophobic interactions.
Duignan et al.41,63 developed a continuum model of dispersion contributions to ΔGsolv, based on macroscopic quantum electrodynamics, similar to Lifshitz theory,64 using frequency dependent multipole polarisabilities of molecules to predict the dipole, quadruple, and octupole contributions. This dispersion model predicts a negative (favourable) solvation free energy, which is offset by a positive cavity contribution stemming from the region of lost water–water interactions due to the ions presence. This cavity contribution is calculated as the free energy of expanding a surface in water, given as
| ΔGc = σion4πRs2, | (13) |
 | (14) |
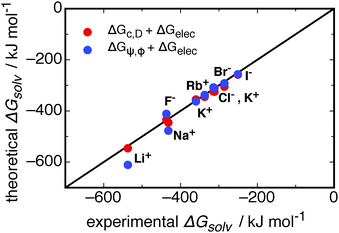 | ||
| Fig. 9 A comparison of different models for the contributions to the solvation free energies of monatomic ions. The contribution of ψ(r) and ϕ(r) from this work, ΔGψ,ϕ, is combined with the electrostatic contribution from the Born model (data given in ESI†), ΔGBorn,41 and shown as blue circles. The model of Duignan et al.41 for the cavity and dispersion, ΔGc,D, and electrostatic contributions are shown as red circles. The line is for x = y. Note that ΔGψ,ϕ is calculated from simulations. | ||
Fig. 9 shows that in combination with the Born electrostatic solvation energy, the free energy resulting from dipole–ion and dipole–dipole correlations (ΔGψ,ϕ) gives good agreement with experimental solvation free energies. This total theoretical solvation free energy from ΔGψ,ϕ is close to that predicted for the cavity, dispersion, and electrostatic contributions, ΔGc,D and ΔGBorn, respectively. Duignan et al.'s41 model for the ΔGc,D contributions, when combined with ΔGBorn, better captures the solvation free energy for the Na+ and Li+ ions in water. The deviation for these two ions may stem from the accuracy of the potentials used in the simulations, and that of the SPC/E water model. To better understand these deviations a more rigorous comparison to computational solvation free energies is required, which is outside the scope of our work. It is important to note that the free energies resulting from ψ(r) and ϕ(r) interactions stem from parameter free calculations on explicit simulated trajectories, and that when combined with the Born electrostatic free energy these quantities give good agreement with experiment.
In order to better compare the different contributions to the solvation free energy, and ultimately to clarify specific ions effects between the models, the components of Duignan et al.'s41 model are compared to that stemming from ψ(r) and ϕ(r) in Table 2.
| Ions | ΔGϕ | ΔGψ | ΔGc | ΔGD | ΔGψ,ϕ | ΔGc,D |
|---|---|---|---|---|---|---|
| F− | 5.3 | −44.2 | 39.1 | −100.5 | −38.9 | −61.4 |
| Cl− | 11.1 | −31.7 | 55.8 | −90.3 | −20.5 | −34.5 |
| Br− | 11.9 | −30.8 | 61.1 | −93.3 | −19.0 | −32.2 |
| I− | 13.7 | −25.5 | 72.2 | −85.4 | −11.81 | −13.2 |
| Li+ | 10.7 | −59.7 | 23.1 | −7.1 | −49.1 | 16.0 |
| Na+ | 9.2 | −32.4 | 30.1 | −21.5 | −23.2 | 8.6 |
| K+ | 10.8 | −21.8 | 42.4 | −46.2 | −11.0 | −3.8 |
| Rb+ | 11.4 | −19.4 | 46.5 | −61.6 | −8.0 | −15.1 |
| Cs+ | 11.5 | −17.6 | 52.7 | −74.9 | −6.1 | −22.2 |
Table 2 reveals interesting features in comparing the cavity and dispersion model to ΔGψ and ΔGϕ. The total free energy for the anions between each theory is of a similar magnitude, following the same trend in decreasing down the halide group. The cations, on the other hand, do not show this same agreement. The trend for ΔGψ,ϕ is the same as that for the anions, whereby the magnitude of the solvation free energy decreases in going down the group 1 metals. This can be understood with regards to the smaller cations most strongly structuring the solvating waters and therefore producing a larger stabilisation due to ion–dipole correlations. The ΔGc,D contribution for these cations follows the opposite trend, where the Li+ ion gives a positive solvation free energy, reducing down to a small negative contribution for K+, and a reasonably large negative contribution for Cs+. This latter trend is counter-intuitive, as the small Li+ ion might be expected to produce a similar solvation free energy to the F− ion due to the similar structural effects induced by its presence (see Fig. 2), and the Cs+ ion may be expected to give a free energy similar to a small hydrophobe, given its large size and low influence on structure (compare Fig. 2 and 3, for example). It is this difference for the cations that allows the cavity and dispersion model to better predict the experimental solvation free energy for the Li+ and Na+ ions.
However, the important point of this comparison is that there is a large contribution to the solvation free energy, similar in magnitude to that from Duignan et al.'s41 model, that is found in correlations in structure (ΔGψ,ϕ). This cannot be found with the assumption of a structureless dielectric continuum, as implied by eqn (14). The ion–dipole correlations studied here demonstrate the long-ranged interaction between waters and an ion, and it is this long-ranged interaction between molecular species that breaks the assumption of a structureless dielectric continuum for aqueous water (see Discussion on p. 338 of Landau and Lifshitz67). By taking the explicit structure of water around an ion into account, new contributions to the free energy of the system have been found, and these contributions produce a Hofmeister series between the ions studied.
Most importantly, the mechanism that leads to our Hofmeister series (ψ(r)) is the same as that which leads to the entropy of hydrophobic solvation (ϕ(r)).23 In addition, the ϕ(r) interaction is modulated by the presence of ions (Fig. 8). This demonstrates a link between the two effects. This link has not previously been established, to our best knowledge, but various experiments have hinted at a close relationship between the two effects. Such as experiments that have shown the addition of salt reduces the solubility of nonpolar solutes, such as benzene, in water22,68 in roughly the same rank-ordering and at the same concentrations as those found for protein precipitations.25,69,70 This relationship is not limited to solubility either, where Geisler et al.71 reported atomic force microscopy measurements of hydrophobic and Hofmeister effects on the adhesion of spider silk proteins onto a solid substrate. They find the desorption forces follow the Hofmeister series for anions and is influenced by the hydrophobicity of the silk protein, indicating the hydrophobic and Hofmeister effects are closely related. This is evidenced further by chemical reactions, where Rizzo72 found a Hofmeister series when different ions are present in the hydrophobically accelerated Diels–Alder reaction.
The theory behind ψ(r), that produces a Hofmeister series, is linked to the hydrophobic effect23 through the contribution of rotational correlations between dipoles and ions to the potential of mean force between species (see eqn (2) above and eqn (15) of Liu et al.23). This represents a general mechanism leading to specific ion effects that links in with hydrophobic phenomena. The calculations performed in this article for ψ(r) and ϕ(r) interactions all are based on the simulated explicit trajectories of water molecules surrounding each ion of interest. The only free parameter for these calculations is the pair potential used in the MD simulation. The results shown, based on interactions arising from dipole–ion and dipole–dipole correlations, therefore prove a mechanistic link between hydrophobic and Hofmeister effects.
3 Conclusions
The structural changes induced by ions in water have been investigated by MD simulations of various monatomic ions in SPC/E water, with radial distribution functions and orientational distributions reported. Strong ion–water correlation functions were found, the strength of which varies between different ions. The range of ion–water correlations was found to extend far past the first and second solvation shells around ions, demonstrating that an ion's presence is “felt” at large distances, upwards of 12 Å, from the ion's center. These correlation functions contribute to a stabilising free energy, the magnitude of which spans −17.6 kJ mol−1 for cesium to −175.2 kJ mol−1 for calcium. This stabilisation was found to far exceed the decrement in water–water interactions due to the ion's presence, demonstrating a real gain in solvation free energy from ion–water correlations.The main finding in this article is that when the ions are ordered with respect to the magnitude of this new free energy, a Hofmeister series emerges. The Hofmeister series ranks different ions on their ability to make solutes more or less hydrophobic (the Hofmeister effect). In comparing to other models for the solvation free energy of ions in water, the computational method presented here gives similar agreement to experimental solvation free energies. The results presented stem directly from pair correlation functions between thermally rotating dipole moments and each ion in solution, and the contribution of this correlation to the total free energy of the system. Most crucially, the pair correlations that lead to this Hofmeister effect also contribute to the hydrophobic effect,23 and those which dominate the hydrophobic effect are modulated by an ion's presence. This article has therefore demonstrated a molecular coupling between the Hofmeister and hydrophobic effects.
Acknowledgements
This research was supported by a grant from the Australian Research Council (Grant No. DP110103388), and by a grant of computer time from the Victorian Life Sciences Computation Initiative (Grant No. VR0252). The Australian Government is acknowledged for Australian Postgraduate Awards (QAB and ML). QAB gratefully acknowledges the University of Melbourne for receipt of the Albert Shimmins Award.References
- M. Chaplin, Nat. Rev. Mol. Cell Biol., 2006, 7, 861–866 CrossRef CAS PubMed.
- P. Lo Nostro and B. W. Ninham, Chem. Rev., 2012, 112, 2286–2322 CrossRef CAS PubMed.
- J. A. Rupley, E. Gratton and G. Careri, Trends Biochem. Sci., 1983, 8, 18–22 CrossRef CAS.
- K. D. Collins, Biophys. Chem., 2006, 119, 271–281 CrossRef CAS PubMed.
- B. Hribar, N. T. Southall, V. Vlachy and K. A. Dill, J. Am. Chem. Soc., 2002, 124, 12302–12311 CrossRef CAS PubMed.
- K. A. Dill, Biochemistry, 1990, 29, 7133–7155 CrossRef CAS PubMed.
- D. K. Eggers and J. S. Valentine, J. Mol. Biol., 2001, 314, 911–922 CrossRef CAS PubMed.
- Y. Zhang and P. S. Cremer, Curr. Opin. Chem. Biol., 2006, 10, 658–663 CrossRef CAS PubMed.
- N. Peruzzi, B. W. Ninham, P. Lo Nostro and P. Baglioni, J. Phys. Chem. B, 2012, 116, 14398–14405 CrossRef CAS PubMed.
- L. M. Pegram and M. T. Record, J. Phys. Chem. B, 2008, 112, 9428–9436 CrossRef CAS PubMed.
- H. Schott and A. E. Royce, J. Pharm. Sci., 1984, 73, 793–799 CrossRef CAS PubMed.
- J. Boisson, G. Stirnemann, D. Laage and J. T. Hynes, Phys. Chem. Chem. Phys., 2011, 13, 19895 RSC.
- D. Laage, G. Stirnemann, F. Sterpone, R. Rey and J. T. Hynes, Annu. Rev. Phys. Chem., 2011, 62, 395–416 CrossRef CAS PubMed.
- L. M. Pegram and M. T. Record, J. Phys. Chem. B, 2007, 111, 5411–5417 CrossRef CAS PubMed.
- W. J. Xie and Y. Q. Gao, J. Phys. Chem. Lett., 2013, 4, 4247–4252 CrossRef CAS PubMed.
- N. Schwierz, D. Horinek and R. R. Netz, Langmuir, 2010, 26, 7370–7379 CrossRef CAS PubMed.
- W. Kunz, P. Lo Nostro and B. Ninham, Curr. Opin. Colloid Interface Sci., 2004, 9, 1–18 CrossRef CAS.
- L. Yang, Y. Fan and Y. Q. Gao, J. Phys. Chem. B, 2011, 115, 12456–12465 CrossRef CAS PubMed.
- D. Horinek and R. R. Netz, Phys. Rev. Lett., 2007, 99, 226104 CrossRef PubMed.
- R. R. Netz and D. Horinek, Annu. Rev. Phys. Chem., 2012, 63, 401–418 CrossRef CAS PubMed.
- Y. Marcus, Chem. Rev., 2009, 109, 1346–1370 CrossRef CAS PubMed.
- R. L. Baldwin, Biophys. J., 1996, 71, 2056–2063 CrossRef CAS PubMed.
- M. Liu, Q. A. Besford, T. Mulvaney and A. Gray-Weale, J. Chem. Phys., 2015, 142, 114117 CrossRef PubMed.
- F. Hofmeister, Arch. Exp. Pathol. Pharmakol., 1888, 24, 1–30 Search PubMed.
- M. Cacace, E. Landau and J. Ramsden, Q. Rev. Biophys., 1994, 30, 241–277 CrossRef.
- D. F. Parsons, M. Boström, T. J. Maceina, A. Salis and B. W. Ninham, Langmuir, 2010, 26, 3323–3328 CrossRef CAS PubMed.
- Y. Zhang, S. Furyk, D. E. Bergbreiter and P. S. Cremer, J. Am. Chem. Soc., 2005, 127, 14505–14510 CrossRef CAS PubMed.
- R. Zangi, J. Phys. Chem. B, 2010, 114, 643–650 CrossRef CAS PubMed.
- L.-A. Näslund, D. C. Edwards, P. Wernet, U. Bergmann, H. Ogasawara, L. G. M. Pettersson, S. Myneni and A. Nilsson, J. Phys. Chem. A, 2005, 109, 5995–6002 CrossRef PubMed.
- S. Funkner, G. Niehues, D. A. Schmidt, M. Heyden, G. Schwaab, K. M. Callahan, D. J. Tobias and M. Havenith, J. Am. Chem. Soc., 2012, 134, 1030–1035 CrossRef CAS PubMed.
- A. W. Omta, M. F. Kropman and S. Woutersen, Science, 2003, 301, 347–349 CrossRef CAS PubMed.
- R. Mancinelli, A. Botti, F. Bruni, M. A. Ricci and A. K. Soper, Phys. Chem. Chem. Phys., 2007, 9, 2959–2967 RSC.
- K. J. Tielrooij, N. Garcia-Araez, M. Bonn and H. J. Bakker, Science, 2010, 328, 1006–1009 CrossRef CAS PubMed.
- J. T. O'Brien, J. S. Prell, M. F. Bush and E. R. Williams, J. Am. Chem. Soc., 2010, 132, 8248–8249 CrossRef PubMed.
- D. Paschek and R. Ludwig, Angew. Chem., 2011, 50, 352–353 CrossRef CAS PubMed.
- X. B. Wang, X. Yang, J. B. Nicholas and L. S. Wang, Science, 2001, 294, 1322–1325 CrossRef CAS PubMed.
- R. Kumar, J. R. Schmidt and J. L. Skinner, J. Chem. Phys., 2007, 126, 204107 CrossRef CAS PubMed.
- K. A. T. Silverstein, A. D. J. Haymet and K. A. Dill, J. Am. Chem. Soc., 2000, 112, 8037–8041 CrossRef.
- M. Born, Z. Phys., 1920, 1, 4548 Search PubMed.
- A. Rashin and B. Honig, J. Phys. Chem., 1985, 59, 5588–5593 CrossRef.
- T. T. Duignan, D. F. Parsons and B. W. Ninham, J. Phys. Chem. B, 2013, 117, 9421–9429 CrossRef CAS PubMed.
- W. R. Fawcett, J. Phys. Chem. B, 1999, 103, 11181–11185 CrossRef CAS.
- E. Verwey and J. T. Overbeek, Theory of the stability of lyophobic colloids: the interaction of sol particles having an electric double layer, Elsevier, New York, 1948 Search PubMed.
- I. Dzyaloshinskii, E. Lifshitz and L. Pitaevskii, Sov. Phys.-Usp., 1961, 73, 153–176 CrossRef.
- M. Boström, D. Williams and B. Ninham, Phys. Rev. Lett., 2001, 87, 168103 CrossRef PubMed.
- B. W. Ninham, Adv. Colloid Interface Sci., 1999, 83, 1–17 CrossRef CAS.
- B. W. Ninham and V. Yaminsky, Langmuir, 1997, 13, 2097–2108 CrossRef CAS.
- H. J. C. Berendsen, J. R. Grigera and T. P. Straatsma, J. Phys. Chem., 1987, 91, 6269–6271 CrossRef CAS.
- D. Paschek, J. Chem. Phys., 2004, 120, 6674–6690 CrossRef CAS PubMed.
- S. Koneshan, J. C. Rasaiah and S. H. Lee, J. Phys. Chem. B, 1998, 5647, 4193–4204 CrossRef.
- S. Nose, J. Chem. Phys., 1984, 81, 511–519 CrossRef CAS.
- W. G. Hoover, Phys. Rev. A: At., Mol., Opt. Phys., 1985, 31, 1695–1697 CrossRef.
- U. Essmann, L. Perera, M. L. Berkowitz, T. Darden, H. Lee and L. G. Pedersen, J. Chem. Phys., 1995, 103, 8577–8593 CrossRef CAS.
- J.-P. Ryckaert, G. Ciccotti and H. J. Berendsen, J. Comput. Phys., 1977, 23, 327–341 CrossRef CAS.
- C. Krekeler and L. D. Site, J. Phys.: Condens. Matter, 2007, 4, 192101 CrossRef.
- W. Kunz, Curr. Opin. Colloid Interface Sci., 2010, 15, 34–39 CrossRef CAS.
- S. H. Lee and J. C. Rasaiah, J. Phys. Chem., 1996, 100, 1420–1425 CrossRef CAS.
- T. Lazaridis and M. Paulaitus, J. Phys. Chem., 1992, 96, 3847–3855 CrossRef CAS.
- J. Hansen and I. McDonald, Theory of Simple Liquids, Academic Press, London, 3rd edn, 2006 Search PubMed.
- Y. Marcus, J. Chem. Soc., Faraday Trans., 1991, 87, 2995–2999 RSC.
- N. T. Southall, K. A. Dill and A. D. J. Haymet, J. Phys. Chem. B, 2002, 106, 521–533 CrossRef CAS.
- J. N. Israelachvili, Intermolecular and Surface Forces, Academic Press inc. Elsevier, London, 3rd edn, 2011 Search PubMed.
- T. T. Duignan, D. F. Parsons and B. W. Ninham, J. Phys. Chem. B, 2013, 117, 9412–9420 CrossRef CAS PubMed.
- L. Landau and E. Lifshitz, Course of Theoretical Physics: Volume 9: Statistical Physics, Pergamon Press Ltd, Oxford, 1981 Search PubMed.
- M. D. Tissandier, M. D. Tissandier, K. A. Cowen, K. A. Cowen, W. Y. Feng, W. Y. Feng, E. Gundlach, E. Gundlach, M. H. Cohen, M. H. Cohen, A. D. Earhart, A. D. Earhart, J. V. Coe, J. V. Coe, T. R. Tuttle Jr. and T. R. Tuttle Jr., J. Phys. Chem. A, 1998, 102, 7787–7794 CrossRef CAS.
- C. P. Kelly, C. J. Cramer and D. G. Truhlar, J. Phys. Chem. B, 2006, 110, 16066–16081 CrossRef CAS PubMed.
- E. Lifshitz and L. Pitaevskii, Statistical Physics, Part 2, Theory of the Condensed State, Butterworth-Heinemann, Amsterdam, 1st edn, 1980 Search PubMed.
- W. F. McDevit and F. A. Long, J. Am. Chem. Soc., 1952, 74, 1773–1777 CrossRef CAS.
- K. D. Collins and M. W. Washabaugh, Q. Rev. Biophys., 1985, 18, 323–422 CrossRef CAS PubMed.
- K. A. Dill and T. M. Truskett, Annu. Rev. Biophys. Biomol. Struct., 2005, 34, 173–199 CrossRef CAS PubMed.
- M. Geisler, T. Pirzer, C. Ackerschott, S. Lud, J. Garrido, T. Scheibel and T. Hugel, Langmuir, 2007, 29, 1741–1744 Search PubMed.
- C. J. Rizzo, J. Org. Chem., 1992, 57, 6382–6384 CrossRef CAS.
Footnote |
| † Electronic supplementary information (ESI) available: Details of calculations and RDF data. See DOI: 10.1039/c5cp05132k |
| This journal is © the Owner Societies 2016 |

