
 Open Access Article
 This Open Access Article is licensed under a
 Creative Commons Attribution 3.0 Unported Licence
The effect of hydrostatic pressure on model membrane domain composition and lateral compressibility†
H. M. G.
Barriga
*,
R. V.
Law
,
J. M.
Seddon
,
O.
Ces
and
N. J.
Brooks
*
Department of Chemistry, Imperial College London, UK. E-mail: nicholas.brooks@imperial.ac.uk; hanna.barriga@imperial.ac.uk
First published on 16th November 2015
Abstract
Phase separation in ternary model membranes is known to occur over a range of temperatures and compositions and can be induced by increasing hydrostatic pressure. We have used small angle X-ray scattering (SAXS) to study phase separation along pre-determined tie lines in dioleoylphosphatidylcholine (DOPC), dipalmitoylphosphatidylcholine (DPPC) and cholesterol (CHOL) mixtures. We can unequivocally distinguish the liquid ordered (Lo) and liquid disordered (Ld) phases in diffraction patterns from biphasic mixtures and compare their lateral compressibility. The variation of tie line endpoints with increasing hydrostatic pressure was determined, at atmospheric pressure and up to 100 MPa. We find an extension and shift of the tie lines towards the DOPC rich region of the phase diagram at increased pressure, this behaviour differs slightly from that reported for decreasing temperature.
Introduction
Biological membranes are highly dynamic systems comprised of a broad range of lipids and proteins. Globally, the most abundant lipids in biological membranes are phospholipids,1 however, cholesterol is also an extremely important component, with concentrations in vivo thought to reach as high as 30–40 mol% in the plasma membrane.2 A key aspect of the ability of biological membranes to self-regulate is their propensity for clustering and lateral organisation which is thought to facilitate a range of processes from membrane trafficking to cell signalling.3,4 Examples include immunoglobulin E signalling during the allergic immune response,5 T-cell antigen receptor signalling and increased local concentrations of ceramide being linked to cell apoptosis.6,7 There has been much debate on the origins, sizes and relative timescales of these different processes highlighting the complexities of biological membranes.8–11Model membranes provide a useful tool for understanding how small changes in physical parameters can alter the interactions within simple lipid systems and drive phase separation. This has been extensively studied in both bulk12 and vesicular based lipid systems,13–18 which generally correspond well to each other. These model membranes are commonly ternary mixtures composed of cholesterol, a lipid with a high melting temperature (Tm) and a low Tm lipid. Under suitable conditions such mixtures can phase separate into two coexisting fluid phases – a liquid ordered phase (Lo) and a liquid disordered phase (Ld). The Lo phase is usually rich in cholesterol and the high Tm lipid, and exhibits increased conformational order in the hydrocarbon chain region.19,20 The compositional differences between the Lo and Ld phases result in a different bilayer thickness for each phase.21 Previous studies have shown the effects of bilayer thickness on membrane protein activity and conformation.22–24 An exciting potential application of switchable phase separated systems is the potential for changing bilayer thickness to control membrane protein conformation and hence activity.
Interestingly, hydrostatic pressure can be used both to control phase separation in ternary lipid mixtures18,25 and to change the thickness of lipid bilayers.26 Moderate pressures (up to several hundred MPa) usually do not significantly change the structure of proteins.
The phase behaviour of mixtures containing dioleoylphosphatidylcholine (DOPC), dipalmitoylphosphatidylcholine (DPPC) and cholesterol (CHOL) has been extensively mapped both in temperature and compositional space. Broadly the phase diagram at 25 °C consists of a two phase region (liquid ordered (Lo)–liquid disordered (Ld)) coexistence bounded by single phases.14 A region of three phase coexistence has also been reported including a solid ordered phase.27 The boundary of the two phase region is known to be strongly influenced by both temperature and composition,28 however much less is known about the influence of pressure on the two phase region. The boundary of this region can be mapped by finding the endpoints of tie lines within the two phase region. Along a tie line, the compositions of the Lo and Ld phases are invariant, with only the relative amounts of the two phases changing. Recent work using lamellar lipid mesophases has shown that the Lo and Ld domains in phase separated mixtures tend to align between bilayers creating ‘stacks’ of Lo and Ld phases.12,21 This long range alignment, enables their characterisation using small angle X-ray diffraction (SAXS) as two distinct repeat distances can be detected when phase separation occurs in these systems.
While SAXS data from phase separated lipid systems show two distinct sets of lamellar diffraction peaks and hence two lattice parameters, assigning the peaks to the Lo and Ld phases can be difficult. Previously, Uppamoochikkal et al. determined the lattice parameters of oriented bilayers of DOPC:DPPC:CHOL at differing hydrations to find mixtures situated along the same tie lines.21 The Lo and Ld lattice parameters were assigned based on the relative intensities of the two sets of diffraction peaks and the position of the mixtures within the phase diagram. However, Jeworrek et al.25 determined the variation of the two lattice parameters with increasing pressure and assigned these to the Lo and Ld phases based on the expected compressibility of the Lo and Ld phases, assuming that the Ld phase is likely to be more compressible than the Lo phase, due to the increased chain ordering within the Lo phase. Notably, these two approaches give different assignments of the Lo and Ld lattice parameters.
We have combined these approaches to assign the Lo and Ld lattice parameters using samples prepared along known tie lines, determined the response of these structures to hydrostatic pressure and so mapped changes in the tie line endpoints with pressure.
Pressure is a useful tool for studying the phase behaviour of lipid systems.26,29 Often, phase transitions induced by a decrease in temperature can be triggered by an increase in pressure. Pressure has been used extensively to study the mechanisms and kinetics of lipid phase transitions involving changes in interfacial curvature30 and there has been some previous work investigating the effects of pressure on the more subtle lipid structural transitions involved in liquid–liquid phase separation within ternary lipid bilayer systems.18,25 However it is important to note that the effects of temperature and pressure are not directly opposite; decreasing temperature decreases the proportion of chains that can access higher rotomeric energy levels, while increasing pressure increases the energy gap between rotomeric levels, reducing the occupancy of higher energy levels.31 Increasing hydrostatic pressure on lipid model membranes increases the conformational order in the hydrocarbon chain region. The bulk modulus (volume compressibility) of the lipid chains is relatively high, so there is little variation in the chain volume at the pressures used here and the overall effect of pressure is to cause a lateral compression and longitudinal extension of the lipid chains, and so a thickening of the bilayer.29,32
Recently, Heftberger et al.33 have determined the structure and fluctuation of Lo–Ld phases and the effects on tie lines at different temperatures, however, while increasing hydrostatic pressure is known to trigger Lo–Ld phase separation, there is little known about changes of the Lo–Ld phase composition with pressure. We have been able to assign the two sets of SAXS diffraction peaks from randomly oriented phase separated lamellar lipid mixtures to the Lo and Ld phases by measuring the diffraction intensities from samples prepared along tie lines previously determined for ternary mixtures of DOPC:DPPC:CHOL.27 We have subsequently been able to measure the change in lattice parameter of the Lo and Ld phases in response to hydrostatic pressure and map the change in the tie line end points over a range of pressures from atmospheric pressure to 100 MPa.
Experimental
Materials
1,2-Dioleoyl-sn-glycero-3-phosphocholine (DOPC), 1,2-dipalmitoyl-sn-glycero-3-phosphocholine (DPPC) and cholesterol (ovine, wool) (chol) were purchased from Avanti Polar Lipids (AL, USA) as lyophilised powders. The lipids had a purity of >98% and were used without further purification, but were lyophilised for 12 hours before use to ensure they were fully dry.Lipid mixture preparation
Lipid mixtures were prepared by co-dissolving appropriate masses of lipid in chloroform (Sigma Aldrich, Gillingham, UK). The mixtures were dried under a stream of nitrogen gas for 3 hours and then under vacuum for a minimum of 12 hours, after which they were sealed and stored at −20 °C before use. Samples were hydrated in HPLC grade water (VWR, UK) to 70 wt% water. After hydration, each sample was heat cycled (between approximately −200 °C and 60 °C) a minimum of ten times.Small angle X-ray diffraction (SAXS)
SAXS patterns were measured at Diamond Light Source using beamline I22. Diffraction patterns were collected using an X-ray wavelength of 0.69 Å and a sample to detector distance of 1.2 m. Samples were contained in Teflon sample holders with mylar windows and then pressurised using the custom built high pressure cell available at beamline I22.34 The phase separation of the samples was mapped at 25 °C between atmospheric pressure and 200 MPa for samples containing DOPC![[thin space (1/6-em)]](https://www.rsc.org/images/entities/char_2009.gif) :DPPC:CHOL with molar ratios of 42.5:42.5:15, 26.03:52.07:21.9, 57:34:9, 16:58:26, 40:40:20, 60:29:11, 15:55:31 and at 43 °C, 55 °C and 0–200 MPa for the sample containing DOPC:DPPC:CHOL 40:40:20. Molar ratios were selected based on existing tie line data from Veatch et al.27 A sample set of diffraction patterns showing the variation in peak intensity with pressure is shown for DOPC:DPPC:CHOL 60:29:11 at 25 °C in Fig. 1.
:DPPC:CHOL with molar ratios of 42.5:42.5:15, 26.03:52.07:21.9, 57:34:9, 16:58:26, 40:40:20, 60:29:11, 15:55:31 and at 43 °C, 55 °C and 0–200 MPa for the sample containing DOPC:DPPC:CHOL 40:40:20. Molar ratios were selected based on existing tie line data from Veatch et al.27 A sample set of diffraction patterns showing the variation in peak intensity with pressure is shown for DOPC:DPPC:CHOL 60:29:11 at 25 °C in Fig. 1.
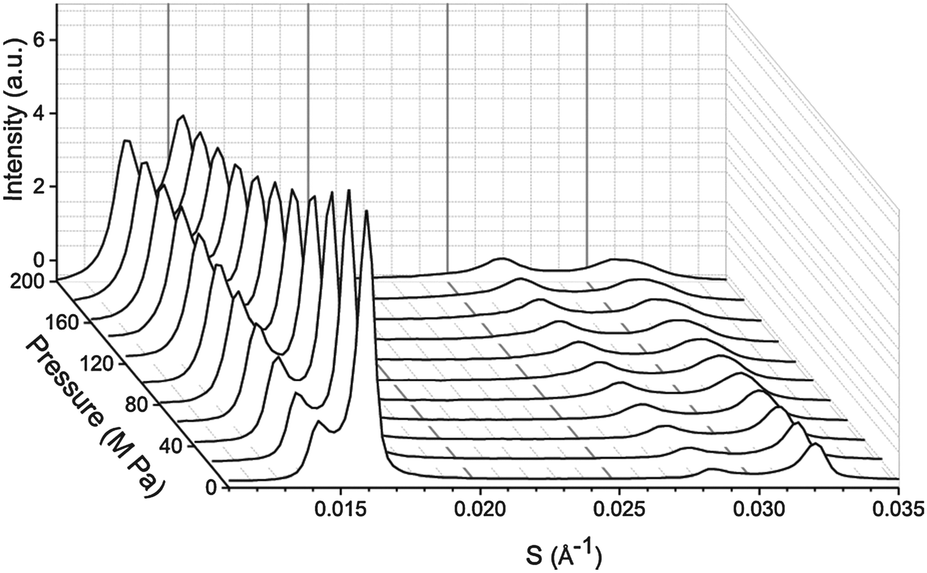 | ||
| Fig. 1 Example diffraction patterns from DOPC:DPPC:CHOL 60:29:11 at 25 °C from 0–200 MPa in 20 MPa steps. Note the change in the diffraction pattern is reversible upon releasing the pressure and allowing the sample to re-equilibrate. | ||
Data fitting
SAXS data was analysed using AXcess (an in house developed software package) to find lattice parameters30 and a custom built LabVIEW based programme was used to fit single or double pseudo-Voigt functions to the diffraction peaks as appropriate. The pseudo-Voigt fits enabled accurate mapping of the diffraction peak areas as a function of DOPC, DPPC and CHOL concentration at each pressure and temperature studied. The normalised peak areas from samples lying along the same tie line were used to determine the ‘zero diffraction intensity’ composition for each phase (which correspond to the tie line end points) by linear extrapolation of the composition – peak intensity data (see ESI† for full details). Fig. 2a shows an example diffraction pattern for sample DOPC:DPPC:CHOL 42.5:42.4:15 mol%, with the corresponding double pseudo-Voigt fit shown in Fig. 2b. We assume that the directions of the tie lines do not change significantly within the pressure range studied here. Previous studies on the effects of increasing temperature have shown an approximately 2° change in the orientation of the tie line of a ternary mixture of DOPC, DPPC and cholesterol between 15 °C and 30 °C. The majority of these changes occur between 25 °C and 30 °C with little change seen between 15 °C and 20 °C. Based on this we assume that a pressure increase of 100 MPa is unlikely to lead to more than a few degrees change in the tie line orientation.21 This is significant but as calculated previously,33 unlikely to affect the endpoints of the tie lines more than ±3%, hence the assumption that the tie line orientation remains constant with increasing pressure.
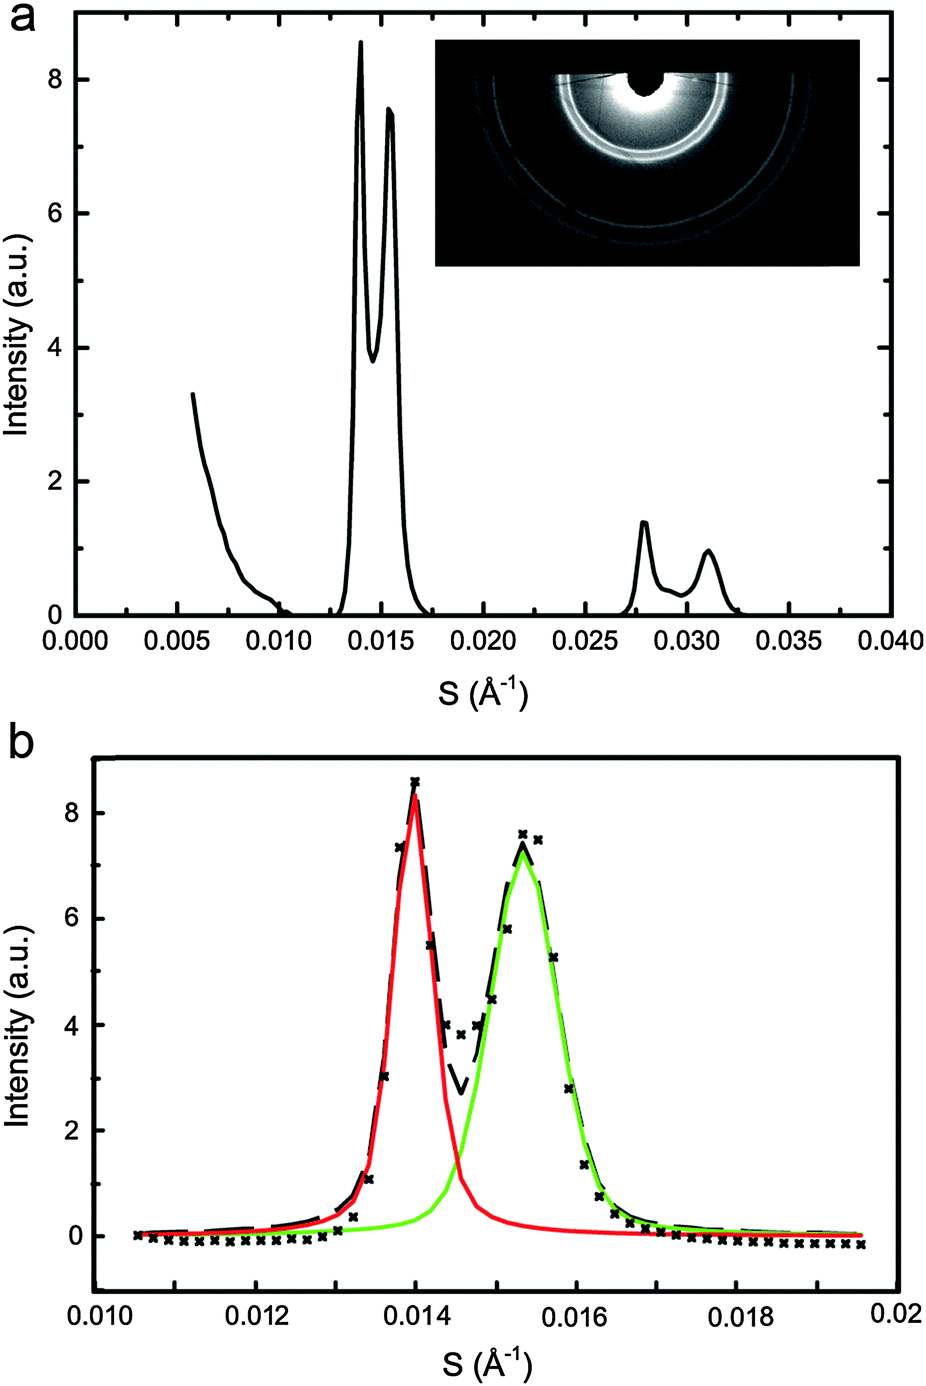 | ||
| Fig. 2 DOPC:DPPC:CHOL 42.5:42.5:15 mol% at 25 °C, 0 MPa showing (a) integrated diffraction pattern with the raw image (inset) (b) double pseudo-Voigt fitting of first order peak of the diffraction pattern with (×) raw data, (---) fit, (solid line) individual peak fits. | ||
Plots demonstrating the errors in the tie line endpoint compositions have been included in the ESI,† (Fig. S2). These show a clear trend in the pressure range 0–100 MPa. At 100 MPa, the tie lines have reached the edge of the phase diagram and the doublets become more difficult to resolve at the endpoints, leading to an increase in the errors. For lattice parameter determination, both the first and second order diffraction peaks were used, however for the tie line endpoint calculations only the first order diffraction peaks were used due to their significantly higher intensity relative to the second order peaks.
Results
The effects of increasing hydrostatic pressure on single phase and phase separated ternary mixtures of DOPC:DPPC:CHOL was determined using high-pressure SAXS. Using AXcess, the diffraction peaks for each sample were indexed for phase assignment and to determine the lattice parameter. All samples exhibited a lamellar morphology and hence bilayer structure. The lattice parameters of the Lo and Ld phases were assigned by comparing compositions along known tie lines.DOPC:DPPC:CHOL 40:40:20 mol%, exhibits phase separation at 25 °C but shows a single phase at 43 °C, however, increasing the pressure induced phase separation at 43 °C, as shown in Fig. 3. Increasing pressure in 40 MPa steps from 0 to 200 to 0 MPa showed induction of phase separation in this mixture at 40–80 MPa at 43 °C and 80–120 MPa at 53 °C as shown in Fig. 4. At pressures where phase separation is observed, there are two distinct sets of diffraction peaks and so two lattice parameters. One of these lattice parameters shows an increase of ∼5 Å at 43 °C between 80 and 200 MPa and ∼4 Å at 53 °C between 120 and 200 MPa, with the other showing little variation with pressure at both temperatures. Notably this phase separation is reversible. However, this data was not sufficient to assign these lattice parameters to the Lo and Ld phases.
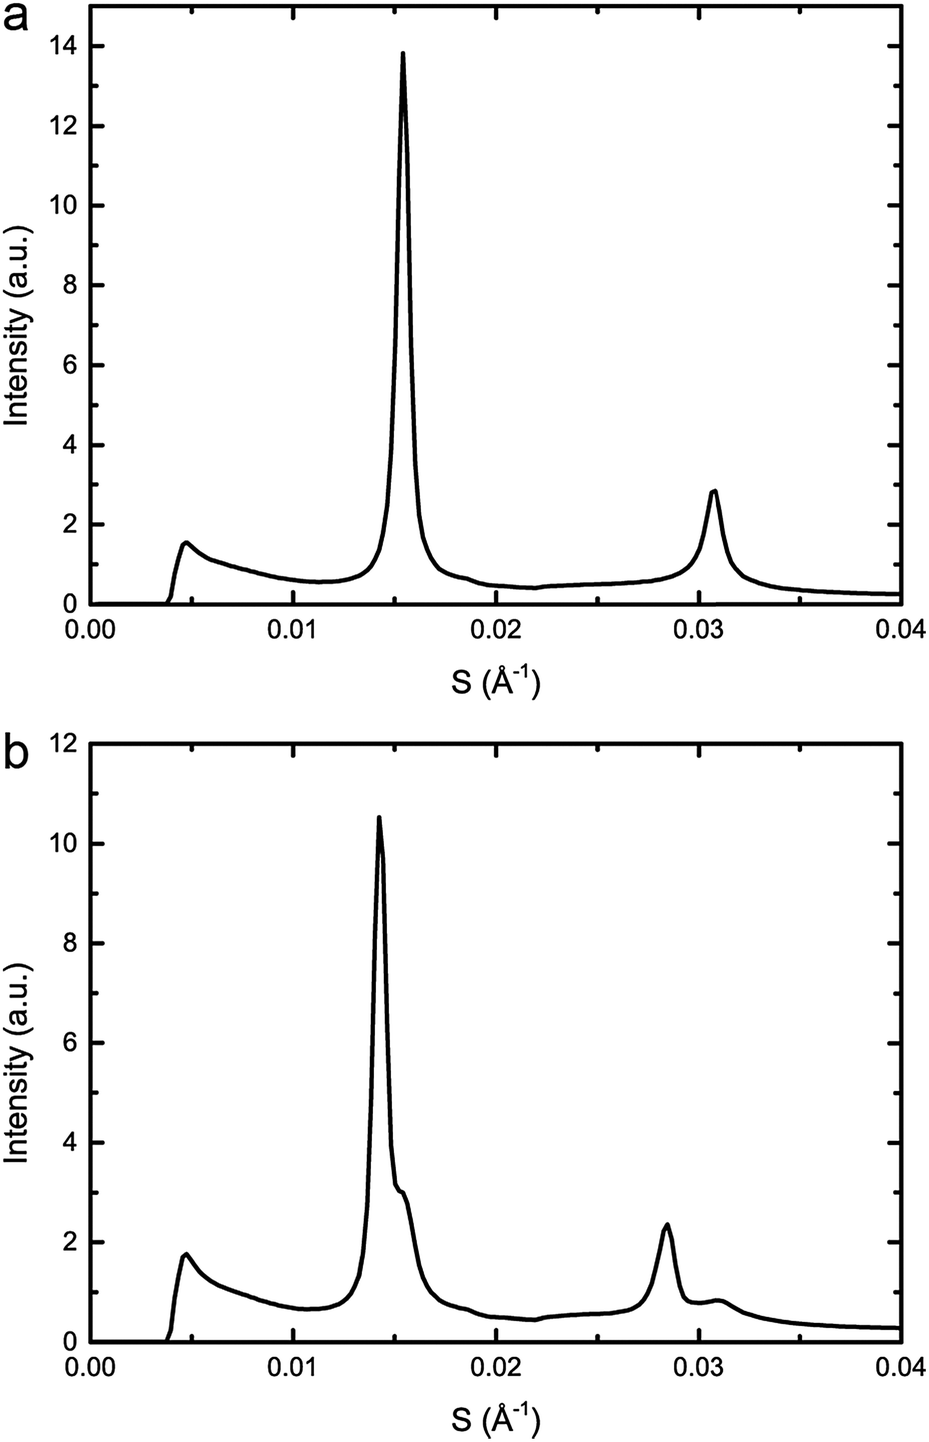 | ||
| Fig. 3 Example diffraction patterns of DOPC:DPPC:CHOL 40:40:20 mol% at 43 °C and (a) 0 MPa (b) 200 MPa, showing phase separation upon increased pressure. | ||
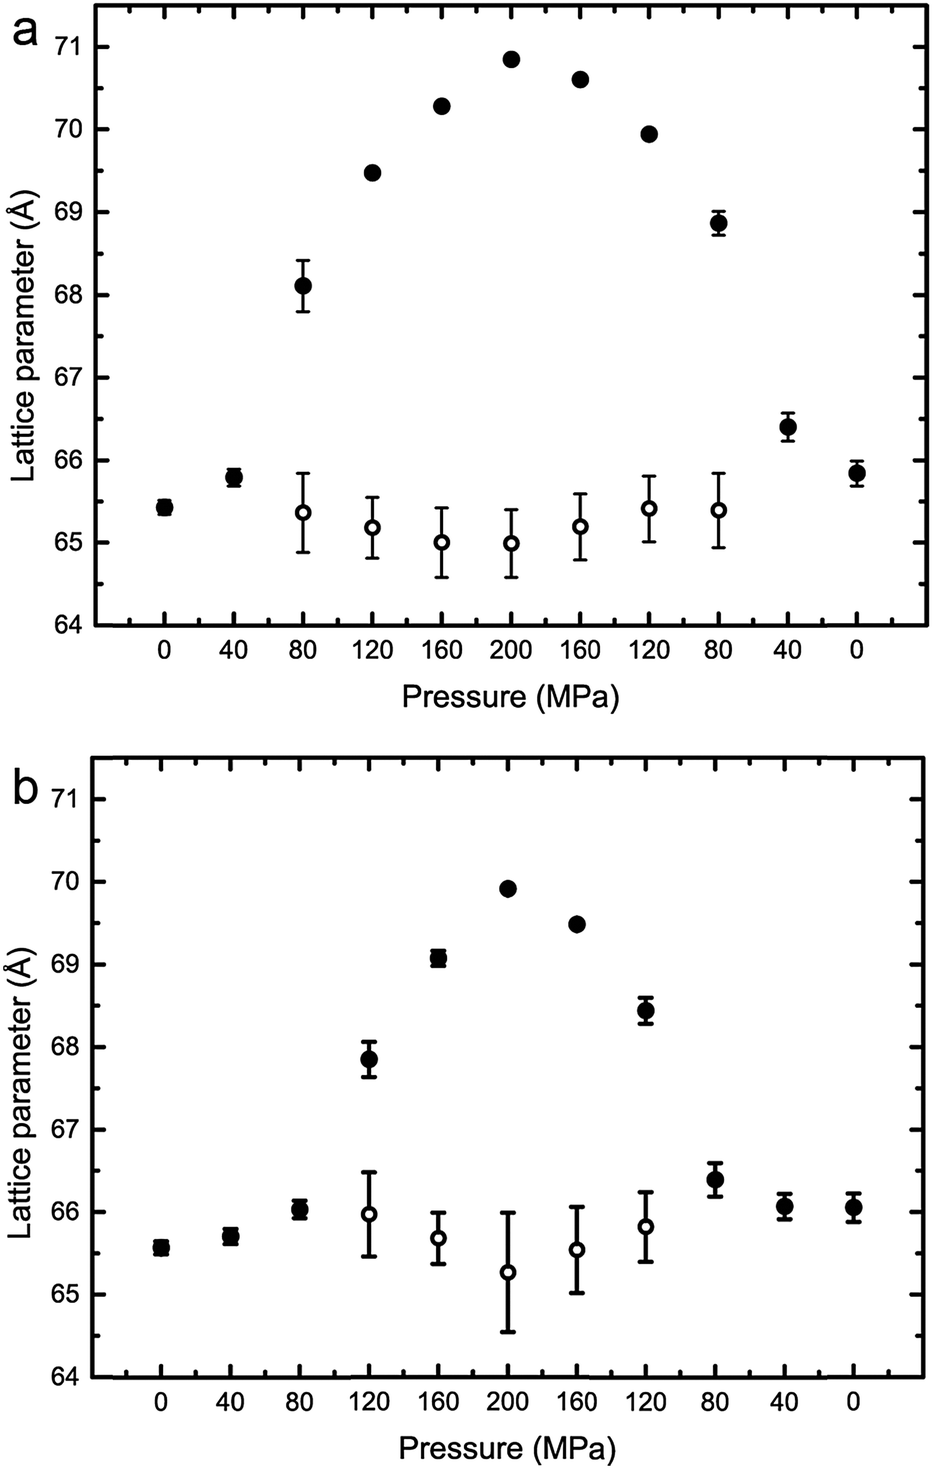 | ||
| Fig. 4 Lattice parameters for DOPC:DPPC:CHOL 40:40:20 mol% at (a) 43 °C (b) 53 °C. Note where only one lattice parameter is shown at any particular pressure, denotes a single mixed phase. | ||
To assign the Lo and Ld lattice parameters, the relative intensities of the two sets of diffraction peaks from phase separated mixtures known to lie along tie lines previously determined at 25 °C and 0 MPa were characterised. Diffraction peaks from the Lo and Ld phases (which are cholesterol rich and poor respectively), varied significantly in intensity along the tie lines enabling assignment of the peaks as shown in Fig. 5. The diffraction patterns for samples 4 and 7 show two first order peaks, one with high intensity at ∼0.014 Å−1 and one with lower intensity at ∼0.016 Å−1, corresponding to lattice parameters of ∼70 Å and 63 Å respectively.
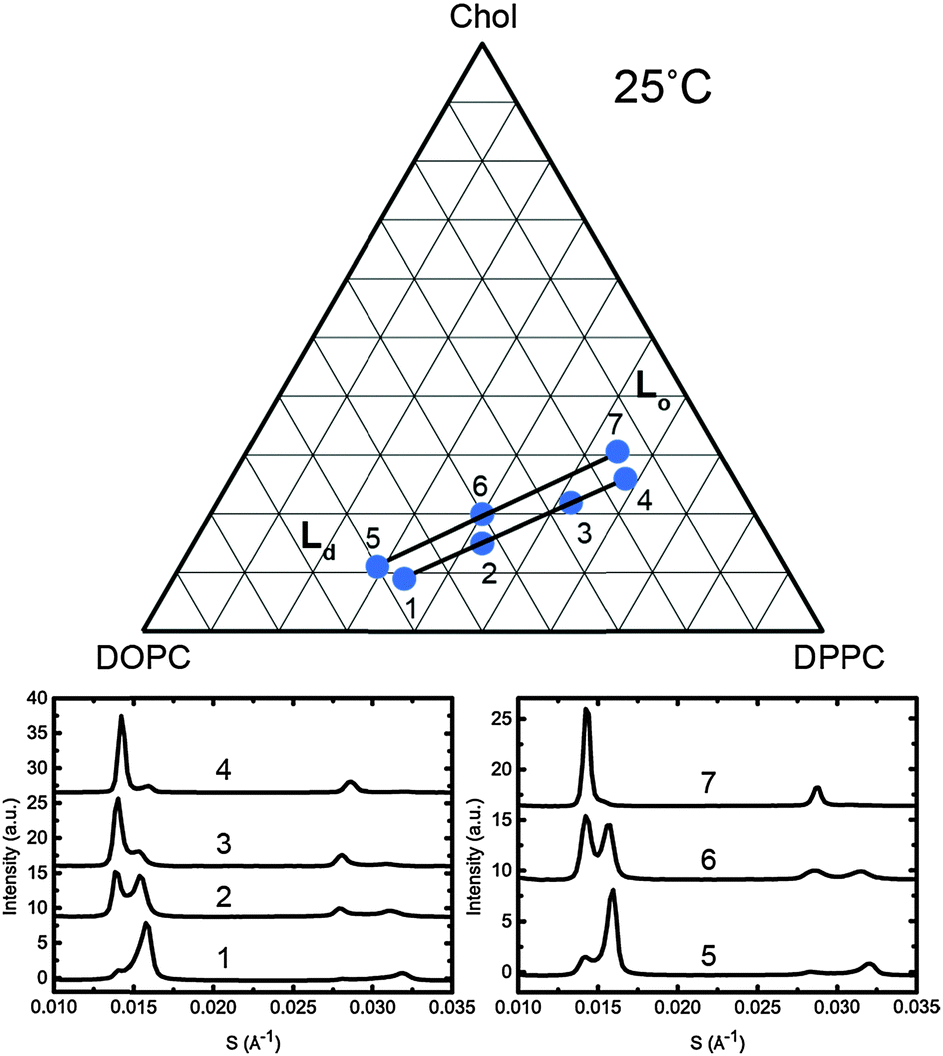 | ||
| Fig. 5 Diffraction patterns of samples at 25 °C along two individual tie lines (below, left and right) with the samples shown on a phase diagram with the tie lines drawn in as a guide (above). | ||
At the opposite ends of the tie lines, samples 1 and 5 show peaks in the same position but with the intensities reversed. The cholesterol rich Lo phase must give rise to the diffraction peak with the highest intensity at the cholesterol rich end of the tie line (samples 4 and 7) and hence can be assigned to the 70 Å lattice parameter. Conversely, the 63 Å lattice parameter must correspond to the Ld phase. Notably in Fig. 5, sample 1 shows evidence of a third phase being present. Using AXcess, sample 1 was indexed to 3 distinct lamellar phases observed as a peak broadening in the first order diffraction peaks and resolved as three individual peaks in the second order diffraction peaks. This has previously been identified as the solid ordered phase27 and the assigned lattice parameter is in good agreement with previous literature.25 We attribute the presence of this third phase to having just crossed over into the three component phase region which lies below the two phase region and where the solid ordered (so) phase exists in coexistence with the Lo and Ld phases. Because of this, sample 1 was excluded from the tie line endpoint determination fits.
The variation of the lattice parameters in samples 1–7 at 25 °C and pressures between 0 and 200 MPa is shown in Fig. 6 and 7. All samples showed phase separation at 25 °C with sample 1 (Fig. 6a) showing three phases. This third phase was not observed at higher pressures, this may be due to a subtle change in shape of the three phase region at higher pressure, or because of the relatively weak intensity of the so peak falling below the detection limit of the experiment.
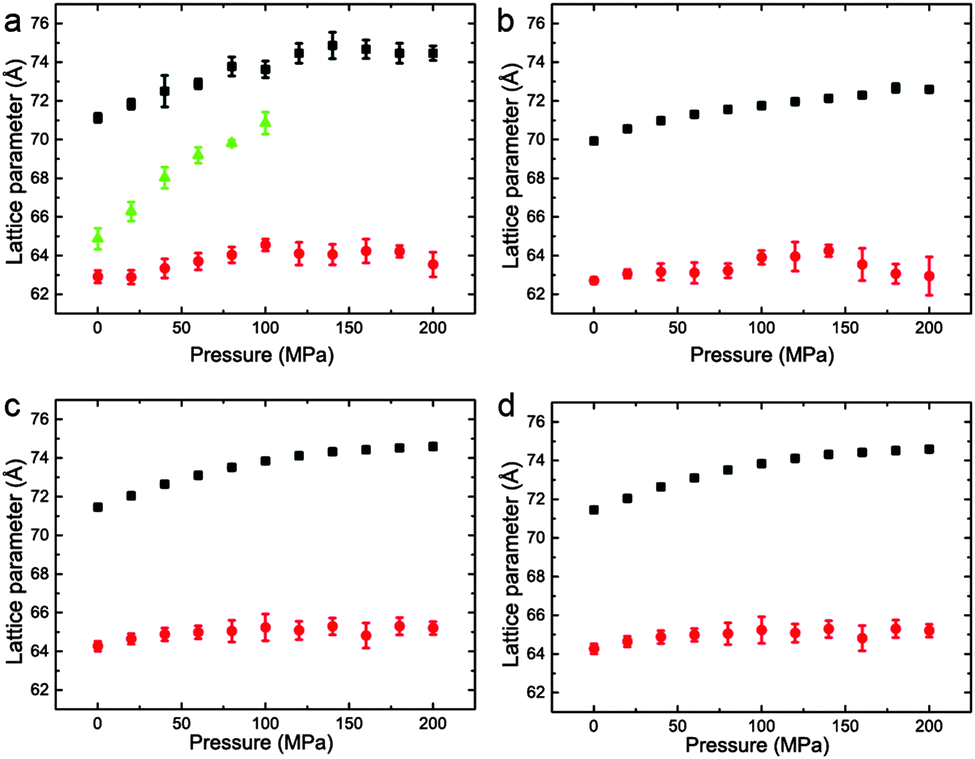 | ||
| Fig. 6 Lattice parameters for phase separated mixtures of DOPC:DPPC:CHOL at 25 °C and 0–200 MPa (samples 1–4) in (a) 57:34:9 mol% (b) 42.5:42.5:15 mol% (c) 26.03:52.07:21.9 mol% (d) 16:58:26 mol%. | ||
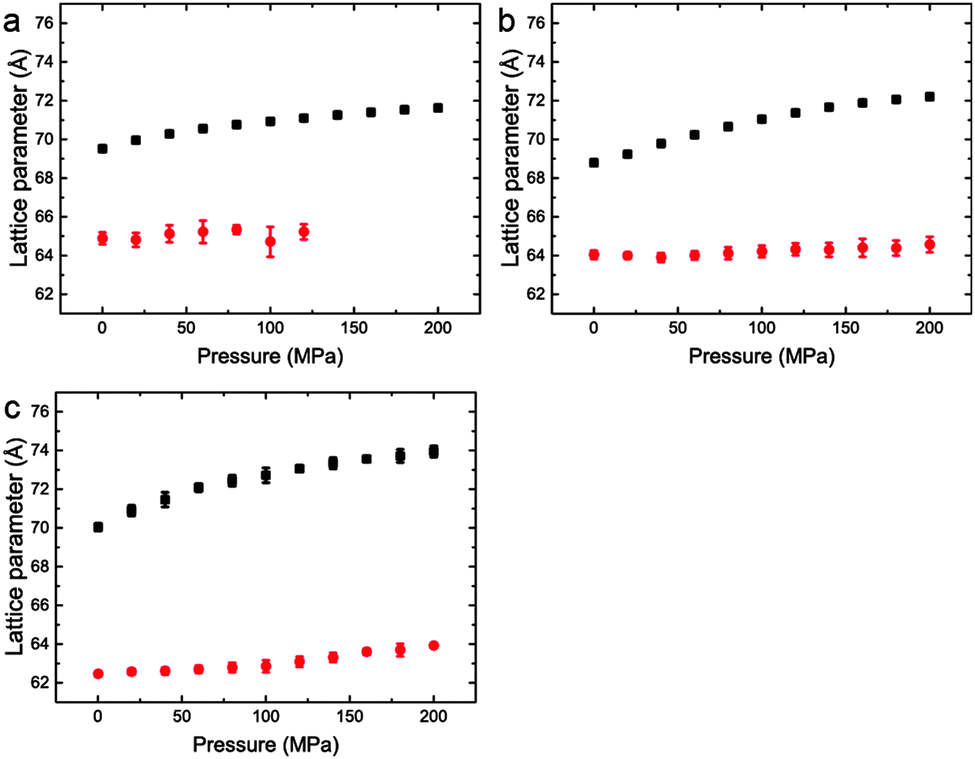 | ||
| Fig. 7 Lattice parameters for phase separated mixtures of DOPC:DPPC:CHOL at 25 °C and 0–200 MPa (samples 5–7) in (a) 60:29:11 mol% (b) 40:40:20 mol% (c) 15:55:31 mol%. | ||
Interestingly, the Lo phase shows an increase in lattice parameter of 3–5 Å over a 200 MPa increase at 25 °C, whilst the Ld phase only shows an increase of 1 Å. This is even more pronounced in Fig. 4 where the phase separation is induced using pressure; the Ld phase shows little change in lattice parameter after phase separation while the Lo phase shows an increase of ∼5 Å after phase separation.
The changes in the tie line endpoints at high pressure were calculated using the experimental peak intensities and sample compositions. The results are shown in Fig. 8 with the absolute numbers calculated shown in the ESI† in Tables S1 and S2. As the pressure increases from 0 to 100 MPa, there is an extension of the Ld end of the tie lines towards higher DOPC compositions, whilst the Lo end exhibits little change, with only a small movement towards increased DOPC. Previous studies on the variation of the two phase region with temperature have found a decrease in the area of the two phase region with increasing temperature.27 Again, the major movement of the two phase boundary is from the DOPC rich Ld side, however there is a small movement of the Lo side towards higher DOPC at increased temperature. Interestingly the effects of increasing pressure and reducing pressure are similar for the Ld end of the tie lines but subtly different for the Lo end.
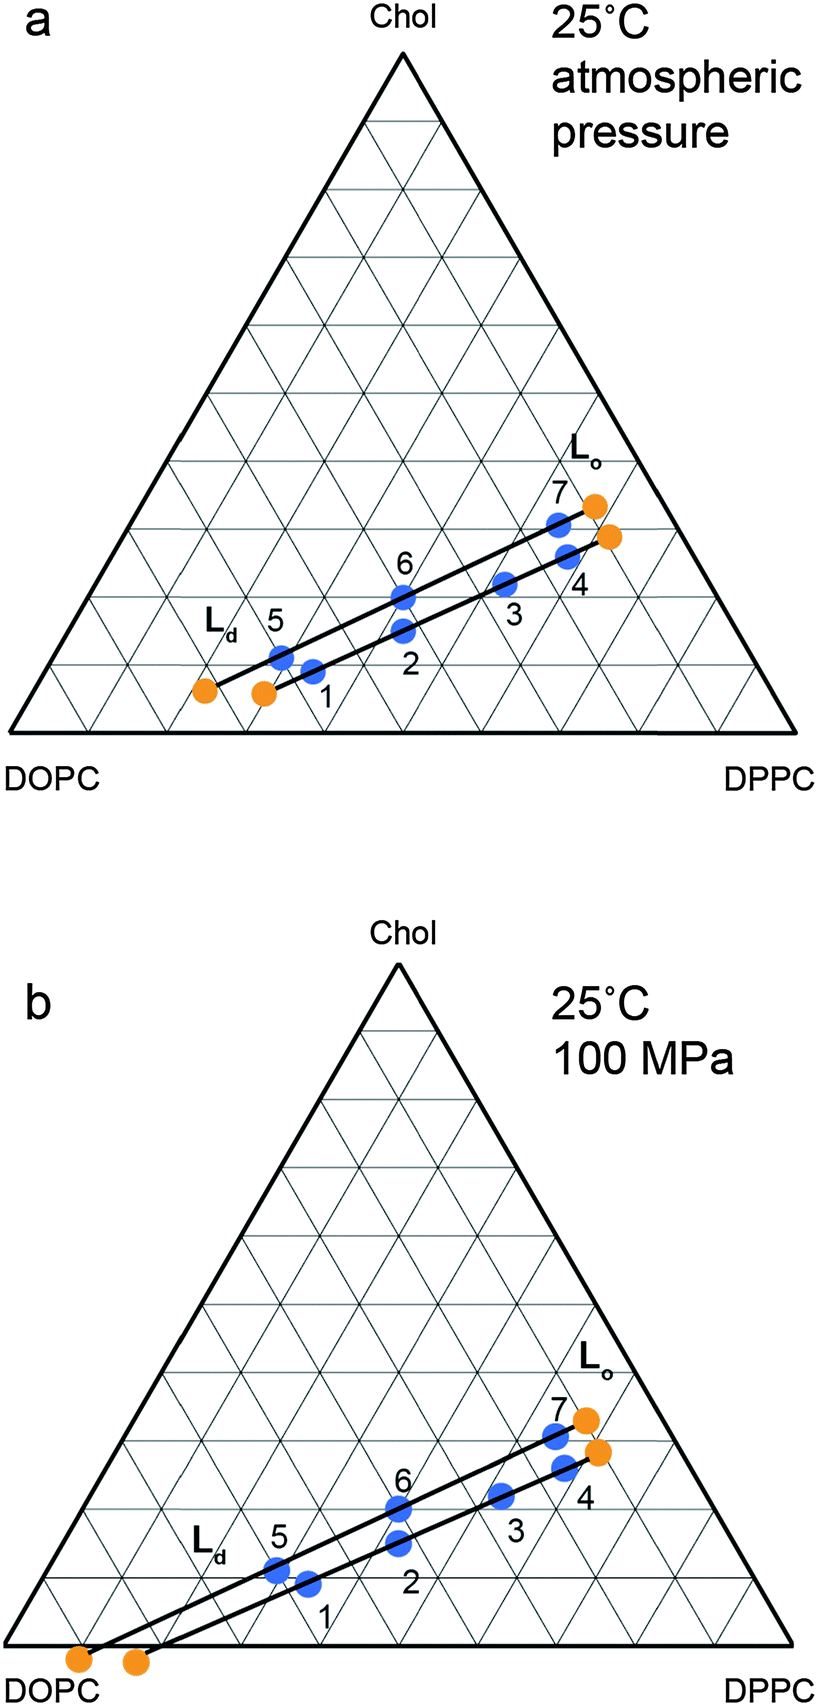 | ||
| Fig. 8 Calculated tie line endpoints at (a) atmospheric pressure (b) 100 MPa with numbered points denoting independent samples measured and tie line endpoints marked in orange with tie lines drawn as a guide. Errors are of the order of ±5 mol% (full details ESI,† Fig. S2). | ||
Discussion
In this ternary system the Lo phase has a larger lattice parameter than the Ld phase, despite the fact the Lo phase at 25 °C, atmospheric pressure is rich in DPPC which has shorter hydrocarbon chains than DOPC. The Ld phase is DOPC rich and contains significantly less cholesterol than the Lo phase. Cholesterol is well known for increasing the ordering of hydrocarbon chains19,20,35 and has been observed to cause bilayer thickening.26 The higher lattice parameter of the Lo phase compared to the Ld phase, implies that its higher degree of chain ordering is sufficient for the DPPC 16 carbon chains to exceed the length of the DOPC 18 carbon chains. The chain length in DOPC and DPPC only differs by two carbons and if this mismatch were greater (for example replacing DPPC with DMPC which has a 14 carbon chain), the increase in ordering may not be sufficient for the Lo phase to still exhibit the larger lattice parameter.Previous work25 has suggested that the liquid disordered (Ld) lipid phase would be expected to have a larger lateral compressibility (and so show greater bilayer thickening under pressure) than the Lo phase due to its greater hydrocarbon chain disorder. We find that with a pressure increase of 200 MPa, the lattice parameter of the Lo phase increases by 5 Å, in contrast to the Ld phase which shows a relatively small increase (approximately 1 Å) over the same pressure range. The lattice parameters are the sum of the bilayer thickness and the interstitial water layer and therefore, these results could imply that the Lo bilayer regions increase in thickness more than the Ld regions. The effects of increasing pressure are often qualitatively compared to decreasing temperature and at a phase transition can be described by the Clapeyron equation.36 This system is not at a phase boundary and therefore the free energy for a structural change is not zero so temperature and pressure cannot be quantitatively compared, however a general rule of thumb indicates that changes in the lattice parameter observed over a 100 MPa pressure increase are comparable to a change in temperature of approximately 22 °C.26
Previous work has shown a small increase in both the bilayer thickness and water layer thickness of the Lo phase with decreasing temperature.33 However, over the same temperature range there was no clear trend for the bilayer thickness of the Ld phase and a small decrease in water layer thickness. Small changes in the area per lipid in the Lo and Ld phases as a function of temperature were also observed. This highlights the need for extensive investigation to decouple the water rearrangement and bilayer thickness in the Lo and Ld phases with increasing pressure, which is the subject of a separate investigation. However, the changes in water layer thickness described as a function of temperature33 are smaller than those reported here, suggesting a change in bilayer thickness in addition to the water rearrangement.
Generally, an increase in pressure increases ordering in the hydrocarbon chain region, increasing the lattice parameter. However, recent studies37 have shown that the effects of pressure on lattice parameters can be a complex interplay between different interactions within the membrane. The incorporation of cholesterol led to a greater decrease in lattice parameter with increasing pressure in a ternary lipid system containing monoolein, a charged lipid and cholesterol. This was attributed initially to cholesterol decreasing the sensitivity of the hydrocarbon chains to hydrostatic pressure,38,39 followed by a change in electrostatics. Here, no such electrostatic interactions are present and the lattice parameter change is not curvature driven, hence the potential differences in compressibility between the Lo and Ld phases must be solely due to their compositional differences and how these lipids interact with cholesterol. DOPC contains two double bonds in the hydrocarbon chain region, whilst the DPPC is fully saturated. This will lead to a significant difference in the steric volume of the two chain regions and also their ability to pack. Previously reported values for the area per lipid and also volume per lipid show that the area and volume of DOPC in the fluid lamellar phase is larger than that for DPPC, despite their identical headgroups.40 Simulations of DOPC with cholesterol41 and DPPC with cholesterol42 have also shown that cholesterol causes a larger reduction in the molecular area of DPPC than DOPC, implying a greater ability to pack and hence potentially a greater lateral compressibility as observed here.
With increasing pressure, there is an extension of the tie lines towards the Ld region with increased DOPC and decreased DPPC concentration, but there is little change in the Lo end. Whilst it is possible that the orientation of the tie lines may vary with pressure, the small variation in the Ld and Lo lattice parameters between samples prepared on the same atmospheric pressure tie line indicates that any changes are small. While the changes in the Lo phase composition are small, the effect of increasing pressure differs subtly from that observed with decreasing temperature; increasing pressure causes a small increase in DOPC incorporation into the Lo phase, whereas decreasing temperature causes the Lo phase to become slightly richer in DPPC and cholesterol.
Conclusions
We have demonstrated the effects of hydrostatic pressure on tie lines of ternary lipid mixtures. Increasing pressure from 0 to 100 MPa increased the size of the two phase region, with an extension towards higher DOPC concentrations. By assigning the Lo and Ld lattice parameters, we have shown that the Lo phase is more laterally compressible than the Ld phase; the Lo phase shows a significant increase in lattice parameter with increasing pressure whereas the Ld phase shows little variation. This offers the exciting potential of using pressure to induce phase separation in model membranes and subsequently tuning the bilayer thickness of the different phases to influence protein conformation.Acknowledgements
This work was supported by EPSRC Programme grant EP/J017566/1. We acknowledge Diamond Light Source for provision of synchrotron beamtime and we would like to thank Dr Andy Smith for assistance using beamline I22.Notes and references
- H. T. McMahon and J. L. Gallop, Nature, 2005, 438, 590–596 CrossRef CAS PubMed.
- G. Van Meer, Annu. Rev. Cell Biol., 1989, 5, 247–275 CrossRef CAS PubMed.
- K. Simons and E. Ikonen, Nature, 1997, 387, 569–572 CrossRef CAS PubMed.
- M. Edidin, Annu. Rev. Biophys. Biomol. Struct., 2003, 32, 257–283 CrossRef CAS PubMed.
- K. Simons and D. Toomre, Nat. Rev. Mol. Cell Biol., 2000, 1, 31–39 CrossRef CAS PubMed.
- B. Stancevic and R. Kolesnick, FEBS Lett., 2010, 584, 1728–1740 CrossRef CAS PubMed.
- B. J. Pettus, C. E. Chalfant and Y. A. Hannun, Biochim. Biophys. Acta, 2002, 1585, 114–125 CrossRef CAS.
- E. Sezgin, I. Levental, M. Grzybek, G. Schwarzmann, V. Mueller, A. Honigmann, V. N. Belov, C. Eggeling, U. Coskun, K. Simons and P. Schwille, Biochim. Biophys. Acta, 2012, 1818, 1777–1784 CrossRef CAS PubMed.
- T. Bhatia, P. Husen, J. H. Ipsen, L. A. Bagatolli and A. C. Simonsen, Biochim. Biophys. Acta, 2014, 1838, 2503–2510 CrossRef CAS PubMed.
- A. Honigmann, V. Mueller, H. Ta, A. Schoenle, E. Sezgin, S. W. Hell and C. Eggeling, Nat. Commun., 2014, 5, 5412 CrossRef CAS PubMed.
- D. A. Brown and E. London, Annu. Rev. Cell Dev. Biol., 1998, 14, 111–136 CrossRef CAS PubMed.
- L. Tayebi, Y. Ma, D. Vashaee, G. Chen, S. K. Sinha and A. N. Parikh, Nat. Mater., 2012, 11, 1074–1080 CAS.
- J. V. Busto, A. B. Garcia-Arribas, J. Sot, A. Torrecillas, J. C. Gomez-Fernandez, F. M. Goni and A. Alonso, Biophys. J., 2014, 106, 621–630 CrossRef CAS PubMed.
- S. L. Veatch and S. L. Keller, Biophys. J., 2003, 85, 3074–3083 CrossRef CAS PubMed.
- S. L. Veatch and S. L. Keller, Biochim. Biophys. Acta, 2005, 1746, 172–185 CrossRef CAS PubMed.
- Y. Z. Yoon, J. P. Hale, P. G. Petrov and P. Cicuta, J. Phys.: Condens. Matter, 2010, 22, 062101 CrossRef PubMed.
- T. Baumgart, A. T. Hammond, P. Sengupta, S. T. Hess, D. A. Holowka, B. A. Baird and W. W. Webb, Proc. Natl. Acad. Sci. U. S. A., 2007, 104, 3165–3170 CrossRef CAS PubMed.
- N. L. C. McCarthy, O. Ces, R. V. Law, J. M. Seddon and N. J. Brooks, Chem. Commun., 2015, 51, 8675–8678 RSC.
- I. V. Polozov and K. Gawrisch, Biophys. J., 2006, 90, 2051–2061 CrossRef CAS PubMed.
- J. A. Clarke, J. M. Seddon and R. V. Law, Soft Matter, 2009, 5, 369 RSC.
- P. Uppamoochikkal, S. Tristram-Nagle and J. F. Nagle, Langmuir, 2010, 26, 17363–17368 CrossRef CAS PubMed.
- J. D. Pilot, J. M. East and A. G. Lee, Biochemistry, 2001, 40, 8188–8195 CrossRef CAS PubMed.
- A. M. Powl, J. M. East and A. G. Lee, Biophys. J., 2007, 93, 113–122 CrossRef CAS PubMed.
- A. R. Curran, R. H. Templer and P. J. Booth, Biochemistry, 1999, 38, 9328–9336 CrossRef CAS PubMed.
- C. Jeworrek, M. Puhse and R. Winter, Langmuir, 2008, 24, 11851–11859 CrossRef CAS PubMed.
- R. Winter and C. Jeworrek, Soft Matter, 2009, 5, 3157 RSC.
- S. L. Veatch, O. Soubias, S. L. Keller and K. Gawrisch, Proc. Natl. Acad. Sci. U. S. A., 2007, 104, 17650–17655 CrossRef CAS PubMed.
- J. H. Davis and M. L. Schmidt, Biophys. J., 2014, 106, 1970–1978 CrossRef CAS PubMed.
- N. J. Brooks, O. Ces, R. H. Templer and J. M. Seddon, Chem. Phys. Lipids, 2011, 164, 89–98 CrossRef CAS PubMed.
- J. M. Seddon, A. M. Squires, C. E. Conn, O. Ces, A. J. Heron, X. Mulet, G. C. Shearman and R. H. Templer, Philos. Trans. R. Soc. London, Ser. A, 2006, 364, 2635–2655 CrossRef CAS PubMed.
- T. Y. Tang, N. J. Brooks, C. Jeworrek, O. Ces, N. J. Terrill, R. Winter, R. H. Templer and J. M. Seddon, Langmuir, 2012, 28, 13018–13024 CrossRef CAS PubMed.
- S. Purushothaman, P. Cicuta, O. Ces and N. J. Brooks, J. Phys. Chem. B, 2015, 119, 9805–9810 CrossRef CAS PubMed.
- P. Heftberger, B. Kollmitzer, A. A. Rieder, H. Amenitsch and G. Pabst, Biophys. J., 2015, 108, 854–862 CrossRef CAS PubMed.
- N. J. Brooks, B. L. Gauthe, N. J. Terrill, S. E. Rogers, R. H. Templer, O. Ces and J. M. Seddon, Rev. Sci. Instrum., 2010, 81, 064103 CrossRef PubMed.
- V. Cherezov, J. Clogston, Y. Misquitta, W. Abdel-Gawad and M. Caffrey, Biophys. J., 2002, 83, 3393–3407 CrossRef CAS PubMed.
- S. Purushothaman, P. Cicuta, O. Ces and N. J. Brooks, J. Phys. Chem. B, 2015, 119, 9805–9810 CrossRef CAS PubMed.
- H. M. Barriga, A. I. Tyler, N. L. McCarthy, E. S. Parsons, O. Ces, R. V. Law, J. M. Seddon and N. J. Brooks, Soft Matter, 2015, 11, 600–607 RSC.
- O. Reis, R. Winter and T. W. Zerda, Biochim. Biophys. Acta, 1996, 1279, 5–16 CrossRef.
- L. F. Braganza and D. L. Worcester, Biochemistry, 1986, 25, 7484–7488 CrossRef CAS PubMed.
- J. F. Nagle and S. Tristram-Nagle, Biochim. Biophys. Acta, 2000, 1469, 159–195 CrossRef CAS.
- M. Alwarawrah, J. Dai and J. Huang, J. Phys. Chem. B, 2010, 114, 7516–7523 CrossRef CAS PubMed.
- S. W. Chiu, E. Jakobsson, R. J. Mashl and H. L. Scott, Biophys. J., 2002, 83, 1842–1853 CrossRef CAS PubMed.
Footnote |
| † Electronic supplementary information (ESI) available: Further details of tie line endpoint determination. See DOI: 10.1039/c5cp04239a |
| This journal is © the Owner Societies 2016 |