Gas-phase synthesis of Mg–Ti nanoparticles for solid-state hydrogen storage†
M.
Calizzi
*a,
F.
Venturi‡
a,
M.
Ponthieu§
b,
F.
Cuevas
b,
V.
Morandi
c,
T.
Perkisas
d,
S.
Bals
d and
L.
Pasquini
a
aDepartment of Physics and Astronomy, Alma Mater Studiorum—University of Bologna, via C. Berti-Pichat 6/2, 40127 Bologna, Italy. E-mail: marco.calizzi@unibo.it
bCMTR/ICMPE/CNRS-UPEC, UMR7182, 2-8 rue Henri Dunant, 94320, Thiais Cedex, France
cCNR-IMM Section of Bologna, via Gobetti 101, 40129 Bologna, Italy
dEMAT, University of Antwerp, Groenenborgerlaan 171, B-2020 Antwerp, Belgium
First published on 5th November 2015
Abstract
Mg–Ti nanostructured samples with different Ti contents were prepared via compaction of nanoparticles grown by inert gas condensation with independent Mg and Ti vapour sources. The growth set-up offered the option to perform in situ hydrogen absorption before compaction. Structural and morphological characterisation was carried out by X-ray diffraction, energy dispersive spectroscopy and electron microscopy. The formation of an extended metastable solid solution of Ti in hcp Mg was detected up to 15 at% Ti in the as-grown nanoparticles, while after in situ hydrogen absorption, phase separation between MgH2 and TiH2 was observed. At a Ti content of 22 at%, a metastable Mg–Ti–H fcc phase was observed after in situ hydrogen absorption. The co-evaporation of Mg and Ti inhibited nanoparticle coalescence and crystallite growth in comparison with the evaporation of Mg only. In situ hydrogen absorption was beneficial to subsequent hydrogen behaviour, studied by high pressure differential scanning calorimetry and isothermal kinetics. A transformed fraction of 90% was reached within 100 s at 300 °C during both hydrogen absorption and desorption. The enthalpy of hydride formation was not observed to differ from bulk MgH2.
1 Introduction
The hydrogen (H) economy still lacks a suitable storage system. Worldwide, the research is focusing with continuously increasing effort on this topic in order to replace the “old” and limited gas tank technology. In this field, the use of metal hydrides has been studied since the 1980s, leading to the development of materials with different H-storage properties in terms of gravimetric capacity, working temperature/pressure and sorption kinetics. Magnesium (Mg) is one of the most interesting H-materials, being cost effective, abundant and capable of storing up to 7.66 wt% H. However, the slow hydrogen sorption kinetics and high working temperatures are the major obstacles to overcome.With the aim to improve H-sorption kinetics and thermodynamics over bulk Mg, many Mg-based materials have been synthesised following different approaches: microstructure refinement, alloying with other elements,1 and mixing with catalysts such as transition metals2 or transition metal oxides.3
In nanostructured materials, the high surface-to-volume ratio and the short diffusion paths lead to an enhancement of H-sorption kinetics. Moreover, new interesting phenomena may arise at the nanoscale, such as a reduction of hydride formation enthalpy due to interface energy contribution,4 or due to the effect of elastic boundary conditions.5,6 These effects could lower the H-desorption temperature at the pressure of 0.1 MPa, one of the main goals for practical H-storage applications. On the other hand, challenging issues like microstructure coarsening and oxidation may arise in nanostructures during H-sorption cycles at elevated temperature.
Among the various catalysts employed to lower the activation energy for H-sorption in Mg-based systems, titanium (Ti) and its hydride TiH2 have recently gained considerable attention.7,8 In fact, Ti is relatively lightweight and abundant, and the resulting kinetics of H-sorption are among the fastest ever observed for Mg-based materials. In order to achieve a fine dispersion of Ti in Mg, or the formation of a Mg–Ti solid solution, non-equilibrium synthesis techniques are required because Mg and Ti are almost immiscible. Therefore, nanostructured Mg–Ti systems have been synthesised primarily via ball-milling,7–11 but also by sputtering4,12,13 or by chemical precipitation.14
The growth of Mg–Ti nanoparticles (NPs) from the gas phase was recently carried out by spark discharge generation using Ti and Mg electrodes15 and by sputtering of a composite Mg–Ti target.16 In this work we demonstrate the growth of Mg–Ti metastable NPs by Inert Gas Condensation, using two independent vapour sources simultaneously. This approach offers a good control on the composition of the NPs, allowing us to investigate the structure, composition and H-sorption properties as a function of Ti content in the 6–22 at% range, which is the most interesting for H-storage applications. In addition, our set-up permits in situ H-absorption and compaction of the NPs to yield Mg–Ti nanostructured pellets.
2 Experimental
Mg–Ti samples were synthesised by Inert Gas Condensation (IGC). Mg ingots (99.9% purity) and Ti powder (Alfa Aesar 99.9% purity, 150 mesh) were used as starting materials. In the IGC chamber (evacuated to 10−5 Pa before synthesis), Mg and Ti were evaporated simultaneously in two Joule-heated tungsten boats under a flow of 99.9999% pure He gas. The He flow rate was set to Φ = 7 std cm3 min−1 using a mass flow controller and the pressure was kept constant at PHe = 270 Pa. The He flow hits first the Mg vapour source and then the hotter Ti vapour source. Samples with different Ti contents were synthesised by changing the power applied to the Ti-boat. After the collection on a liquid-N2 cooled rotating cylinder, the nano-powder was scraped and in situ transferred to a secondary chamber where it was compacted for 30 s under a pressure of 400 MPa in the shape of a pellet (diameter = 8 mm, mass between 12 mg and 40 mg). One subset of the samples was subjected to H-absorption in the secondary chamber, for 3 h at 150 °C under a H2 pressure of 0.0133 MPa before compaction. Such a pressure was selected to ensure full sample hydrogenation (i.e. it is higher than the equilibrium pressures of MgH2 and TiH2 at 150 °C). After compaction, 99.999% pure O2 was admitted slowly before venting the chamber, in order to form a passivating oxide layer which prevents the specimens from ignition and severe oxidation upon air exposure. The samples were finally extracted from the chamber and transferred to the equipment for structural analysis and measurement of H-sorption properties under atmospheric conditions.Seven Mg–Ti samples were synthesised: four compacted in the as-grown state, named MgTi6, MgTi10, MgTi12, and MgTi15 (first subset) and three compacted after in situ H-absorption, named MgTi9H, MgTi12H, and MgTi22H (second subset). The number in each name represents the measured Ti atomic percentage (considering only Mg and Ti elements). In the following, we will refer to the first and second subsets as MgTi# and MgTi#H, respectively. In addition, one sample without Ti was synthesised under the same conditions as reference.
X-ray diffraction (XRD) patterns were collected using PANalytical X'celerator and Bruker D8 ADVANCE diffractometers using Cu-Kα radiation. XRD patterns were analysed using the MAUD17 Rietveld-refinement program to determine phase composition, lattice parameters and crystallite size. Morphology and chemical composition were analysed using a Leo Zeiss 1530 Gemini field emission scanning electron microscope (FE-SEM) and a Leica Cambridge Stereoscan 360 SEM equipped with an Oxford Instruments X-ray detector for energy dispersive X-ray spectroscopy (EDX) measurements.
Transmission electron microscopy (TEM)-EDX mapping and High Angle Annular Dark Field Scanning TEM (HAADF-STEM) observations were conducted on Mg–Ti NPs directly deposited on a holey carbon grid, using a FEI Titan microscope.
The hydrogen sorption properties were studied using a Sensys Evo High-Pressure Differential Scanning Calorimeter (HPDSC). The samples were cycled between 200 °C and 410 °C at a heating rate of 5 °C min−1 under H2 pressures of 0.2 MPa and 0.4 MPa. A homemade volumetric Sievert apparatus was used for isothermal kinetic measurements. The kinetics were measured at 300 °C under conditions far from equilibrium, starting from 0.9 MPa for H-absorption and 0.015 MPa for H-desorption.
3 Results
3.1 Structure and morphology
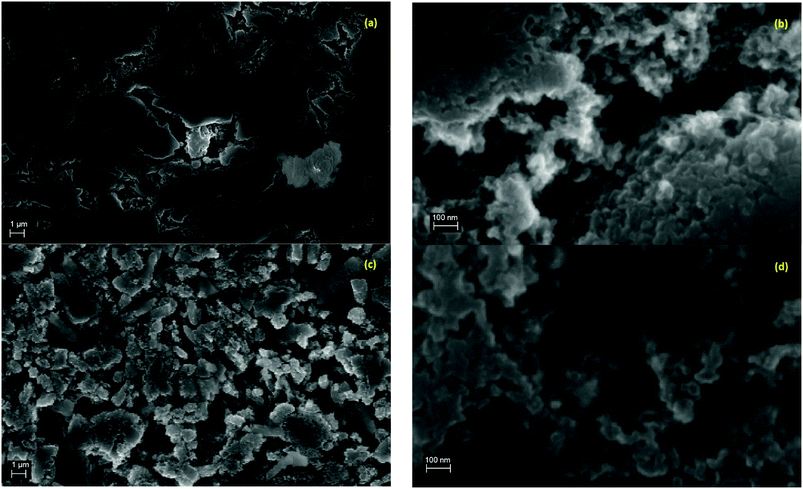
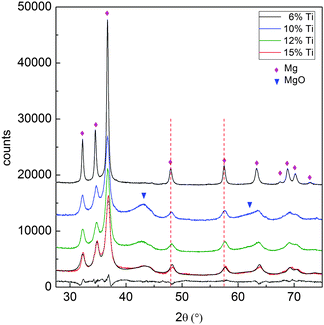
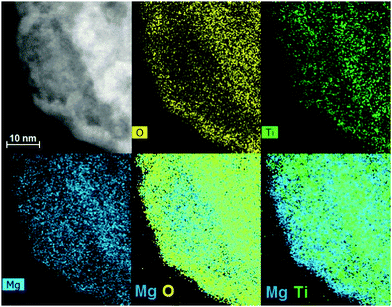
SEM images in Fig. 1 show the typical morphology of both MgTi# and MgTi#H as prepared pellets. Fig. 1(a) shows that the surface of MgTi# pellets has flat and uniform regions whose size is around 5–10 μm, meaning that the original morphology of the NPs at the surface is distorted by compaction. Many micrometric cracks on the surface reveal more clearly the presence of NPs inside the pellet with a typical size <20 nm (Fig. 1(b)). The picture is different for the as prepared MgTi#H samples, where the surface seems to be more porous and the typical extent of the flat regions does not exceed 1 μm (Fig. 1(c)). By FE-SEM resolution, no differences at the nanoscale morphology are observed in the investigated composition range (6–22 at% Ti) or between inner, undistorted NPs of MgTi# samples (Fig. 1(b)) and MgTi#H NPs (Fig. 1(d)).Fig. 2 displays the XRD patterns of the MgTi# samples. While the Bragg reflections of hcp Mg are clearly visible, neither hcp Ti nor TiO2 is observed. Notably, the Mg diffraction peaks move toward higher angles with increasing Ti content, revealing a contraction of the lattice parameters (Table 1). Fig. 3 reports the lattice parameters a and c of the hcp Mg phase, determined by Rietveld refinement, against the Ti content determined by SEM-EDX. A linear fit of these data gives the correlation factors R = −0.997 for a and R = −0.986 for c. TEM-EDX mapping (Fig. 4) shows that Ti is well dispersed in the NPs. The maps show a preferential location of O at the surface, together with Mg, whereas Ti coexists with Mg in the NP interior. It must be remarked that the NPs in Fig. 4 were not compacted and therefore oxidation is expected to be stronger than for pellets. However, the presence of MgO in the form of thin layers at open surfaces of the samples is also suggested by the broad MgO diffraction peaks observed in Fig. 2 and 5, from which a MgO crystallite size of ∼3 nm can be estimated.
| Sample | Ti at% EDX | Phase abundance (wt%) | Mg/β-MgH2 cell parameters | Cryst. size (nm) | Rwp (%) | |||||||
|---|---|---|---|---|---|---|---|---|---|---|---|---|
| MgH2 | Mg | MgO | TiH2 | Mg–Ti–H | a (Å) | c (Å) | Mg | β-MgH2 | TiH2 | |||
| MgTi6 | 6(2) | — | 100 | 0 | — | — | 3.2033(1) | 5.1899(3) | 37.8(2) | — | — | 8.4 |
| MgTi10 | 10(2) | — | 61(5) | 39(5) | — | — | 3.2000(3) | 5.1592(9) | 11.5(1) | — | — | 5.7 |
| MgTi12 | 12(2) | — | 66(2) | 34(2) | — | — | 3.1958(3) | 5.1536(9) | 11.5(2) | — | — | 6.5 |
| MgTi15 | 15(4) | — | 75(1) | 25(1) | — | — | 3.1893(9) | 5.1360(14) | 11.8(1) | — | — | 5 |
| MgTi9H | 9(1) | β-55(1) | 3.3(2) | 27(1) | 11(1) | — | 4.5245(4) | 3.0260(2) | — | 32.5(3) | 3.5(2) | 5.8 |
| γ-3.5(3) | ||||||||||||
| MgTi12H | 12(1) | β-29(1) | — | 23(1) | 29(1) | — | 4.5195(6) | 3.0203(8) | — | 11.7(1) | 3.0(2) | 4.7 |
| γ-19(2) | ||||||||||||
| MgTi22H | 22(4) | β-32(1) | — | 10(1) | 37(1) | 4(1) | 4.5175(9) | 3.0260(13) | — | 9.0(1) | 4.9(4) | 4.0 |
| γ-17(1) | ||||||||||||
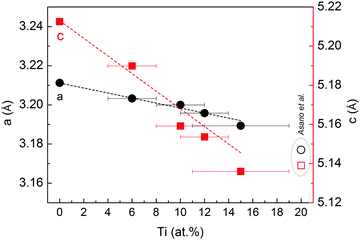 | ||
| Fig. 3 Cell parameters a and c of the hcp Mg structure in MgTi# samples, plotted as a function of Ti at%. The dashed lines represent a linear fit to the data. Open symbols are taken from ref. 10. | ||
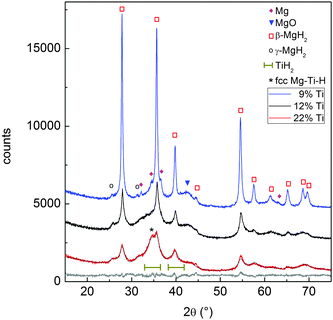 | ||
| Fig. 5 XRD profiles of the as-prepared MgTi#H samples. The best fit to the data and the residual are given for sample MgTi22H (grey lines). | ||
Fig. 5 reports the XRD patterns of MgTi#H samples. The results of Rietveld refinement (Table 1) show that MgTi#H samples are composed mainly of rutile β-MgH2 and orthorhombic γ-MgH2. The presence of TiH2 crystallites with fluorite structure and size less than 5 nm can be evinced from the presence of two bumps centred around 2θ positions compatible with the TiH2(111) and (200) reflections, i.e. at 35.0° and 40.7°, respectively (Fig. 5). Hydride formation is almost complete in all samples: 3 wt% of residual hcp Mg is detected only in sample MgTi9H with the highest Mg content. The lattice parameters of β-MgH2 are very close (within 0.2%) to those reported for bulk β-MgH2 (lit.,18a = 4.5170 Å, c = 3.0205 Å). Sample MgTi22H, the one with the highest Ti content (22 at%), exhibits a peak at 2θ = 34.5°, marked “*”, attributed to a Mg–Ti–H fcc phase not observed in the other samples.
The mean crystallite size of Mg and β-MgH2, as determined from Rietveld refinement, decreases with increasing Ti content (Fig. 6) and stabilises at about 12 nm above 10 at% Ti.
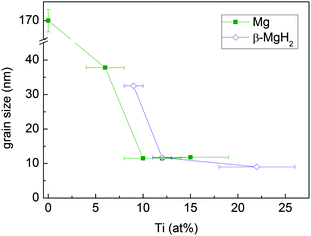 | ||
| Fig. 6 Mean crystallite size of the Mg and β-MgH2 phases in MgTi# and MgTi#H samples, respectively, as a function of Ti content. The straight lines are a guide to the eye. | ||
In MgTi#H samples, the Ti atomic fractions calculated from the relative abundance of the phases detected by XRD are compatible within the uncertainties with the Ti atomic fractions measured by SEM-EDX.
3.2 Hydrogen sorption properties
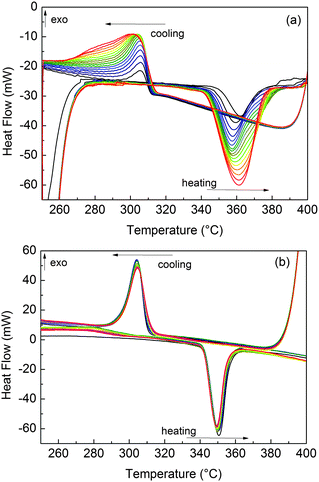
Before HPDSC measurements, MgTi# samples were activated for 3 h under 1 MPa H2 at 300 °C. Without such activation, H-ab/desorption could not be observed under the temperature/pressure conditions of the experiments. Fig. 7(a) shows that for sample MgTi10 the reacted fraction, proportional to the integral area of the peaks, increases with cycling. The same behaviour is observed in other MgTi# samples. Differently, MgTi#H samples needed no activation, readily desorbing H from the first cycle, as shown for sample MgTi12H in Fig. 7(b).The enthalpy of hydride formation ΔH can be estimated from the HPDSC traces as explained by Rongeat et al.:19 filling the Van't Hoff plot with the onset temperatures of absorption/desorption at different pressures under/overestimates the measure of ΔH. ΔH is then estimated as the average (ΔHabs + ΔHdes)/2 with an associated error (ΔHabs − ΔHdes)/2 (Table 2).
| Sample | ΔH (kJ molH2−1) |
|---|---|
| MgTi6 | −75 ± 15 |
| MgTi10 | −79 ± 3 |
| MgTi12 | −78 ± 14 |
| MgTi15 | −73 ± 1 |
| MgTi9H | −74 ± 7 |
| MgTi12H | −72 ± 10 |
| MgTi22H | −73 ± 3 |
H-sorption kinetics were measured in the Sievert apparatus for samples MgTi12 and MgTi9H. MgTi12 absorbs and desorbs 2.8 wt% H in about 120 min. MgTi9H desorbs 2.7 wt% and absorbs 2.5 wt% in about 15 min. MgTi12 achieves 90% of reaction completion in about 50 min, MgTi9H in 2 min for desorption and less than 1 min for absorption.
After HPDSC cycles (ended with an absorption) the samples were again investigated by XRD. These patterns are shown in Fig. S1 (ESI†) and the results of the Rietveld refinements are summarised in Table S1 (ESI†). The mean crystallite size of β-MgH2 is significantly larger than in the as-prepared MgTi#H samples. The hcp Mg phase is still present in the MgTi# samples while it is not detected in the others (apart from very small amount in MgTi9H). Its crystallite size is up to 10 times larger than in the as-prepared samples, and its lattice parameters are close to those of bulk hcp Mg (lit.,20a = 3.2094 Å, c = 5.2108 Å). After cycling, the main broad reflection of TiH2 becomes clearly visible at position 2θ = 35.0°. The MgO wt% is larger than in the as-prepared samples, especially for the MgTi#H samples, while γ-MgH2 is no longer detected. The pellets are still intact after being cycled up to 31 times.
4 Discussion
4.1 Formation of Mg–Ti solid solution and the effect of in situ H-absorption
Mg and Ti are immiscible at equilibrium,21 but can form a metastable alloy. The contraction of the unit cell observed in our as-prepared MgTi# samples (Fig. 3) can be attributed to substitutional Ti in the hcp Mg lattice. This is in agreement with Vegard's empirical law, since Ti crystallises in the hcp structure with lattice parameters smaller than Mg (lit.,22a = 2.9511 Å, c = 4.68433 Å) and the contraction is linear with Ti content. Fig. S2 (ESI†) shows the XRD profile of another sample with 23 at% Ti without in situ hydrogenation where new peaks suggest the presence of small amounts of hcp Ti. Metastable hcp, fcc and bcc Mg–Ti alloys have been observed, both rich in Mg9–11,15 and in Ti.23 Asano et al.10 studied the structure of Mg–Ti milled powders between 20 at% and 65 at% Ti. After prolonged milling (200 h) they obtained a hcp Mg80Ti20 phase whose lattice parameters are in good agreement with our data (Fig. 3). At higher Ti content, they observed the formation of both bcc and fcc Mg–Ti alloys, depending on the milling energy. Anastasopol et al.15 synthesised Mg–Ti NPs with 30 at% Ti via spark discharge generation (SDG), and found a Mg–Ti bcc phase mixed with the pure and separated Mg and Ti hcp phases. These findings suggest that the solution of Ti in Mg reported in this work up to 15 at% Ti could extend to about 20 at% Ti, while at higher Ti contents Ti-rich phases start to appear.The observation of TiH2 and β-MgH2 with lattice parameters close to the bulk values (Fig. 5) in the MgTi#H samples suggests that, during the first H-absorption, Ti atoms dissolved in the NPs segregate out of the Mg lattice while forming the hydride. A rough estimate of the average number n of TiH2 crystallites per MgH2 crystallite, assuming spherical crystallites, can be obtained simply from the formula:
The XRD pattern of sample MgTi22H (Fig. 5) reveals the presence of a Mg–Ti–H fcc phase, in agreement with previous reports at higher Ti content.11,15,25,26 The lattice parameter of 4.51(1) Å is very close to the value of 4.49 Å reported for the Mg42Ti58H177 composition.27 Such a Mg–Ti–H fcc phase is known to form upon hydrogenation of the previously discussed bcc Mg50Ti50 phase,27 which is synthesised in Mg–Ti systems with Ti content >20 at%: this explains why it is present in sample MgTi22H only. The Mg–Ti–H fcc phase is not detected in the XRD pattern of Fig. S1 (ESI†), meaning that it decomposed upon cycling in the HPDSC. Instability upon H-cycling was generally reported for this ternary compound, and for other Mg–Ti–H phases with different structures.28–30
4.2 MgO formation, TiO2 absence
Considering that the MgO crystallite size corresponds to the formation of an oxide shell of thickness dshell = 3 nm around a Mg/MgH2 sphere of diameter dcore equal to the Mg or β-MgH2 crystallite size (for MgTi# or MgTi#H samples, respectively), we can estimate the shell to core weight fraction mshell/mcore aswhere ρshell = 3.58 g cm−3 is the MgO density, ρcore = 1.74 g cm−3 or 1.45 g cm−3 is the Mg or β-MgH2 density,24 respectively. This simple core–shell model overestimates from 3 to 30 times the amount of oxide, compared to the experimental data. This result suggests that the 3 nm thick MgO layer does not form around each NP but around high density assemblies of NPs produced by compaction when the samples are exposed to the oxidising atmosphere.
Oxidation of MgTi# samples partially decomposes the Mg–Ti alloy. Since TiO2 is less stable (lit.,24 ΔfH°(298.15 K) = −944 kJ molO2−1) than MgO (lit.,24 ΔfH°(298.15 K) = −1204 kJ molO2−1), Mg is segregated out of the NPs to form a protective MgO layer that prevents further oxidation of NPs.31 This phenomenon is observed in TEM-EDX maps (Fig. 4), in particular the last one showing Mg and Ti signals together, where only Mg (bonded to O) is at the surface. In MgTi#H samples, the absence of TiO2 is due to the high TiH2 stability to O2.
4.3 NP size vs. Ti content
The Mg/MgH2 crystallite size decreases with increasing Ti content and is weakly affected by in situ hydride formation. In a previous work31 we showed that in the case of Mg NPs without Ti, capillary forces induce the crystal growth of deposited Mg NPs by the grain rotation coalescence/oriented attachment (GRC/OA) mechanism, eventually yielding NPs and crystals larger than 200 nm. Interestingly, Ti seems to inhibit this mechanism by acting as a grain refiner. As a possible explanation for this effect, we consider different atomic sizes and electronic structures of the two elements. The random distribution of Ti atoms at the NP surface locally deforms the hcp Mg lattice. Because of this random deformation, it is no longer possible for two adjacent NPs to achieve perfect lattice coincidence by simple rotation/translation and the driving force for GRC/OA is correspondingly reduced. This effect gains importance with increasing Ti content. Our results suggest that coalescence of the as-deposited NPs becomes inhibited for Ti content above 10 at%, where the crystallite size reaches a lower limit. This minimum crystallite size is probably representative of the primary NP size formed in the gas phase, prior to their agglomeration and coalescence. Lu et al.7 showed that 10 at% Ti in reactively ball milled MgH2 is a sufficient quantity to have very good kinetics and cyclability.4.4 Effects of in situ hydride formation on H-sorption kinetics
Three experimental results clearly indicate that MgTi#H samples exhibit kinetic properties and activation behaviour superior to MgTi#: (i) the direct comparison between isothermal H-sorption kinetics reported in Fig. 8; (ii) the presence of hcp Mg in MgTi# samples after several HPDSC cycles ending with H-absorption (Fig. S1 and Table S1, ESI†), meaning that part of Mg never transformed into hydride, and (iii) the fact that, for MgTi# samples, the integral area of the HPDSC peaks in Fig. 7 increases with cycling and the H-absorption peaks are highly asymmetrical. The peak asymmetry can be due to the overlapping of two H-absorption processes with different kinetics. The sample fraction, which already reacted during previous cycles, likely contributes to the fast process. Differently, H-absorption by sample regions that were not activated in previous cycles contributes to the slow component and to the progressive increase of the peak integral area. The slower H-absorption process continues with decreasing speed since the diffusion coefficient decreases during cooling until it is completely blocked by low temperature (260 °C). Also, as the reaction proceeds MgH2 may grow preferentially near the surface forming a shell/core MgH2/Mg structure. Diffusion of hydrogen in the MgH2 shell (slower than in Mg) contributes to the slower process since the shell increases in thickness as absorption advances.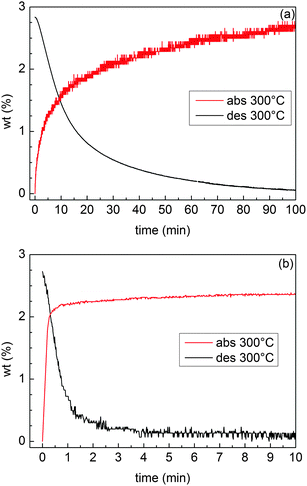 | ||
| Fig. 8 H-sorption kinetics of the samples MgTi12 (a) and MgTi9H (b) at 300 °C. The initial H2 pressure is 0.9 MPa for absorption and 0.015 MPa for desorption. | ||
For practical H-storage applications it may be more convenient to handle pellets rather than nanopowders. In this respect, our results suggest that hydride formation before NP compaction is beneficial to kinetic and activation behaviour. A possible explanation for this observation may be searched in the higher ductility of metallic Mg in comparison with hydride MgH2, which results in a lower porosity of the compacted pellets for MgTi# samples, as can be seen by comparing SEM Fig. 1(a) and (c). If porosity is low, H cannot reach the inner pellet regions simply by gaseous diffusion, and a slower process, i.e. diffusion along interfaces, becomes the dominant transport mechanism. Since MgTi# and MgTi#H samples have a similar crystallite size, the difference in the kinetic properties cannot be attributed to a different volume fraction of interfaces, while it could be ascribed to a different porosity. The difference in porosity observed for the two sets of samples reveals also why MgTi# samples needed an activation treatment. The as prepared MgTi# samples have a less porous surface that slows down H-sorption reactions to the point that they are not measurable on a single HPDSC run (∼30 min). To activate the samples, prolonged exposure to H is needed to crack the surface thanks to the volume expansion that occurs in the metal to hydride transition. The beneficial effects of activation and cycling can be seen comparing SEM images before (Fig. 1(a)) and after cycling (Fig. S3, ESI†). The pore structure as a function of both compaction pressure and hydride formation treatment could be the subject of a future study aimed at optimising H-sorption kinetics of the pellets. On the other hand, a lower porosity and a lower surface area reduce the risk of contamination by oxygen and moisture when the pellets are exposed to air, and this can explain why MgTi# samples have a lower oxide content after HPDSC cycles in comparison with MgTi#H samples (Table S1, ESI†).
Clearly, in an ideal synthesis process the pellets should be extracted from the chamber under a clean atmosphere, thus overcoming the problem of oxide formation and permitting to achieve higher gravimetric H-storage capacities. We are currently upgrading our system in order to permit extraction of both pellet and nanopowder samples under an argon atmosphere. It is nevertheless worth remarking that if the amount of produced material is small, residual impurities present in the H2 gas or desorbed from the equipment walls can lead to extensive oxidation,15 even if the transfer processes are carried out under a clean atmosphere.
The H-sorption kinetics in Fig. 8(b) are among the fastest reported for Mg-based materials. TiH2 is known to be a good catalyst and it has been proposed7 to act as a gateway for hydrogen since it helps in the dissociation of H2 and H diffusion is fast through TiH2 octahedral sites.7,8,32 Moreover, Ti combines well by the IGC technique for the production of smaller Mg NPs. All these effects contribute to the increase in the kinetic performances of this material.
4.5 Thermodynamics of H-sorption
For all samples, independently of the kinetic behaviour, we determined the enthalpy of hydride formation (Table 2) compatible (within the uncertainties) with the one reported for bulk Mg (lit.,33 −74.1 ± 2.9 kJ molH2−1). Hydride formation/decomposition and high temperature operation lead to segregation of MgH2 and TiH2 phases and to significant crystallite growth of Mg/MgH2 (as reported in Table S1, ESI†). Therefore, thermodynamic changes due to Ti substitution in hcp Mg are not expected. In a recent paper,34 Asano et al. demonstrated clearly that MgH2 nanometer-sized clusters in a TiH2 matrix have a reduced enthalpy of formation because of interface effects. The enthalpy of formation is lowered by ≈10 kJ molH2−1 for samples with >60 at% Ti content and Mg NPs size <3 nm while our samples have <23 at% Ti and NPs size >10 nm. Furthermore, MgH2 and TiH2 are no longer finely dispersed after in situ hydride formation at 150 °C. The coarsening of the microstructure reduces the volume fraction occupied by MgH2/TiH2 interfaces. In this scenario, modification of thermodynamics due to interface energy effects4,34 or coherency strain35 may be too small to be detected.Our results, suggesting no change in the thermodynamics of H-sorption in samples subjected to H-sorption cycles in the 260–400 °C range, fully agree with previous investigation on MgH2/TiH2 reactively ball-milled nanocomposites.8
5 Conclusions
The condensation of a mixture of supersaturated Mg and Ti metal vapours leads to the formation of Mg–Ti NPs with a Ti solubility in the hcp Mg lattice, which extends well beyond the solvus line of the bulk phase diagram. This important result sets gas-phase condensation as a powerful, up-scalable tool for the bottom-up preparation of metastable NPs constituted by elements with poor mutual solubility. The synthesis method also demonstrated a good control over the product composition with overall structural and chemical homogeneity. Upon hydrogen absorption, the structural changes associated with the metal-hydride transformation push the system out of its metastable state, and an MgH2/TiH2 nanocomposite develops. A possible exception to this decomposition path occurs only at higher Ti content (>20 at%) where an fcc Mg–Ti–H phase is observed and is ascribed to H-absorption by bcc Mg–Ti. It is worth remarking that Asano et al.10 reported a similar phase landscape for Mg–Ti samples synthesised by top-down ball milling.Mg–Ti NPs are less prone to coarsening and recrystallisation by oriented attachment than Mg NPs: above 10 at% Ti, a lower limit of about 10 nm is obtained for the Mg–Ti crystallite size.
The presence of Ti or its hydride results in excellent H-sorption kinetics, in particular for NPs subjected to hydride formation before in situ compaction. Conversely, the enthalpy of hydride formation ΔH, as measured by HPSDC in the 260–400 °C range, does not differ from the one reported for pure, bulk Mg. This result is contrary to the strong ΔH and ΔS reduction reported in Mg–Ti nanoparticles with about 30 at% Ti synthesised by spark discharge generation15 (ΔH = −45 kJ molH2−1). The reason for this difference appears to be the higher stability of the bcc Mg–Ti phase in NPs with higher Ti content, leading to a different H-sorption path, i.e. from bcc Mg–Ti to fcc Mg–Ti–H, with different thermodynamics. Conversely, at lower Ti content – and therefore at higher reversible H-storage capacity – the reversible transformation path goes from hcp Mg to bct MgH2, in agreement with experiments on ball-milled samples.8
Acknowledgements
Part of this work was supported by the COST Action MP1103 “Nanostructured materials for solid-state hydrogen storage”.References
- G. Liang, J. Alloys Compd., 2004, 370, 123 CrossRef CAS.
- G. Liang, J. Huot, S. Boily, A. Van Neste and R. Schulz, J. Alloys Compd., 1999, 292, 247 CrossRef CAS.
- W. Oelerich, T. Klassen and R. Bormann, J. Alloys Compd., 2001, 315, 237 CrossRef CAS.
- L. P. A. Mooij, A. Baldi, C. Boelsma, K. Shen, M. Wagemaker, Y. Pivak, H. Schreuders, R. Griessen and B. Dam, Adv. Energy Mater., 2011, 1, 754 CrossRef CAS.
- A. Baldi, M. Gonzalez-Silveira, V. Palmisano, B. Dam and R. Griessen, Phys. Rev. Lett., 2009, 102, 226102 CrossRef CAS PubMed.
- L. Pasquini, M. Sacchi, M. Brighi, C. Boelsma, S. Bals, T. Perkisas and B. Dam, Int. J. Hydrogen Energy, 2014, 39, 2115 CrossRef CAS.
- J. Lu, Y. J. Choi, Z. Z. Fang, H. Y. Sohn and E. Rönnebro, J. Am. Chem. Soc., 2009, 131, 15843 CrossRef CAS PubMed.
- F. Cuevas, D. Korablov and M. Latroche, Phys. Chem. Chem. Phys., 2012, 14, 1200 RSC.
- G. Liang and R. Schulz, J. Mater. Sci., 2003, 38, 1179 CrossRef CAS.
- K. Asano, H. Enoki and E. Akiba, J. Alloys Compd., 2009, 480, 558 CrossRef CAS.
- K. Asano, H. Kim, K. Sakaki, K. Page, S. Hayashi, Y. Nakamura and E. Akiba, J. Alloys Compd., 2014, 593, 132 CrossRef CAS.
- P. Vermeulen, R. A. H. Niessen and P. H. L. Notten, Electrochem. Commun., 2006, 8, 27 CrossRef CAS.
- D. M. Borsa, R. Gremaud, A. Baldi, H. Schreuders, J. H. Rector, B. Kooi, P. Vermeulen, P. H. L. Notten, B. Dam and R. Griessen, Phys. Rev. B: Condens. Matter Mater. Phys., 2007, 75, 205408 CrossRef.
- Y. Liu, J. Zou, X. Zeng and W. Ding, RSC Adv., 2014, 4, 42764 RSC.
- A. Anastasopol, T. V. Pfeiffer, J. Middelkoop, U. Lafont, R. J. Canales-Perez, A. Schmidt-Ott, F. M. Mulder and S. W. H. Eijt, J. Am. Chem. Soc., 2013, 135, 7831 CrossRef PubMed.
- G. Krishnan, R. F. Negrea, C. Ghica, G. H. ten Brink, B. J. Kooia and G. Palasantzas, Nanoscale, 2014, 6, 11963 RSC.
- L. Lutterotti, M. Bortolotti, G. Ischia, I. Lonardelli and H. R. Wenk, Z. Kristallogr., 2007, 26, 125 CrossRef.
- F. H. Ellinger, C. E. Holley Jr., B. B. McInteer, D. Pavone, R. M. Potter, E. Staritzky and W. H. Zachariasen, J. Am. Chem. Soc., 1955, 77, 2647 CrossRef CAS.
- C. Rongeat, I. Llamas-Jansa, S. Doppiu, S. Deledda, A. Borgschulte, L. Schultz and O. Guteich, J. Phys. Chem. B, 2007, 11, 13301 CrossRef PubMed.
- C. B. Walker and M. Marezio, Acta Metall., 1959, 7, 769 CrossRef CAS.
- J. L. Murray, Bull. Alloy Phase Diagrams, 1986, 7, 245 CrossRef CAS.
- R. M. Wood, Proc. Phys. Soc., 1962, 80, 783 CrossRef CAS.
- C. Suryanarayana and F. H. Froes, J. Mater. Res., 1990, 5, 1880 CrossRef CAS.
- CRC Handbook of Chemistry and Physics, Internet Version, ed. D. R. Lide, CRC Press, Boca Raton, FL, 2005 Search PubMed.
- S. Rousselot, D. Guay and L. Roué, J. Power Sources, 2010, 195, 4370 CrossRef CAS.
- D. Korablov, F. Besenbacher and T. R. Jensen, Int. J. Hydrogen Energy, 2014, 39, 9700 CrossRef CAS.
- K. Asano, H. Enoki and E. Akiba, J. Alloys Compd., 2009, 478, 117 CrossRef CAS.
- D. Moser, D. J. Bull, T. Sato, D. Noreus, D. Kyoi, T. Sakai, N. Kitamura, H. Yusa, T. Taniguchi, W. P. Kalisvaart and P. Notten, J. Mater. Chem., 2009, 19, 8150 RSC.
- D. Kyoi, T. Sato, E. Rönnebro, N. Kitamura, A. Ueda, M. Ito, S. Katsuyama, S. Hara, D. Noréus and T. Sakai, J. Alloys Compd., 2004, 372, 213 CrossRef CAS.
- M. Ponthieu, F. Cuevas, J. F. Fernández, L. Laversenne, F. Porcher and M. Latroche, J. Phys. Chem. C, 2013, 117, 18851 CAS.
- F. Venturi, M. Calizzi, S. Bals, T. Perkisas and L. Pasquini, Mater. Res. Express, 2015, 2, 015007 CrossRef.
- S. X. Tao, P. H. L. Notten, R. A. van Santen and A. P. J. Jansen, Phys. Rev. B: Condens. Matter Mater. Phys., 2009, 79, 144121 CrossRef.
- R. A. Varin, T. Czujko and Z. S. Wronski, Nanomaterials for Solid State Hydrogen Storage, Springer, 2009, ISBN 978-0-387-77711-5 Search PubMed.
- K. Asano, R. J. Westerwaal, A. Anastasopol, L. P. A. Mooij, C. Boelsma, P. Ngene, H. Schreuders, S. W. H. Eijt and B. Dam, J. Phys. Chem. C, 2015, 119, 12157 CAS.
- S. Hao and D. S. Sholl, J. Phys. Chem. C, 2012, 116, 2045 CAS.
Footnotes |
| † Electronic supplementary information (ESI) available. See DOI: 10.1039/c5cp03092g |
| ‡ Present address: Department FIM, University of Modena and Reggio Emilia, via Giuseppe Campi 213/a, 41125 Modena, Italy. |
| § Present address: CEA, LITEN, Département Thermique Biomasse Hydrogène, F-38054 Grenoble, France. |
| This journal is © the Owner Societies 2016 |

