
 Open Access Article
 This Open Access Article is licensed under a
 Creative Commons Attribution 3.0 Unported Licence
Selective occupancy of methane by cage symmetry in TBAB ionic clathrate hydrate†
Sanehiro
Muromachi
*a,
Konstantin A.
Udachin
b,
Saman
Alavi
b,
Ryo
Ohmura
c and
John A.
Ripmeester
b
aResearch Institute of Energy Frontier, National Institute of Advanced Industrial Science and Technology (AIST), 16-1 Onogawa, Tsukuba, 305-8569, Japan. E-mail: s-muromachi@aist.go.jp
bNational Research Council of Canada, 100 Sussex Drive, Ottawa, ON K1A 0R6, Canada
cDepartment of Mechanical Engineering, Keio University, Yokohama 223-8522, Japan
First published on 17th March 2016
Abstract
Methane trapped in the two distinct dodecahedral cages of the ionic clathrate hydrate of TBAB was studied by single crystal XRD and MD simulation. The relative CH4 occupancies over the cage types were opposite to those of CO2, which illustrates the interplay between the cage symmetry and guest shape and dynamics, and thus the gas selectivity.
Methane is the smallest hydrocarbon molecule which interacts with water hydrophobically. For the class of clathrate hydrates including the ionic or salt hydrates, methane is a suitable guest substance that fits well into the pentagonal dodecahedral (D) cages made of hydrogen-bonded water molecules.1 The molecular size and the quasi-spherical shape of methane promote an isotropic distribution which is compatible with the void space of the D cages which can have a variety of local symmetries. Some recently obtained understanding of guest distributions in ionic clathrate hydrates suggests a novel method for modifying the preference of guest occupancies by controlling the D cage symmetries.2
The ionic clathrate hydrates form from water and ionic guests such as tetra-n-butylammonium bromide (TBAB)3 under relatively mild conditions, e.g., 290 K for CH4 + TBAB hydrates versus 275 K for the cubic sI CH4 hydrate, at 3 MPa.4 Hence many potential applications of these materials are suggested, e.g., gas separation and cool energy storage.5 Ionic hydrates can have the D cages occupied by small secondary guest gases, e.g., CH4, N2 and CO22,4c,6 In the hydrate structures formed with tetra-n-butylammonium and tetra-n-butylphosphonium salts, there are two distinct types of D cages with significantly different shapes, particularly due to the water displacement by the large cation.7 Although they have almost the same volume, the distorted D cage (DA) and relatively regular D cage (DB) have very different cage occupancies by CO2, i.e., 0.867 versus 0.490, respectively, with each cage having the anisotropic angular distribution for CO2.2 So far, the DA cage found in the TBAB hydrates has shown that it would provide different selectivity even for similarly sized molecules such as N2 and CO2.1b,6b Here, we consider CH4, which is a preferred guest molecule for the spherical D cage in most of the known hydrate structures, as a guest gas in the TBAB hydrate cages.
We determined the structure of the TBAB + CH4 hydrate by single crystal X-ray diffraction (SCXRD) measurements. The crystallographic details are given in Notes‡ and the ESI.† It has an Pmma orthorhombic lattice with a 21.0329(15) × 12.5972(9) × 12.0333(8) Å3 cell size in agreement with Jeffrey's type IV hydrate structure as well as the TBAB + CO2 hydrate.2,3a The cell size is slightly shrunk from the pure TBAB hydrate (21.060(5) × 12.643(4) × 12.018(8) Å3 at 93.1 K)7a likely due to the CH4 occupancy and attractive CH4–water interactions, however, the unit cell is not doubled along the b-axis in contrast to the Imma lattice of the TBAB + CO2 hydrate with unit cell vectors of 21.0197(7), 25.2728(8), and 12.0096(4) Å.2 If we assume that the Imma structure has the b-lattice length simply double that of the Pmma structure, actually this is not true as shown later, the ratios of the axes based on the present Pmma structure of the TBAB + CH4 hydrate are 1.00, 2.01 and 1.00 for a, b and c axes, respectively. These values show that the unit cell size of the Imma structure is scarcely affected by CO2, and the symmetry lowering is due to the aforementioned local interactions in the D cages between the host water and the CO2 guests. The chemical composition of the crystal unit cell was determined to be TBAB·38H2O·2.16CH4. Methods and results of SCXRD measurements have been detailed in our previous papers2,7b,c and the ESI.† As in the case of TBAB + CO2 hydrate, the TBA cation was incorporated into a fused T2P2 supercage, built out of two tetrakaidecahedral (T) cages having 12 pentagonal faces and two hexagonal faces, and two pentakaidecahedral (P) cages having 12 pentagonal faces and three hexagonal faces (see Fig. S1 in the ESI†). The bromide anion replaces a water molecule in the lattice of the T2P2 cage and some water molecules are missing at the vertices where the cages join in order to accommodate the large cations. The cation and anion positions were the same as for the TBAB + CO2 hydrate and the simple TBAB hydrate in the absence of guest gas.2,7a Three distinct D cages were found in the structure as shown in Fig. 1: a strongly distorted cage (DA) and two relatively regular cages (DB1 and DB2), thus the cage framework can be described as T2P2·DA·DB1·DB2. Symmetries of both DB1 and DB2 cages were 2/m, therefore, these should be identical for CH4. Cage occupancies by CH4 were 0.174 for DA, 0.989 for DB1 and 0.993 for DB2. Table 1 compares the D cages in the TBAB + CH4 and TBAB + CO2 hydrates. The relative CH4 occupancies of the DA and DB cages were opposite to those of CO2.2
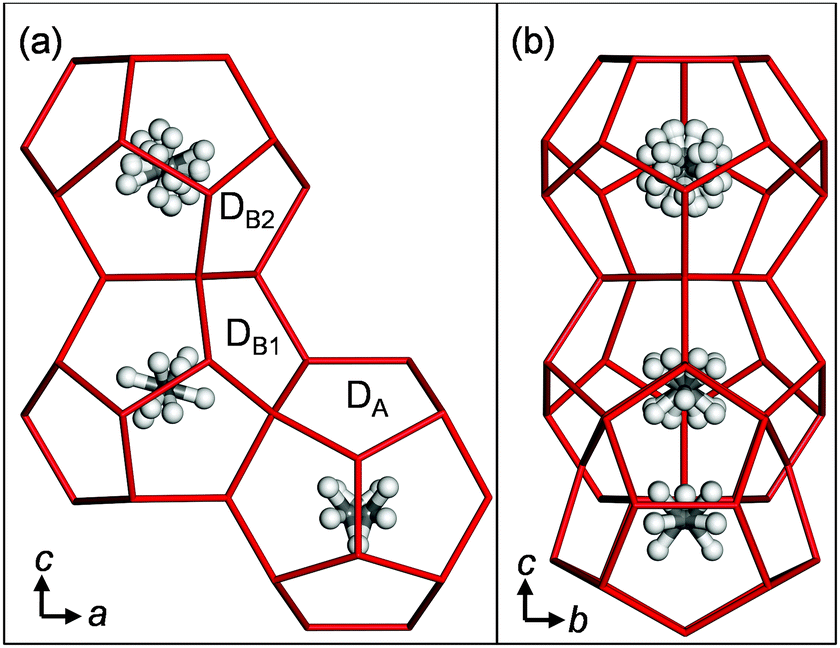 | ||
| Fig. 1 Three D cages in the TBAB + CH4 hydrate. (a) A view from the b axis. (b) A view from the a axis. | ||
The results show that CH4 molecules prefer the regular quasi-spherical DB cages rather than the distorted aspherical DA cage, whereas CO2 prefers the elongated DA cage. The averaged occupancies over all cage types by CH4 and CO2 are close to each other, i.e., 0.719 and 0.616, respectively. Table S2 in the ESI† further compares the D cage symmetries between ionic and canonical clathrate hydrates. This relationship between D cage occupancies gives an explanation for the formation conditions of TBAB hydrate formed with CH4 and/or CO24c,6a,8 (see Fig. 2). Phase equilibrium data of the TBAB + CH4 and TBAB + CO2 hydrates with TBAB mole fractions in the aqueous phase xTBAB = 0.013 and 0.026 are available.4c,6a They are fairly close as shown in Fig. 2. With xTBAB ∼ 0.013, equilibrium conditions of TBAB hydrates formed with CH4 + CO2 mixed gas were also reported.8 With this solution, there is about 0.3 K of equilibrium temperature difference between TBAB + CH4 and TBAB + CO2 hydrates. However, TBAB + CH4 + CO2 hydrates show higher equilibrium temperatures, ∼1 K higher than the TBAB + CH4 or CO2 hydrate. In addition, the mixed CH4 + CO2 gas hydrate in the incongruent solution (xTBAB = 0.014) is as stable as the TBAB + CO2 and TBAB + CH4 hydrates in the congruent solution (xTBAB = 0.026 with the hydration number: 38). This is likely due to the fact that the distorted DA cages are occupied by CO2 and the regular DB cages are occupied by CH4. Consequently, the TBAB hydrate structure may be stabilized with the mixed gas.
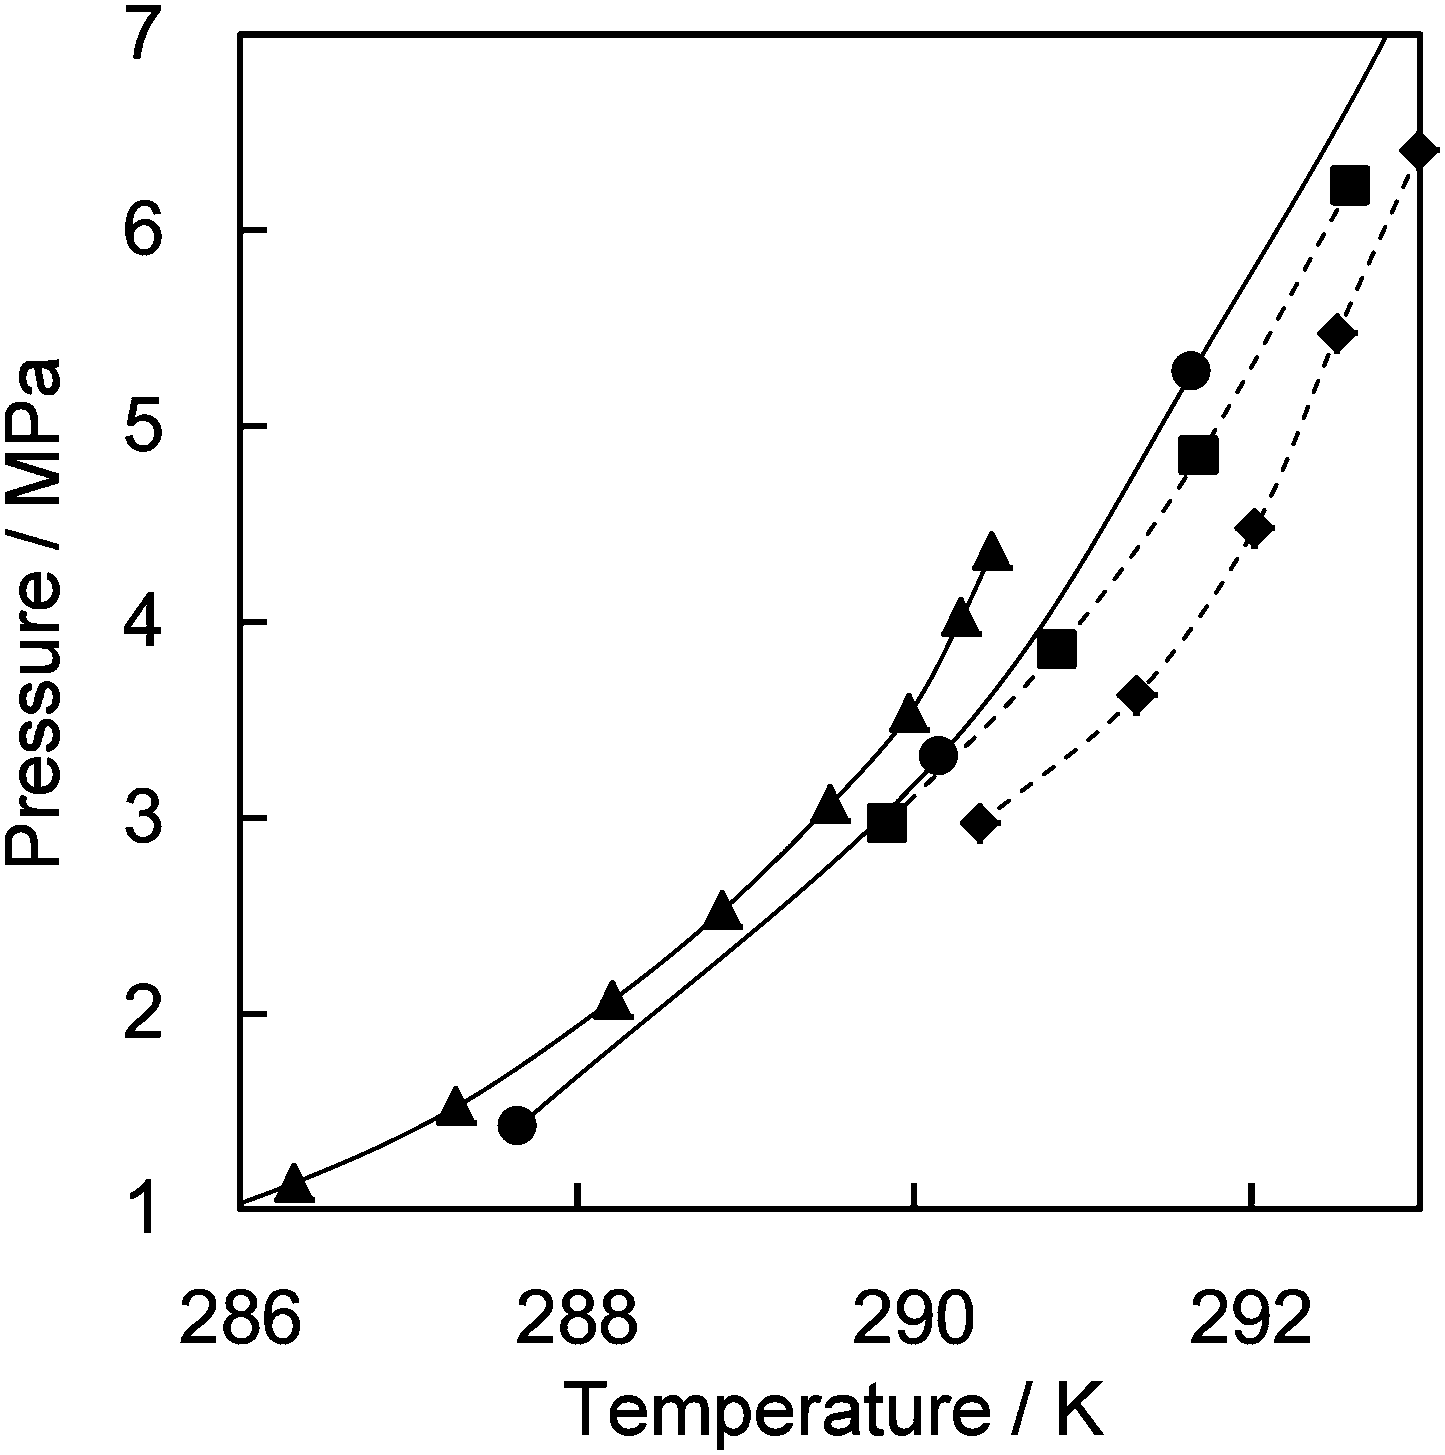 | ||
| Fig. 2 Phase diagram for TBAB + CH4 and/or CO2 hydrates. TBAB + CO2 hydrate:6a △, xTBAB = 0.026; ▲, xTBAB = 0.013. TBAB + CH4 hydrates:4c ○, xTBAB = 0.023; ●, xTBAB = 0.014. TBAB + CH4 + CO2:8 ◆, xTBAB = 0.014, yCO2 = ∼0.55; ■, xTBAB = 0.014, yCO2 = ∼0.35, where xTBAB and yCO2 denote the mole fraction of TBAB in an aqueous phase and the mole fraction of CO2 in a gas phase, respectively. | ||
Fig. 3 shows the cages with different shapes and symmetries occupied by CH4 and CO2. In the DA cage, CH4 is displaced from the central position along the c axis. In contrast, the carbon atom of CO2 is located at the center, and the CO2 guests have rotational motion in a plane which is almost perpendicular to the b axis and along the c axis.
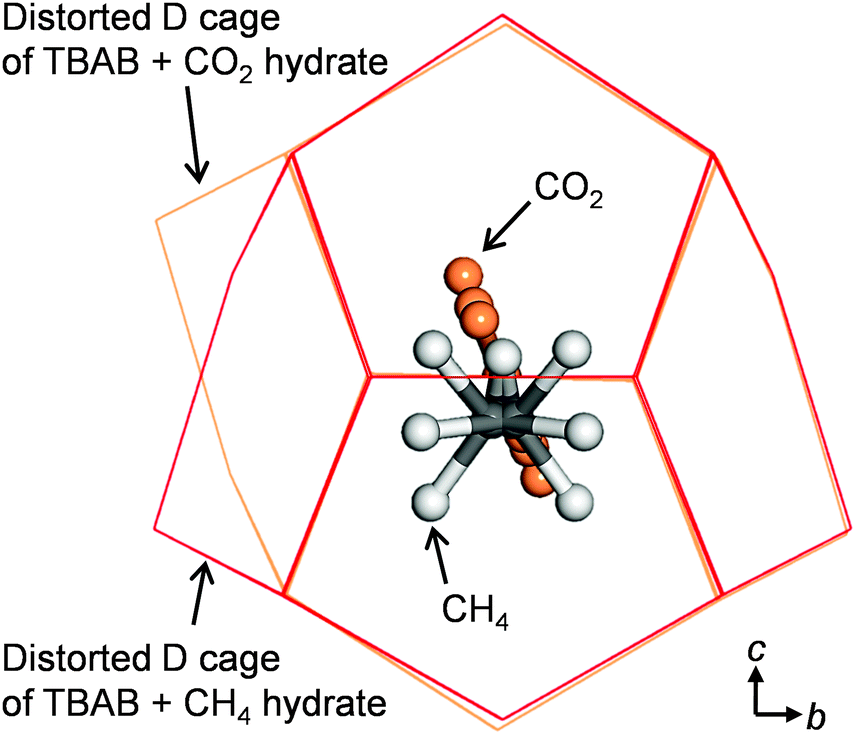 | ||
| Fig. 3 Comparison of guest gas positions between CH4 and CO22 in the distorted D cage (DA) of TBAB hydrate from a view of the a-axis. | ||
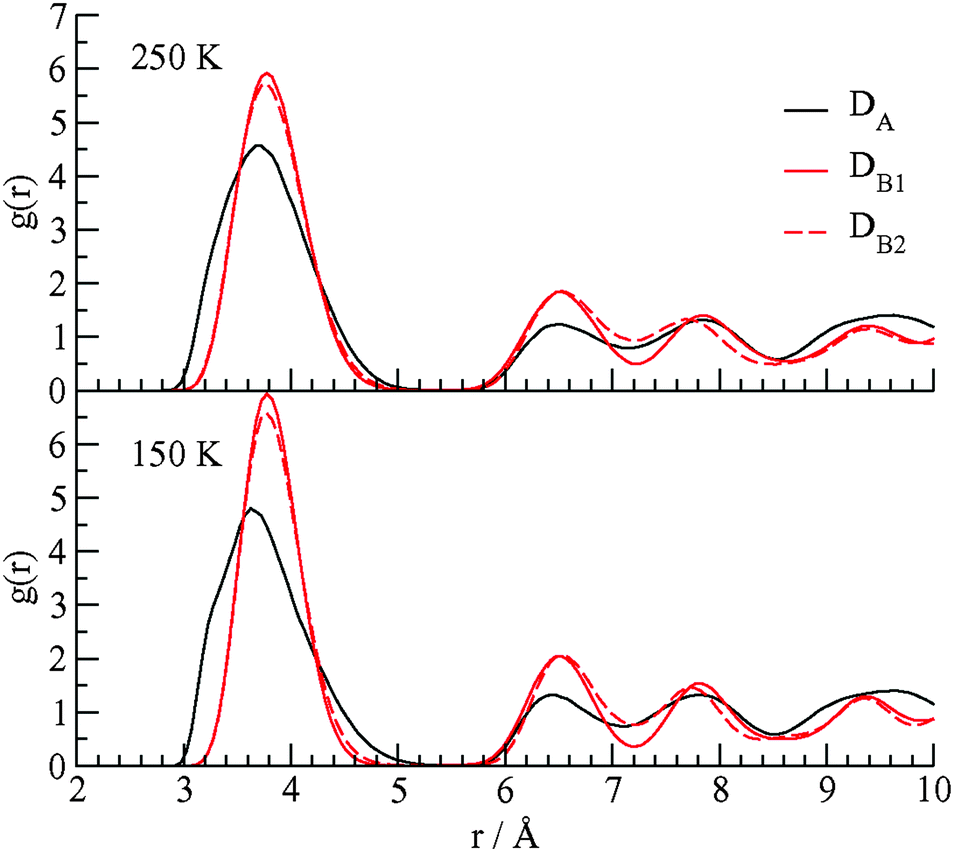
We performed molecular dynamics (MD) simulations on this system with CH4 cage occupancies corresponding to experimental values. The goal of the simulations is to detect the differences of structural and dynamical aspects of the methane guest motions in the two types of D cages. The details of the MD simulations are given in Notes‡ and the ESI.† In Fig. 4 we show the calculated radial distribution function (RDF) for cage water oxygen atoms with the methane carbon atoms at 150 and 250 K.
 | ||
| Fig. 4 The RDF for the methane carbon atom–water oxygen atom in the three D cages of the TBAB + CH4 ionic hydrate at 150 and 250 K. | ||
The DA cages are distorted and elongated along the direction which allows the methane guest molecules to approach some cage water molecules at distances between 3 and 3.2 Å. There is much smaller probability of seeing methane molecules in the DB cages within this distance range of the cage waters. The elongation of the DA cage also leads to the first peak in the C⋯OW RDF in the DA cage being broader than the peaks in the DB cages. As the ionic clathrate hydrate does not dissociate over the temperature range of the simulations (150 K to 250 K), there will not be a change in the coordination number of the methane guests in the DA and DB cages, with respect to water oxygens, associated with the changes in temperature. The changes in the RDF include broadening of the first peaks at higher temperature which is related to the increase of amplitude of the methane motions in the cages.
The dynamics of the methane molecules in the D cages is studied using the velocity autocorrelation function (VACF), ψ(t) = 〈νi(t)·νi(0)〉/〈νi(0)·νi(0)〉 where νi(t) is the velocity of methane i at time t and the brackets represent an average over all methane molecules in a particular type of D cage. The velocity autocorrelation functions for methane in the DA, DB1, and DB2 cages at 150 and 250 K are shown in Fig. 5.
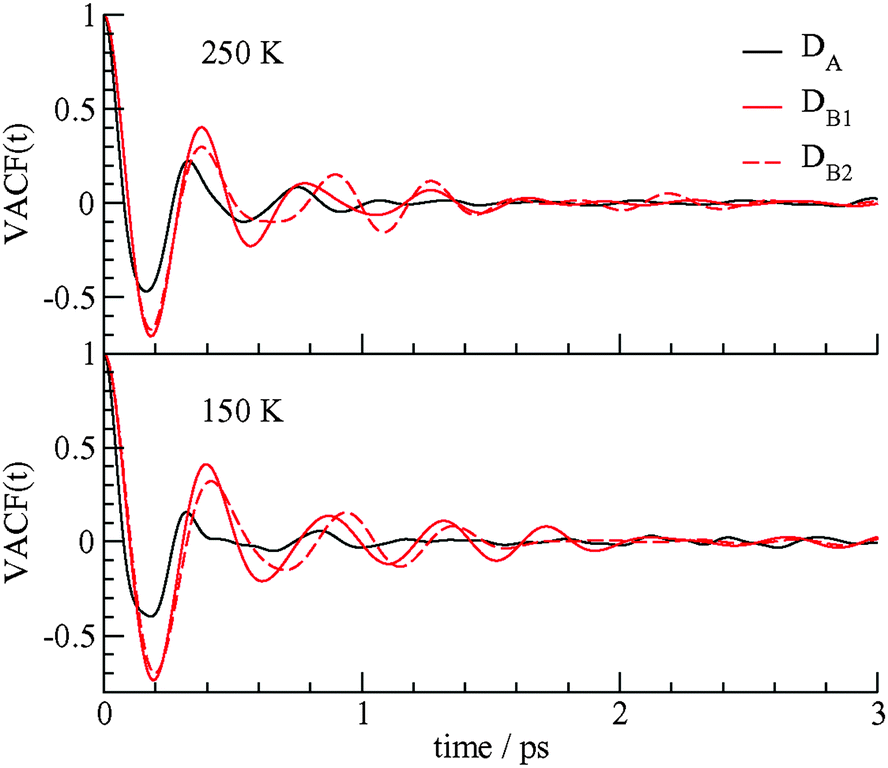 | ||
| Fig. 5 The velocity autocorrelation function of the methane carbon atoms in the DA, DB1, and DB2 cages at 150 and 250 K. | ||
The motions of the methane molecules in the DB1 and DB2 cages are more regular and a greater number of rattling vibration cycles are observed in these cage types before the motion is randomized. The motions of the methane molecules in the DA cages have a smaller initial period and the VACF of the methane guests in the DA cages decays to 0 after about 1 ps, whereas periodic behavior for the motion of the methane guests in the DB cages continues over times of 2 ps or longer. The dynamics of the methane molecules in the DB1 and DB2 cages are somewhat different and ψ(t) is sensitive enough to differentiate between these two cage types. The different dynamics of the methane guests in the DA and DB cages may lead to different spectroscopic signatures for the guests in the two types of cages. The VACF at different temperatures also reflect the higher amplitude, slightly higher frequency motion, and faster decay of velocity correlations of methane guests at 250 K compared to 150 K. These results of Fig. 4 and 5 confirm that the low symmetry D cages hold the methane guest molecules more loosely than the more structurally regular DB cages.
The results of methane uptake by TBAB show that physical adsorption properties of clathrate hydrates for developing gas capture technology can be further improved by crystal engineering with ionic guests. For example, to maximize the separation of CO2 from methane it would be best to have a clathrate host that would have all asymmetric cages to select CO2 over methane. So far, the drastic differences in D cage capacities for CH4 and CO2 have remained unknown and all D cages have been treated as identical. Information as obtained in these structural studies is also critically important for developing quantitative models for the sorption behavior.
This study was subsidized in part by the Keio University Global Center of Excellence Program. SM thanks for the support provided by the Japan Society for the Promotion of Science (JSPS) (grant no. 23-56572).
Notes and references
- (a) D. W. Davidson and J. A. Ripmeester, in Inclusion Compounds, ed. J. L. Atwood, J. E. D. Davies and D. D. MacNicol, Academic Press, London, 1984, ch. 3, vol. 3 Search PubMed; (b) J. A. Ripmeester and C. I. Ratcliffe, Energy Fuels, 1998, 12, 197–200 CrossRef CAS; (c) J. A. Ripmeester, J. S. Tse, C. I. Ratcliffe and B. M. Powell, Nature, 1987, 325, 135–136 CrossRef CAS; (d) S. Subramanian and E. D. Sloan, Fluid Phase Equilib., 1999, 158–160, 813–820 CrossRef CAS; (e) T. Uchida, R. Okabe, K. Gohara, S. Mae, Y. Seo, H. Lee, S. Takeya, J. Nagao, T. Ebinuma and H. Narita, Can. J. Phys., 2003, 81, 359–366 CrossRef CAS; (f) R. Susilo, J. A. Ripmeester and P. Englezos, Chem. Eng. Sci., 2007, 62, 3930–3939 CrossRef CAS; (g) P. M. Rodger, J. Phys. Chem., 1990, 94, 6080–6089 CrossRef CAS; (h) J. S. Tse, M. L. Klein and I. R. McDonald, J. Phys. Chem., 1983, 87, 4198–4203 CrossRef CAS; (i) H. Tanaka and K. Kiyohara, J. Chem. Phys., 1993, 98, 8110–8118 CrossRef CAS; (j) M. Hiratsuka, R. Ohmura, A. K. Sum and K. Yasuoka, J. Chem. Phys., 2012, 137, 044508 CrossRef PubMed.
- S. Muromachi, K. A. Udachin, K. Shin, S. Alavi, I. L. Moudrakovski, R. Ohmura and J. A. Ripmeester, Chem. Commun., 2014, 50, 11476–11479 RSC.
- (a) G. A. Jeffrey, in Inclusion Compounds, ed. J. L. Atwood, J. E. D. Davies and D. D. MacNicol, Academic Press, London, 1984, ch. 5, vol. 1 Search PubMed; (b) Y. A. Dyadin and K. A. Udachin, J. Struct. Chem., 1987, 28, 75–116 CrossRef CAS.
- (a) S. Adisasmito, R. J. Frank III and E. D. Sloan Jr., J. Chem. Eng. Data, 1991, 36, 68–71 CrossRef CAS; (b) K. Yasuda and R. Ohmura, J. Chem. Eng. Data, 2008, 53, 2182–2188 CrossRef CAS; (c) M. Arjmandi, A. Chapoy and B. Tohidi, J. Chem. Eng. Data, 2007, 52, 2153–2158 CrossRef CAS.
- (a) P. Zhang, Z. W. Ma and R. Z. Wang, Renewable Sustainable Energy Rev., 2010, 14, 598–614 CrossRef CAS; (b) A. Chapoy, R. Anderson and B. Tohidi, J. Am. Chem. Soc., 2007, 129, 746–747 CrossRef CAS PubMed; (c) N. H. Duc, F. Chauvy and J.-M. Herri, Energy Convers. Manage., 2007, 48, 1313–1322 CrossRef CAS.
- (a) N. Ye and P. Zhang, J. Chem. Eng. Data, 2012, 57, 1557–1562 CrossRef CAS; (b) S. Muromachi, H. Hashimoto, T. Maekawa, S. Takeya and Y. Yamamoto, Fluid Phase Equilib., 2016, 413, 249–253 CrossRef CAS.
- (a) W. Shimada, M. Shiro, H. Kondo, S. Takeya, H. Oyama, T. Ebinuma and H. Narita, Acta Crystallogr., Sect. C: Cryst. Struct. Commun., 2005, C61, o65–o66 CAS; (b) S. Muromachi, S. Takeya, Y. Yamamoto and R. Ohmura, CrystEngComm, 2014, 16, 2056–2060 RSC; (c) T. Kobori, S. Muromachi, T. Yamasaki, S. Takeya, Y. Yamamoto, S. Alavi and R. Ohmura, Cryst. Growth Des., 2015, 15(8), 3862–3867 CrossRef CAS.
- H. Y. Acosta, P. R. Bishnoi and M. A. Clarke, J. Chem. Eng. Data, 2011, 56, 69–73 CrossRef CAS.
- (a) G. M. Sheldrick, Acta Crystallogr., 1990, A46, 467 CrossRef CAS; (b) G. M. Sheldrick, Acta Crystallogr., 1993, A49(suppl), C53 Search PubMed.
- J. L. F. Abascal, E. Sanz, R. Garcia Fernandez and C. Vega, J. Chem. Phys., 2005, 122, 234511 CrossRef CAS PubMed.
- W. D. Cornell, P. Cieplak, C. L. Bayly, I. R. Gould, K. M. Merz Jr., D. M. Ferguson, D. C. Spellmeyer, T. Fox, J. W. Caldwell and P. A. Kollman, J. Am. Chem. Soc., 1995, 117, 5179 CrossRef CAS See also, http://ambermd.org.
- J. N. Canongia Lopes and A. A. H. Pádua, J. Phys. Chem., 2006, 110, 19586–19595 CrossRef CAS PubMed.
- C. M. Breneman and K. B. Wiberg, J. Comput. Chem., 1990, 11, 361 CrossRef CAS.
- M. J. Frisch, G. W. Trucks, H. B. Schlegel, G. E. Scuseria, M. A. Robb, J. R. Cheeseman, G. Scalmani, V. Barone, B. Mennucci and G. A. Petersson, et al., Gaussian 09, Revision D.01, Gaussian, Inc., Wallingford CT, 2009 Search PubMed.
Footnotes |
| † Electronic supplementary information (ESI) available: Experimental and computational details. CCDC 1431843. For ESI and crystallographic data in CIF or other electronic format see DOI: 10.1039/c6cc00264a |
| ‡ Crystallographic data for TBAB·38H2O·0.688CH4: MoKα radiation (λ = 0.71070 Å), crystal size 0.6 × 0.2 × 0.2 mm, orthorhombic, space group Pmma, a = 21.0329(15) Å, b = 12.5972(9) Å, c = 12.0333(8) Å, Z = 2, volume 3188.3(4) Å3, density 1.067 g cm−3; μ(MoKα) = 0.723 mm−1, temperature 100.0(1) K, scan mode (1.69 < 2θ < 29.00), reflections collected/unique 4515/4169, 528 parameters. The structure was solved and refined using the SHELX program9 with full matrix least squares on F2, GOF (F2) 1.175; final R indices (I >2σ(I)): R1 = 0.0549, wR2 = 0.1649; R indices (all data) R1 = 0.0592, wR2 = 0.1670. CCDC 1431843. The intermolecular van der Waals potentials between atoms in different molecules are considered to be the sum of Lennard-Jones (LJ) and electrostatic point charges. The TIP4P four-charge water molecular model was used.10 TBA ions were modelled with the general AMBER force field,11 and the force field for bromide by Canongia Lopes and Pádua.12 The Tse-Klein-McDonald potential1h was chosen for methane helper guest molecules. Partial electrostatic charges on the atoms of the guest molecules were determined from charges using electrostatic potential grid (CHELPG) calculations13 with the Gaussian 09 suite of programs14 at the B3LYP/6-311++G(d,p) level of theory. Temperatures of 100 (X-ray structure determination temperature), 200, and 250 K with ambient pressure were used in the simulations. The used parameters and further detailed methods are given in the ESI.† |
| This journal is © The Royal Society of Chemistry 2016 |