 Open Access Article
Creative Commons Attribution 3.0 Unported Licence
Subtle temperature-induced changes in small molecule conformer dynamics – observed and quantified by NOE spectroscopy†
C. R.
Jones
a,
M. D.
Greenhalgh
a,
J. R.
Bame
a,
T. J.
Simpson
a,
R. J.
Cox
ab,
J. W.
Marshall
a and
C. P.
Butts
*a
aSchool of Chemistry, University of Bristol Cantocks Close, Bristol, BS8 1TS, UK. E-mail: Craig.Butts@bristol.ac.uk
bLeibniz Universität Hannover, Institut für Organische Chemie, Schneiderberg 1B, 30167 Hannover, Germany
First published on 15th January 2016
Abstract
NOE–distance relationships are shown to be sufficiently accurate to monitor very small changes in conformer populations in response to temperature (<0.5%/10 °C) – in good agreement with Boltzmann-predictions, illustrating the effectiveness of accurate NOE–distance measurements in obtaining high quality dynamics as well as structural information for small molecules.
The measurement of solution-state conformational dynamics of small molecules is a challenging problem for numerous fields. Drug-design, mechanistic studies and understanding of intermolecular interactions are all reliant on the assessment of dynamic behaviour of flexible molecules in the solution state. Nuclear Overhauser effect (NOE) measurements in NMR spectroscopy are well established as a tool to determine stereochemical and conformational details of molecular structure.1 We and others have recently defined the accuracy of quantitative NOE–distance analysis in both small molecules2–4 and proteins,5–7 thus providing more precise methods for probing the details of these. Herein, we report that even very small changes in small molecule conformational dynamics – such as those caused by temperature – can be quantified accurately in solution by NOE techniques.
Traditionally, NMR data for small molecules from solution-state measurements e.g. chemical shifts, coupling constants and NOEs, have been used to elucidate gross conformation. However, they have been considered less useful for drawing detailed structural conclusions such as the small population changes engendered by conformational dynamics in response to stimuli e.g. binding or changes in temperature, solvent, etc. Instead, such analyses rely on computation – specifically calculated conformer energies (and thus populations) in order to interpret results. While often applied, this reliance on energy calculations is ultimately unsatisfactory. Energies (and thus populations) calculated by standard computational methods, e.g. molecular mechanics or Density Functional Theory (DFT), struggle to achieve chemical accuracy. Indeed, only the most advanced composite computational methods, such as Gaussian-4,8 can obtain energies considered to be accurate to much less than 1 kcal mol−1 and these can take days-to-weeks to complete and require high levels of expertise. This inaccuracy is a severe impediment for conformational analysis as even optimistic assumptions of accuracy in computed energies, say, ±2 kJ mol−1, could accommodate a range of conformer populations e.g. it could accommodate two conformers with 30![[thin space (1/6-em)]](https://www.rsc.org/images/entities/char_2009.gif) :
:![[thin space (1/6-em)]](https://www.rsc.org/images/entities/char_2009.gif) 70 or 70
70 or 70![[thin space (1/6-em)]](https://www.rsc.org/images/entities/char_2009.gif) :
:![[thin space (1/6-em)]](https://www.rsc.org/images/entities/char_2009.gif) 30 population ratios at room temperature, i.e. the population of each conformer could more than double or halve depending on the error in calculation. This has led to the use of quantitative NMR-based population analysis, exemplified by the NAMFIS (NMR Analysis of Molecular Flexibility In Solution)9 approach exploited in the DISCON software package.
30 population ratios at room temperature, i.e. the population of each conformer could more than double or halve depending on the error in calculation. This has led to the use of quantitative NMR-based population analysis, exemplified by the NAMFIS (NMR Analysis of Molecular Flexibility In Solution)9 approach exploited in the DISCON software package.
With this in mind, we have recently demonstrated that interproton distance information obtained from NOE experiments in NMR spectroscopy can accurately assess the population of small molecule conformers in solution without relying on accurately calculated conformer energies.3,4 Indeed, in these cases conformer populations can be accurately refined on the basis of NOE-derived distances and calculated conformer geometries (which are computationally inexpensive) alone. We have further demonstrated the potential of high accuracy NOE–distance analysis for solving intractable stereochemical problems e.g. a doubly quaternary epoxide in the marine natural product conicasterol,10 and conformational challenges such as highly flexible conformationally biased synthetic homologated alkanes.11
Herein we extend the limits of high accuracy NOE–distance determination in conformational analysis of small molecules by observing subtle temperature-induced changes in conformer populations in solution (<0.5%/10 °C).
The temperature dependence of NOE measurements in proteins, corresponding to substantial conformational changes, is well established in semi-quantitative fashion in a range of systems.12 Leitz et al. have shown recently that the temperature dependence of 1HN–1HN distances can be quantitatively analysed using NOE/cross-relaxation rates (based on fitting of the NOE build-up curves to derivations of the Solomon equation for three dipolar-coupled spins) in a deuterated example of the protein ubiquitin.13 While highly accurate, these methods are complex both experimentally, requiring high levels of deuteration, and in terms of data analysis. They also rely heavily on the established nature of protein dynamics which is not conveniently or generally applicable to small molecules.
In the realm of small molecules, there has been very little high accuracy NOE-assessment of temperature on conformational behaviour. Urakawa et al. reported on the effect of temperature on NOE–distance analysis of the conformational behaviour of the alkaloid cinchonidine,14 however the data presented was not consistent with Boltzmann behaviour. Their NOESY-DFT fit analysis on increasing the temperature from 280 to 320 K suggested a decrease in “open” conformer populations from 83 to 70%, and a concomitant doubling of “closed” conformer populations from 17 to 30%. This is somewhat surprising as a simple Boltzmann analysis suggests that this 40 K temperature range should only change the populations from ∼78% to ∼73% (open) and ∼22% to ∼27% (closed) given the NOESY-DFT fit at 300 K (75% open, 25% closed) and whether this small effect should even be observable in the NOE data (which is only sensitive to short distances) of cinchonidine is not discussed.
To test the sensitivity of high-accuracy NOE–distance analysis to changes in small molecule conformational dynamics, we re-examined the report of Urakawa et al. 1D-NOESY spectra were acquired at 298 K and 323 K on quinine, which differs from cinchonidine only by the addition of a methoxy group, and has been shown to yield an analogous distribution of open and closed conformers.15,16 In line with our expectations, the changes in NOE intensities for protons in the conformationally mobile portions of quinine from spectra at 298 K and 323 K were minimal and no greater than those between protons in immobile portions, e.g. CH2 units. This strongly suggests that the time-averaged interproton distances change by much less than the inherent error in the NOE measurements and any temperature effects reported for cinchonidine previously were within experimental error of the NOE analysis performed (Urakawa et al. themselves suggest distance errors of ±10% for their data, which corresponds to ∼75% errors in NOE intensity). Consequently, it seems appropriate to apply high accuracy NOE–distance analysis to small molecule examples where temperature should be expected (vide infra) to induce measurable changes in the conformational distribution, in this case two examples – a synthetic lactone (5-methyl-4((E)-styryl)dihydrofuran-2(3H)-one) 1 and strychnine.
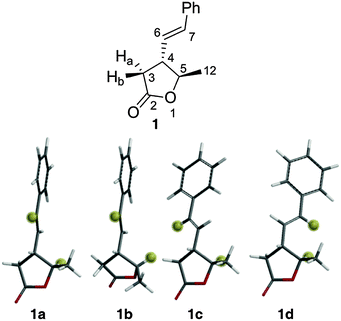
Lactone 1 (Fig. 1) is a secondary metabolite produced by the Gammaproteobacterium Photorhabdus luminescens17 but was generated by synthesis for this study. Rotation around the C4–C6 bond of 1 results in a number of conformers where the interproton distance between the ring proton H5 and the alkene proton H7 is either ∼4.0 Å or ∼2.2 Å. We have shown previously that this situation can give rise to very sensitive NOE-detection of conformer populations at room temperature.4
 | ||
| Fig. 1 Labelled structure of lactone 1 (above) and low energy conformers (below) with H5 and H7 highlighted for clarity. | ||
A conformational search18 at the MMFFs level found 12 conformers of 1 within 50 kJ mol−1 of the global minimum. After DFT geometry optimisation (B3LYP/6-31g*)19 6 conformers remained within 50 kJ mol−1 – differing in their torsion angles around the C4–C6 bond and the conformation of the 5-membered ring. The energies of these conformers were then subjected to zero-point, thermal and entropic corrections and inclusion of solvation free energies (see ESI† for details). At this point only four of the conformers, 1a, 1b, 1c and 1d (Fig. 1) were found to have energies within 15 kJ mol−1 (>0.2% population) of the global minimum conformer (1a) – the other two conformers were thus not considered further. 1a, 1c and 1d have the same ring conformation, but 1b (and the two excluded high-energy conformers) have a second envelope ring conformation. The relative calculated free energies of 1a, 1b, 1c and 1d, along with their corresponding (Boltzmann) populations at 25 °C are shown (labelled ‘DFT’) in Table 1.
| H5–H7 distance/Å | DFT ΔGsolv/kJ mol−1 | DFT popul./% | NOE ΔGsolv/kJ mol−1 | NOE popul./% | |
|---|---|---|---|---|---|
| 1a | 4.34 | 0.0 | 89.3 | 0.0 | 79.3 |
| 1b | 3.90 | 6.9 | 5.6 | 6.4 | 6.0 |
| 1c | 3.92 | 8.1 | 3.4 | 4.7 | 11.9 |
| 1d | 2.16 | 10.3 | 1.4 | 8.3 | 2.8 |
NOE-derived 1H–1H distances‡ for all protons of 1 were first obtained at 25 °C from 1D-NOESY spectra. NOE build-up curve analysis using the PANIC method20 showed linear build-up to around 800 ms, and therefore a mixing time of 500 ms was deemed sensible. We have previously demonstrated that NOE–distance analysis, using PANIC to correct for external relaxation effects, provides very accurate assessments of conformer populations at room temperature3 – with equal or greater accuracy than standard DFT computational methods – hence, the populations of conformers 1a, 1b, 1c and 1d were recalculated (labelled ‘NOE’ in Table 1) so that the conformer-weighted NOEs fitted best with the NOE-derived distances at 25 °C (Table S6, ESI,† Mean Absolute Error = 2.7%). The effective relative energies derived from the NOE-populations are also shown in Table 1 and all subsequent discussion and temperature analyses were performed using these NOE-derived relative energies and populations.
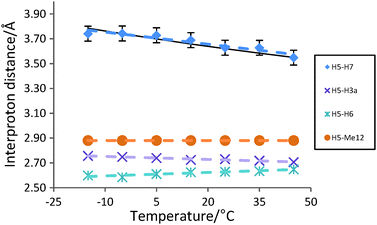
Interproton distances for H5 were then examined across a temperature range of −15 °C to +45 °C by measuring the relative NOE intensities from H5 to H7, H6, Me12 and H3a at each temperature. The average H5–H7, H5–H6 and H5–H3a NOE-derived distances were calculated relative to the H5–Me12 distance (2.88 Å) which is constant in all conformers and is temperature-insensitive.
Based on the room temperature NOE-derived populations (and thus relative energies) in Table 1, then increasing the temperature from −15 °C to +45 °C will change the populations for 1a, 1b, 1c and 1d from 84.5/4.2/9.5/1.8% to 76.8/6.8/13.0/3.4% respectively and thus decrease the time-averaged interproton distance between H5 and H7 from 3.78 Å to 3.55 Å (a change of 6.2%). On the other hand, the average H5–H3a and H5–H6 distances should be substantially less sensitive to temperature effects, with predicted changes of +0.01 Å and +0.02 Å (<1%) respectively.
In the event, the NOE-derived interproton distances for H5 of lactone 1 (Fig. 2) fit extremely well with the predicted trend, with the average H5–H7 distance decreasing by ∼5% from 3.74 Å to 3.55 Å as temperature increases from −15 °C to +45 °C. Meanwhile the H5–H3a and H5–H6 NOE-derived distances vary very little (<0.06 Å, <2%) across the same temperature range, within the expected 3% error bounds of each NOE–distance measurement – supporting the proposal that the H5–H7 NOE–distance changes are indeed derived from the perturbation of conformer populations.
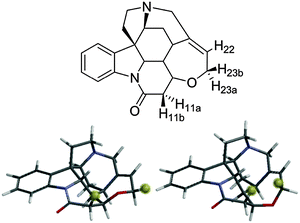
Further confirmation of the sensitivity of NOE–distance analysis to subtle changes in conformer populations is provided by applying this same analysis to temperature effects on the interproton distances of strychnine. We recently reported a very low level second conformer of strychnine (Fig. 3)4 based on the observation that the H11b–H23b intra-ring NOE–distance was ∼0.6 Å (15%) shorter than expected on the basis of X-ray crystallographic results21 and DFT calculations.22 The H11b–H23b distance for the minor conformer of strychnine was approximately half that of the major conformer (2.11 Å vs. 4.10 Å), and was assessed to have a population of ∼2% (corresponding to a 9–10 kJ mol−1 free energy difference) compared to the major conformer (Fig. 3). This situation mirrors that of the lactone 1 example, vide supra, so increasing temperature should also cause a shortening of the H11b–H23b NOE-derived distance for strychnine.
 | ||
| Fig. 3 Strychnine with key protons labelled (above) with major (∼98%, lower left) and minor (∼2%, lower right) conformers with H11b and H23b highlighted for clarity. | ||
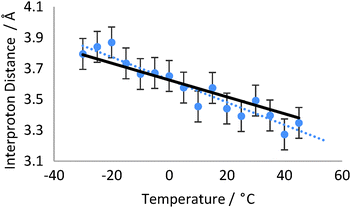
1D-NOESY spectra were obtained across a temperature range of −30 °C to +45 °C for H23b of strychnine in toluene-d8, and measuring the relative NOE intensities for H11b and H22.
The H11b–H23b NOE-derived distance was calculated relative to the H23b–H22 distance, which is ∼2.39 Å for all temperatures studied.§ The populations of the major and minor conformers were recalculated to give the best fit to the NOE-derived distances at 5 °C (98.0![[thin space (1/6-em)]](https://www.rsc.org/images/entities/char_2009.gif) :
:![[thin space (1/6-em)]](https://www.rsc.org/images/entities/char_2009.gif) 2.0%) and all temperature analyses were subsequently performed on this basis. Increasing the temperature from −30 °C to +45 °C should thus correspond to a Boltzmann population change from 98.9/1.1% to 95.9/4.1%. This would decrease the NOE-observed interproton distance between H11b and H23b by 10.1% from 3.79 Å to 3.38 Å. Experimentally the NOE-derived distances across the temperature range of −30 °C to +45 °C (Fig. 4) fit very well with this predicted trend, falling by 11.8% from 3.80 Å to 3.35 Å over the 75 K temperature range, corresponding to a predicted population change of 99.2/0.8% to 96.6/3.4%. Due to the limited solubility of strychnine in toluene-d8 and the increasing losses from relaxation at high temperatures, the H11b–H23b NOE data became very weak at the highest temperatures however the distance measured at each temperature was still reliably within the 3–4% error limits we have observed in studies of static molecular examples.
2.0%) and all temperature analyses were subsequently performed on this basis. Increasing the temperature from −30 °C to +45 °C should thus correspond to a Boltzmann population change from 98.9/1.1% to 95.9/4.1%. This would decrease the NOE-observed interproton distance between H11b and H23b by 10.1% from 3.79 Å to 3.38 Å. Experimentally the NOE-derived distances across the temperature range of −30 °C to +45 °C (Fig. 4) fit very well with this predicted trend, falling by 11.8% from 3.80 Å to 3.35 Å over the 75 K temperature range, corresponding to a predicted population change of 99.2/0.8% to 96.6/3.4%. Due to the limited solubility of strychnine in toluene-d8 and the increasing losses from relaxation at high temperatures, the H11b–H23b NOE data became very weak at the highest temperatures however the distance measured at each temperature was still reliably within the 3–4% error limits we have observed in studies of static molecular examples.
It is important to consider that the relative intensities of the NOEs also depend on the relative rates of molecular tumbling and conformer exchange (and both change with temperature). However, this will only substantially affect the experimental NOE–distance relationship if the conformer exchange rate is fast relative to the tumbling rate at some temperatures. 13C T1 measurements and molecular dynamics simulations were used to estimate the rate of molecular tumbling and conformer exchange rates respectively, for both 1 and strychnine, and suggest that conformer exchange is occurring substantially slower than overall molecular tumbling across all temperatures (see ESI,† for full details). Hence, the effects of the temperature change on the kinetics of the internal motion are not treated further here. Another source of potential perturbation by temperature is its effect on external relaxation for each NOE, however the use of PANIC-corrected,20 rather than absolute, NOE intensities here implicitly largely corrects for external relaxation effectively minimising any temperature-induced contributions.
In conclusion, measurement of high accuracy NOE–distances allows the observation of very small temperature-induced conformational changes in solution, in good agreement with the expected Boltzmann behaviour. Such discrimination could have potential applications in examining detailed changes in molecular conformation in solution under a variety of circumstances e.g. intermolecular binding and changes in external conditions (solvent, temperature, pH). For fast tumbling small molecules, the limitations of this technique are primarily based in describing the conformational space of the molecule to be examined i.e. ensuring that conformational searching captures all contributing conformers, however this method has the substantial advantage that high accuracy energy calculations are not required in order to make quantitative interpretations of the populations of identified species.
We thank the University of Bristol for funding for CRJ, BBSRC and Mark Evans Scholarship for funding JWM and the Bristol Chemical Synthesis Doctoral Training Centre, funded by EPSRC(EP/G036764/1) for a studentship for MDG.
Notes and references
- D. Neuhaus and M. P. Williamson, The Nuclear Overhauser Effect in Structural and Conformational Analysis, Wiley-VCH, New York, 2 edn, 2000 Search PubMed.
- C. P. Butts, C. R. Jones, E. C. Towers, J. L. Flynn, L. Appleby and N. J. Barron, Org. Biomol. Chem., 2011, 9, 177–184 CAS.
- C. R. Jones, C. P. Butts and J. N. Harvey, Beilstein J. Org. Chem., 2011, 7, 145–150 CrossRef CAS PubMed.
- C. P. Butts, C. R. Jones and J. N. Harvey, Chem. Commun., 2011, 47, 1193–1195 RSC.
- B. Vogeli, M. Friedmann, D. Leitz, A. Sobol and R. Riek, J. Magn. Reson., 2010, 204, 290–302 CrossRef PubMed.
- B. Vogeli, S. Kazemi, P. Guntert and R. Riek, Nat. Struct. Mol. Biol., 2012, 19, 1053–1057 Search PubMed.
- B. Vogeli, S. Olsson, R. Riek and P. Guntert, J. Struct. Biol., 2015, 191, 306–317 CrossRef CAS PubMed.
- L. A. Curtiss, P. C. Redfern and K. Raghavachari, J. Chem. Phys., 2007, 126, 084108 CrossRef PubMed.
- D. O. Cicero, G. Barbato and R. Bazzo, J. Am. Chem. Soc., 1995, 117, 1027–1033 CrossRef CAS.
- M. G. Chini, C. R. Jones, A. Zampella, M. V. D'Auria, B. Renga, S. Fiorucci, C. P. Butts and G. Bifulco, J. Org. Chem., 2012, 77, 1489–1496 CrossRef CAS PubMed.
- M. Burns, S. Essafi, J. R. Bame, S. P. Bull, M. P. Webster, S. Balieu, J. W. Dale, C. P. Butts, J. N. Harvey and V. K. Aggarwal, Nature, 2014, 513, 183–188 CrossRef CAS PubMed.
- See for example: M. Iwadate, T. Asakura and M. P. Williamson, Eur. J. Biochem., 1998, 257, 479–487 Search PubMed; S. L. Chang, A. Szabo and N. Tjandra, J. Am. Chem. Soc., 2003, 125, 11379–11384 CrossRef CAS PubMed; S. Ramboarina and C. Redfield, J. Am. Chem. Soc., 2008, 130, 15318–15326 CrossRef PubMed.
- D. Leitz, B. Vogeli, J. Greenwald and R. Riek, J. Phys. Chem. B, 2011, 115, 7648–7660 CrossRef CAS PubMed.
- A. Urakawa, D. M. Meier, H. Rugger and A. Baiker, J. Phys. Chem. A, 2008, 112, 7250–7255 CrossRef CAS PubMed.
- H. Caner, P. U. Biedermann and I. Agranat, Chirality, 2003, 15, 637–645 CrossRef CAS PubMed.
- T. H. A. Silva, A. B. Oliveira and W. B. DeAlmeida, Struct. Chem., 1997, 8, 95–107 CrossRef CAS.
- R. Kontnik, J. M. Crawford and J. Clardy, Chem. Biol., 2010, 5, 659 CAS.
- (a) MacroModel, version 8.5, Schrodinger LLC, New York, 2003 Search PubMed; (b) F. Mohamadi, N. G. Richards, W. C. Guida, R. Liskamp, M. Lipton, C. Caufield, G. Chang, T. Hendrickson and W. C. Still, J. Comput. Chem., 1990, 11, 440 CrossRef CAS.
- M. J. Frisch, et al., Gaussian 09, Revision A1, Gaussian, Inc., Wallingford CT, 2009 Search PubMed. See ESI,† for full reference.
- H. T. Hu and K. Krishnamurthy, J. Magn. Reson., 2006, 182, 173–177 CrossRef CAS PubMed.
- M. Messerschmidt, S. Scheins and P. Luger, Acta Crystallogr., Sect. B: Struct. Sci., 2005, 61, 115–121 Search PubMed.
- A. Bagno, F. Rastrelli and G. Saielli, Chem. – Eur. J., 2006, 12, 5514–5525 CrossRef CAS PubMed.
Footnotes |
| † Electronic supplementary information (ESI) available. See DOI: 10.1039/c5cc10509a |
| ‡ The determination of interproton distances from NOE data is based on comparison of relative NOE intensities for pairs of spins in 1D-transient experiments. Full details of the method and analysis can be found in the ESI.† |
| § The H23b–H22 distance is 2.39 Å in the major conformer and 2.51 Å in the minor conformer, but the contribution of the minor isomer affects the NOE-observed distance by <0.01 Å over the temperature range studied, hence is considered insensitive to temperature herein. |
| This journal is © The Royal Society of Chemistry 2016 |


