
Electrically conducting palladium selenide (Pd4Se, Pd17Se15, Pd7Se4) phases: synthesis and activity towards hydrogen evolution reaction†
Suresh
Kukunuri
,
P. Muthu
Austeria
and
S.
Sampath
*
Department of Inorganic and Physical Chemistry, Indian Institute of Science, Bangalore 560012, India. E-mail: sampath@ipc.iisc.ernet.in; Fax: +91-80-2360-0085; Tel: +91-80-2293-3315
First published on 21st October 2015
Abstract
Electrically conducting, continuous films of different phases of palladium selenides are synthesized by the thermolysis of single source molecular precursors. The films are found to be adherent on flat substrates such as glass, indium tin oxide and glassy carbon and are stable under electrochemical conditions. They are electrocatalytically active and in particular, for hydrogen evolution reaction. Catalytic activities with low Tafel slopes of 50–60 mV per decade are observed.
Hydrogen, as a clean renewable energy source, has attracted wide attention1 and its global production primarily stems from steam reforming which requires methane and access to high temperatures.2 In contrast, water electrolysis represents a clean, sustainable and environmentally friendly approach to generate H2. Platinum is known to be the most efficient and commonly used electrocatalyst for hydrogen evolution reaction (HER).3 Other metals from the platinum group are also known to be good catalysts and are explored for various reactions involving organic synthesis, oxygen reduction reaction and photocatalysis.4 Chalcogenides of palladium have attracted considerable attention in recent times and in particular the synthesis of various palladium sulphides and selenides has been reported.5–9 The compositions of PdS and Pd4S have been shown to exhibit good chemical stability and catalytic properties.5 Similarly, palladium and selenium form different phases such as PdSe, Pd17Se15, Pd7Se4, Pd4Se and PdSe2, and various synthetic methods including solid state synthesis, solvothermal method, template assisted synthesis, thermal decomposition of complexes and hydrothermal method have been reported.6–9
The thermal decomposition of a single molecular precursor is important among the synthetic routes because of its ease and use of relatively low temperatures.7–9 O'Brien et al. have reported the synthesis of metal selenides based on the low pressure chemical vapour deposition technique using platinum and palladium dithio/diselenoimido-diphosphinato complexes.7 Jain et al. have reported the synthesis of palladium selenides by thermal decomposition of metal benzylselenolate, 2-(diethylamino)ethaneselenolate, monoselen-ocarboxylate and 2-(methoxycarbonyl)ethyl-selenolate complexes,8 and Singh et al. have explored the synthesis of palladium selenides from the selenoether complexes of palladium.9a We have recently reported the use of didecylselenium based metal complexes to synthesize palladium selenides.9b The use of single source precursors to synthesize different phases of selenides is quite demanding as compared to solid state methods.10
Herein, we present the synthesis of various palladium selenides from the same palladium and selenium precursors containing different mole ratios by thermal decomposition. The films formed on glass substrates are well-characterized using electrical, microscopic and diffraction techniques. The electrocatalytic activity of palladium selenides has not been explored so far. It is found in the present study that they are excellent catalysts for driving electrochemical redox reactions and HER is used to exemplify this point.
Palladium selenide phases are obtained by thermolysis of palladium didecylselenium complexes. The complexes with different compositions are prepared by mixing different mole ratios of palladium acetate and didecyl selenide (DDSe) in toluene for 10 min under ambient conditions. The Se precursor (DDSe) is synthesized by adopting a reported procedure.11 In a typical synthetic procedure for the preparation of the complex, 40 μL of DDSe and 50 mg of Pd(OAc)2 are stirred for 10 min, at 25 °C. The complexes are represented as Bxy, where x and y denote the moles of Pd(OAc)2 and DDSe, respectively. The complexes are drop-cast on freshly cleaned glass slides of 1 cm2 area and the solvent is evaporated under ambient conditions. Subsequently, the thermal decomposition of the complexes is carried out in a tubular furnace at 250 °C for 1 h under a N2 atmosphere resulting in the formation of stable, continuous and shiny black colored films. Different phases of palladium selenide are synthesized under different conditions and the details are tabulated in Table S1 (ESI†).
The palladium selenide films formed on the glass substrate are found to be very adherent and possess metallic shine with good electronic conductivity. The electrical resistivity values are found to be 30, 50 and 175 μΩ cm for Pd17Se15, Pd7Se4 and Pd4Se, respectively. The thickness of the films ranges from few to several microns (2–7 μm) depending on the volume of the precursor complex used to cover the glass slide. The XRD patterns (Fig. S1, ESI†) of the precursor complex B11 on the glass surface show diffraction peaks at 1.56 and 3.0° that correspond to the (001) and (002) planes, respectively, and the appearance of periodic reflections is indicative of the formation of a lamellar structure. The d-spacing values obtained for the (001) and (002) planes are 56.6 and 29.3 Å that correspond to the bilayer formation of the complex from Pd(OAc)2 and DDSe similar to the metal thiolates.12 The formation of the complex is also evident from 77Se NMR where a change in the chemical shift value from 159 to 259 ppm is noted for the B11 complex as compared to pure Se. This may be attributed to a decrease in the electron density on Se due to the co-ordination of its lone pair with Pd (Fig. S2, ESI†). The UV-vis absorption spectra as a function of the molar ratios of Pd(OAc)2 and DDSe (Fig. S3, ESI†) support the conclusions based on NMR and XRD. Pd(OAc)2 and DDSe show the absorption bands at 400 and 288 nm, respectively. The absorption band obtained for Pd(OAc)2 is due to the ligand to metal charge transfer transition while the band observed for DDSe is due to the n to σ* transition (Fig. S3(a), ESI†). The DDSe absorption band undergoes a bathochromic shift of 16 nm upon addition of varying amounts of Pd(OAc)2 [Fig. S3(b) and (c), ESI†]. Apart from this observation, the disappearance of the band corresponding to Pd(OAc)2 indicates the formation of the complex B1y. It is reported that the reaction of PdCl2 with didocosyl selenide results in the formation of a complex of composition Pd[(SeR2)2Cl2].13 Similarly, in the present study, the composition of the complex B1y may be expected to be Pd[(SeR2)2(OAc)2], where the DDSe molecules bind via co-ordination bonds with the Pd center through the lone pair of electrons present on Se atoms. Similarly, in the case of the complex Bx1, the composition is expected to be the same but with excess of Pd(OAc)2. This is evident from the UV-vis spectrum of the complex wherein the characteristic peak due to Pd(OAc)2 observed at 400 nm increases with the increasing amount of Pd precursor. This is absent in the case of the complex B1y (Fig. S3(c), ESI†).
The phase identification of the as-obtained materials formed by the thermal decomposition of Bxy is carried out using XRD. As shown in Fig. S4 (ESI†), the thermolysis of the complex B11 at 250 °C results in the formation of the Pd7Se4 phase. The XRD pattern of Pd7Se4 corresponds to the orthorhombic system with lattice parameters a = 5.23, b = 6.87 and c = 6.21 Å (JCPDF 31-0939). The crystallite size determined using the Scherrer formula is ∼76 ± 5 nm. Similarly, the formation of the phase Pd4Se is observed at a high molar ratio of palladium acetate in the complex, for instance B41. The lattice parameters of the pure Pd4Se phase obtained are a = 5.232 and c = 5.674 Å with tetragonal symmetry as given in Fig. 1(a). A further increase in the mole ratio of the Se precursor in the complex results in the formation of the Pd17Se15 phase (Fig. S4, ESI†). The XRD pattern of Pd17Se15 reveals a cubic phase with the lattice parameter a = 10.06 Å (JCPDF 73-1424). The crystallite size as determined using the Scherrer formula is ∼102 ± 10 nm. The XRD patterns of the phases obtained from the complexes B21 and B31 show the presence of peaks corresponding to both Pd7Se4 and Pd4Se phases. Thus, the thermolysis of B11 and B41 yields the pure Pd7Se4 and Pd4Se phases respectively while the complexes B21 and B31 give mixed phases (Fig. S5, ESI†). In order to obtain further insight into the evolution of palladium selenides, in situ XRD patterns are recorded as a function of temperature. For instance, the formation of a pure phase of Pd4Se is observed during the course of thermolysis of the complex B41. As shown in Fig. 1(b), the appearance of the Pd4Se phase is observed at 150 °C and beyond.
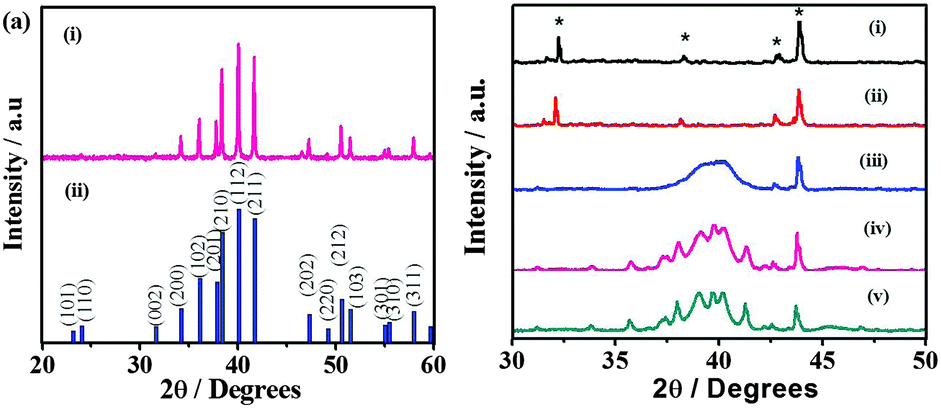 | ||
| Fig. 1 (a) X-ray diffraction patterns of (i) Pd4Se prepared by the thermal decomposition of the B41 complex at 250 °C for 1 h in the presence of N2 and (ii) the standard Pd4Se pattern (JCPDF 73-1386). (b) In situ XRD patterns of the thermal decomposition of the B41 complex at different temperatures (i) 25, (ii) 100, (iii) 150, (iv) 250 and (v) 350 °C [* indicates peaks from the sample holder]. | ||
The surface morphology of the Pd-selenides characterized using electron microscopy shows continuous interconnected structures on glass slides (Fig. S6, ESI†). The palladium to selenium ratios from EDX analysis nearly match with the corresponding phases. Fig. 2(a)–(c) shows the high resolution TEM images of the Pd17Se15, Pd7Se4 and Pd4Se phases. The respective d-spacing values calculated from the intensity line profiles are found to be 2.23, 2.64 and 3.19 Å that correspond to the (112), (311) and (113) planes of the three phases. The d-spacing values are in agreement with the high intensity reflections observed in the respective XRD patterns. The discrete spots observed in the SAED patterns indicate the crystalline nature of the materials (Fig. 2(d)–(f)).
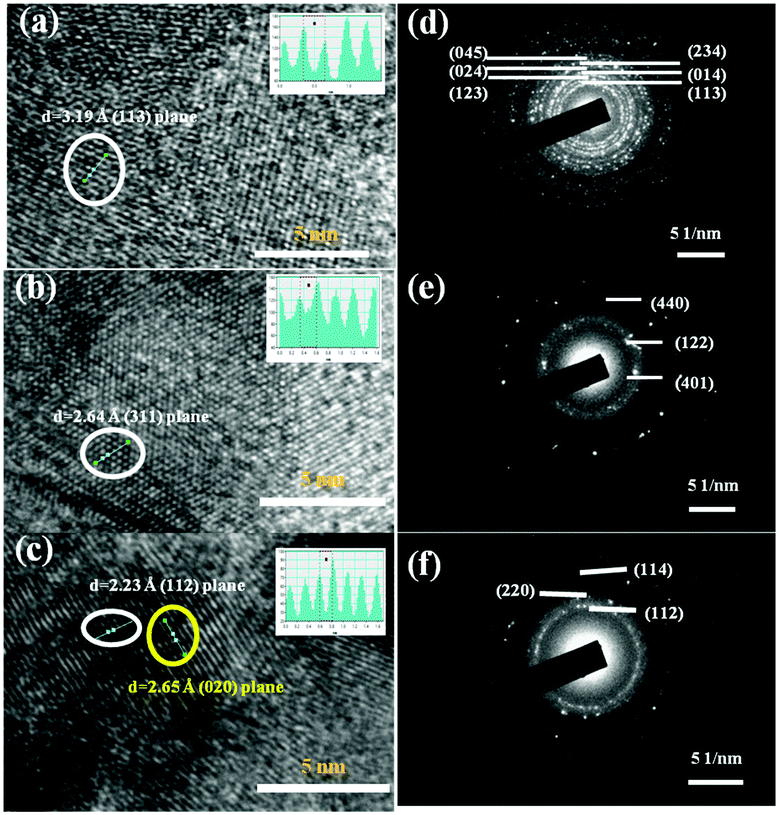 | ||
| Fig. 2 High resolution TEM images of (a) Pd17Se15, (b) Pd7Se4 and (c) Pd4Se [the inset in each image shows intensity line profile images] (d)–(f) the corresponding SAED patterns. | ||
The chemical compositions as determined by the XPS are given in Table S2 (ESI†) and are close to the expected ratios. However, oxygen is also found to be present to a certain extent in the as-prepared material. The observation of randomly present carbon is likely to be due to the decomposition of alkyl chains in the palladium organoselenolate complex. The high resolution spectra of Pd-3d and Se-3d are shown in Fig. 3. The deconvolution of the Pd-3d region displays a shift of 0.7 eV towards higher binding energies with respect to Pd(0) indicating the presence of a residual positive charge on Pd in the case of the Pd7Se4 phase. The binding energy (BE) difference between Pd 3d5/2 and 3d3/2 is found to be 5.2 eV due to the spin–orbit coupling. The region corresponding to the Pd-3p level overlaps with that of the O1s region (Fig. S20, ESI†). Once the sample is etched, the O1s peak is found to be absent indicating that the oxygen is adventitious in nature while others are retained in the same ratios (Fig. S21 and S22, ESI†). The peaks corresponding to Se-3d shift to lower BE values as compared to those of Se(0), resulting in a residual negative charge on Se as reported for many metal selenides such as CoSe, NiSe and CuSe.14 The Se-3d deconvoluted spectrum shows a spin–orbit coupling value of 0.8 eV. The XPS data for the other two phases, namely Pd17Se15 and Pd4Se, are shown in Fig. 3 and Table S2 (ESI†). As observed, when Pd content increases from Pd17Se15 to Pd4Se, the BE values of the Pd-3d peak shift to lower values. The BE values for Pd in Pd17Se15 (336.3 eV) do not exactly match with those of Pd0 (335.1 eV). The oxidation state of Pd is found to be between 0 and +2 in all three phases.
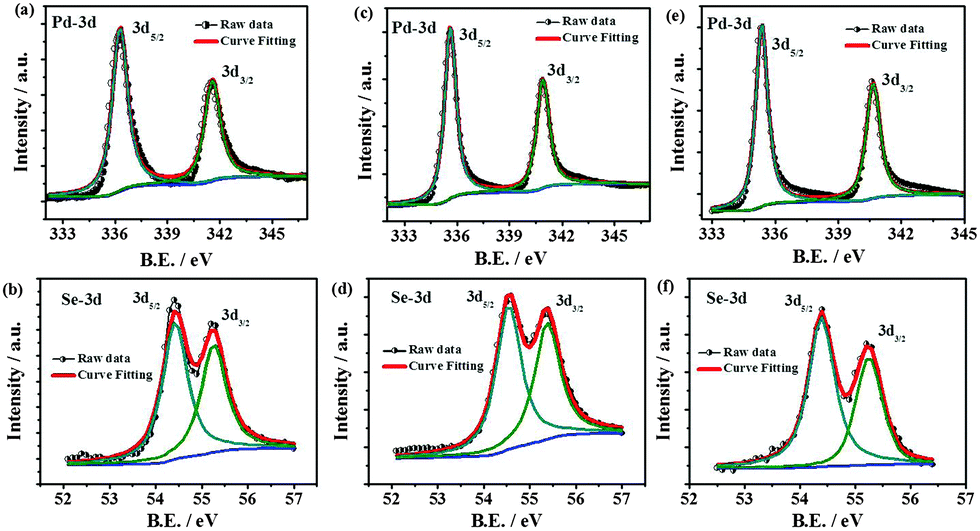 | ||
| Fig. 3 High resolution deconvoluted XPS spectra of the Pd-3d and Se-3d regions of (a) and (b) Pd17Se15, (c) and (d) Pd7Se4 and (e) and (f) Pd4Se. | ||
The palladium selenide phases prepared in the current study are highly conducting and possess work function values ranging from 4.3 to 4.7 eV. The electrical resistivity measurements indicate that these phases are metallic in nature (Fig. S8, ESI†). Hence, they can act as good electrode materials for driving redox reactions. Just to confirm the amenability of the materials for electrochemical studies, a standard redox couple involving ferrocyanide/ferricyanide [Fe(II)/Fe(III)] has been studied in a standard three electrode cell. Fig. S9(a) (ESI†) displays the cyclic voltammograms that reveal reversible peaks on the palladium selenide phases. The linear variation of peak currents with concentration of redox species is observed as well.
The electrocatalytic activity of palladium selenides towards HER has been followed using the as-obtained films on glass slides with copper wire as the contact. Polarization measurements are carried out in N2-saturated 0.5 M H2SO4 and the potentials are reported with respect to the reversible hydrogen electrode (RHE, Fig. S10, ESI†). The IR corrected linear sweep voltammograms at a scan rate of 2 mV s−1, obtained using Pd17Se15, Pd7Se4 and Pd4Se, display the onset potentials of −0.08, −0.07, −0.03 vs. RHE respectively (Fig. S11(a), ESI†) for HER. Beyond the onset potential, the cathodic currents rise rapidly. The overpotentials of −94 mV, −162 mV and −182 mV are observed to attain a current density of 10 mA cm−2, for Pd4Se, Pd7Se4 and Pd17Se15 respectively. In comparison to other well-known HER catalysts such as MoS2, MoSe2 and MoSSe,15 the palladium selenide phases require low overpotentials for hydrogen evolution. The adherence and stability of palladium selenide films towards continuous hydrogen evolution are improved considerably when Toray carbon paper (Fig. S11, ESI†) is used as the substrate. The presence of three-dimensional fibrous carbon structures with roughness along with the high surface area of Toray carbon holds the selenides strongly and high HER activities can be obtained. Toray carbon itself is inactive towards HER (Fig. S11(b), ESI†). The exchange current densities observed on Pt/C, Pd4Se, Pd7Se4 and Pd17Se15 are 0.8 × 10⁻³ A cm−2,17 2.3 × 10⁻⁴ A cm−2, 2.5 × 10⁻⁵ A cm−2 and 6.6 × 10⁻⁶ A cm−2 respectively (Fig. 4(a)). The apparent Tafel slopes are observed to be ∼50, ∼56 and ∼57 mV per decade for Pd4Se, Pd7Se4 and Pd17Se15 over 70–100 mV over potentials, respectively, whereas the measured Tafel slope for Pt/C under identical conditions is 31 mV dec−1 (Fig. 4(b)).16 Tafel slopes are used only for comparing the activities of different selenides.
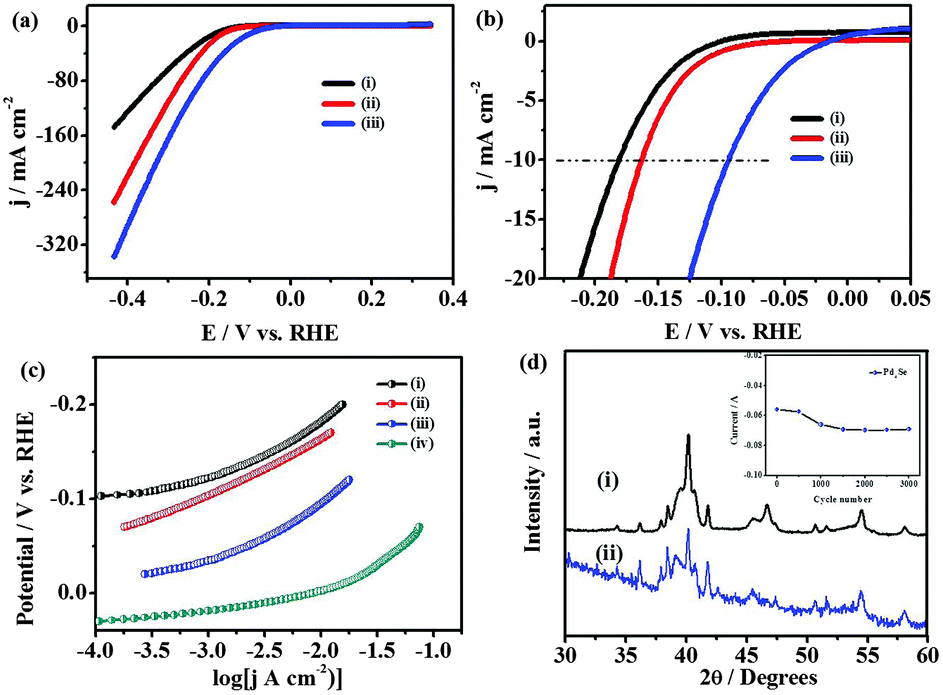 | ||
| Fig. 4 (a) IR corrected linear sweep voltammetric curves of (i) Pd17Se15, (ii) Pd7Se4 and (iii) Pd4Se towards HER and (b) the enlarged portion of the onset potentials. (c) Tafel-plots for (i) Pd17Se15, (ii) Pd7Se4, (iii) Pd4Se, and (iv) Pt for catalyst loading of 0.28 mg cm−2. The scan rate used is 2 mV s−1. (d) XRD patterns of Pd4Se before (i) and after (ii) 3000 cycles, at a scan rate of 100 mV s−1. The inset in (d) shows the stability of currents at −0.4 V as a function of cycling. | ||
Based on the Tafel slopes, it is likely that the HER mechanism probably follows Volmer–Heyrovsky steps in the case of selenides. Among the three phases, Pd4Se shows the lowest Tafel slope with the highest exchange current density. The kinetic parameters obtained for the palladium selenide phases are better than those of the other known catalysts such as MoS3 thin films (1.3 × 10⁻⁷ A cm−2), MoS2 nanoparticles (1.3–3.1 × 10⁻⁷ A cm−2), FeP nanoparticles (1.7 × 10⁻⁵ A cm−2) and Mo2C bulk (3.79 × 10⁻⁶ A cm−2).18 The turnover frequency (TOF) values for Pd4Se, Pd7Se4 and Pd17Se15 are determined to be 0.47 s−1, 0.35 s−1 and 0.2 s−1 (at 0.05 V vs. RHE) respectively, while the reported value for platinum is 0.9 s−1 (at 0 V vs. RHE). The TOF values of Pd-selenides are higher than that of Ni2P (0.015 s−1, at −100 mV vs. RHE) and MoS2 (0.02 s−1, at 0 V vs. RHE) (Table S3, ESI†).19 Fig. S12 (ESI†) shows the impedance spectra along with the equivalent circuit used to fit the data. The Rct values obtained are 86, 100 and 780 Ω for Pd4Se, Pd7Se4 and Pd17Se15 respectively. The stability of the electrode materials has been checked under different conditions and found to be very good (Fig. 4(d) and Fig. S14, S15, S19 and S21 (ESI†)). The activities of electrocatalysts also depend on the number of active sites for H-adsorption which in turn depends on the electrochemical surface area of the material. The active surface areas of the three phases are determined using underpotential deposition of copper. The electrochemical surface areas of the Pd17Se15, Pd7Se4 and Pd4Se phases are found to be 0.048, 0.72 and 1 m2 g−1 respectively (Fig. S16, ESI†). To understand and compare the activities of different phases of palladium selenides, density functional theory (DFT) calculations are carried out20,21 and the details are given in the ESI.† The availability of the d-band density of states (DOS) at the Fermi level is generally correlated with the electrocatalytic activity.22 It is found that the Pd d-band DOS are found to be higher and placed exactly above the Fermi level in the case of Pd4Se, while in the other two cases, it is not (Fig. S17 and S18, ESI†). The selenium contribution at the Fermi level is found to be very small for Pd4Se, while it becomes fairly considerable in the case of the other two phases. Additionally, the positive charge on Pd (as given in XPS data earlier) is smaller in the case of Pd4Se as compared to the other two, based on the shift in binding energy values (Table S2, ESI†). The binding energy value for Pd(0) is 335.1 eV, while the values are 335.3 eV for Pd4Se and 336.3 and 336.7 eV for the other two phases. This is in parallel to the observation based on the charge density analysis performed on the three selenides. The average charge on Pd is smaller in the case of Pd4Se (0.05) and increases when the phases are Pd7Se4 (0.12) and subsequently Pd17Se15 (0.17) (Table S5, ESI†). It should be noted that there are Pd atoms with different environment in the structures of the palladium selenides,23 and hence an average charge is given for comparison purposes. As a consequence, the oxidation state of Pd in Pd4Se is smaller than that of the other two phases. This will possibly help in the effective adsorption of protons on Pd4Se as compared to Pd7Se4 and Pd17Se15. Of course, this is true when the adsorption sites are composed only of palladium. It is likely so since palladium(0) is a known hydrogen adsorption material. Additionally, the structural analysis reveals that the palladium sites are relatively open in the case of Pd4Se and it is crowded as the composition becomes Pd7Se4 and Pd17Se15. All the above arguments lead to the fact that Pd4Se is a better electrocatalyst than the other two members studied, Pd7Se4 and Pd17Se15. Low Tafel slope and low charge transfer resistance and high exchange current density and high electrochemical surface area make Pd4Se an excellent electrocatalyst as compared to the other two phases. An important point to highlight is that the adsorption/desorption peaks associated with H atoms, before the onset of hydrogen gas evolution as observed on the pure Pt and Pd phases, are not observed in the case of palladium selenides. This requires further investigation.
In summary, three different palladium selenide phases Pd17Se15, Pd7Se4 and Pd4Se are prepared by the thermolysis of different palladium organoselenolate complexes. Among the three phases, Pd4Se shows very good electrocatalytic activity and this opens up ways of reducing the noble metal content in catalysts of interest.
Notes and references
- N. S. Lewis and D. G. Nocera, Proc. Natl. Acad. Sci. U. S. A., 2006, 103, 15729 CrossRef CAS PubMed.
- N. R. Udengaard, Prepr. Pap. - Am. Chem. Soc., Div. Fuel Chem., 2004, 49, 906 CAS.
- J. O. M. Bockris, I. A. Ammar and A. K. M. S. Huq, J. Phys. Chem., 1957, 61, 879 CrossRef CAS.
- (a) V. Ritleng, C. Sirlin and M. Pfeffer, Chem. Rev., 2002, 102, 1731 CrossRef CAS PubMed; (b) B. Lim, M. Jiang, P. H. Camargo, E. C. Cho, J. Tao, X. Lu, Y. Zhu and Y. Xia, Science, 2009, 324, 1302 CrossRef CAS PubMed; (c) A. Kudo and Y. Miseki, Chem. Soc. Rev., 2009, 38, 253 RSC.
- (a) L.-L. Long, A.-Y. Zhang, Y.-X. Huang, X. Zhanga and H.-Q. Yu, J. Mater. Chem. A, 2015, 3, 4301 RSC; (b) Q. Chen, C. Suo, S. Zhang and Y. Wang, Int. J. Photoenergy, 2013, 2013, 1 Search PubMed.
- (a) X. Jiang, B. Mayers, Y. Wang, B. Cattle and Y. Xia, Chem. Phys. Lett., 2004, 385, 472 CrossRef CAS; (b) Madhu and R. N. Singh, Int. J. Hydrogen Energy, 2011, 36, 10006 CrossRef CAS; (c) S. Geller, Acta Crystallogr., 1962, 15, 713 CrossRef CAS; (d) M. Afzaal, M. A. Malik and P. O'Brien, J. Mater. Chem., 2010, 20, 4031 RSC.
- P. L. Musetha, N. Revaprasadu, G. A. Kolawole, R. V. S. R. Pullabhotla, K. Ramasamy and P. O'Brien, Thin Solid Films, 2010, 519, 197 CrossRef CAS.
- L. B. Kumbhare, V. K. Jain, P. P. Phadnis and M. Nethaji, J. Organomet. Chem., 2007, 692, 1546 CrossRef CAS.
- (a) H. Joshi, K. N. Sharma, A. K. Sharma, O. Prakash and A. K. Singh, Chem. Commun., 2013, 49, 7483 RSC; (b) K. Suresh, S. N. Karthick and S. Sampath, J. Mater. Chem. A, 2015, 3, 17144 RSC.
- H. R. Naren, A. Tamizhavel and S. Ramakrishan, J. Phys.: Conf. Ser., 2011, 273, 012074 CrossRef.
- J. Muller and A. Terfort, Inorg. Chim. Acta, 2006, 359, 4821 CrossRef.
- N. S. John, G. U. Kulkarni, A. Datta, S. K. Pati, F. Komori, G. Kavitha, C. Narayana and M. K. Sanyal, J. Phys. Chem. C, 2007, 111, 1868 CAS.
- G. K. Rao, A. Kumar, B. Kumar and A. K. Singh, Dalton Trans., 2012, 41, 4306 RSC.
- (a) A. B. Volynski, A. Yu. Stakheev, N. S. Telegina, V. G. Senin, L. M. Kustov and R. Wennrich, Spectrochim. Acta, Part B, 2001, 56, 1387 CrossRef; (b) V. V. Singh, U. Kumar, S. N. Tripathi and A. K. Singh, Dalton Trans., 2014, 43, 12555 RSC; (c) J. Zhang, Y. Xu and B. Zhang, Chem. Commun., 2014, 50, 13451 RSC.
- (a) X. J. Bian, J. Zhu, L. Liao, M. D. Scanlon, P. Y. Ge, C. Ji, H. H. Girault and B. H. Liu, Electrochem. Commun., 2012, 22, 128 CrossRef CAS; (b) V. Kiran, D. Mukherjee, R. N. Jenjeti and S. Sampath, Nanoscale, 2014, 6, 12856 RSC.
- Y. Li, H. Wang, L. Xie, Y. Liang, G. Hong and H. Dai, J. Am. Chem. Soc., 2011, 133, 7296 CrossRef CAS PubMed.
- (a) Y. Takasu, Y. Fujii, K. Yasuda, Y. Iwanaga and Y. Matsuda, Electrochim. Acta, 1989, 34, 453 CrossRef CAS; (b) T. F. Jaramillo, K. P. Jorgensen, J. Bonde, J. H. Nielsen, S. Horch and I. Chorkendorff, Science, 2007, 317, 100 CrossRef CAS PubMed.
- (a) D. Merki, S. Fierro, H. Vrubel and X. Hu, Chem. Sci., 2011, 2, 1262 RSC; (b) J. D. Benck, Z. Chen, L. Y. Kuritzky, A. J. Forman and T. F. Jaramillo, ACS Catal., 2012, 2, 1916 CrossRef CAS.
- (a) Z. Zhang, B. Lu, J. Hao, W. Yang and J. Tang, Chem. Commun., 2014, 50, 11554 RSC; (b) C. He and J. Tao, Chem. Commun., 2015, 51, 8323 RSC; (c) E. J. Popczun, J. R. McKone, C. G. Read, A. J. Biacchi, A. M. Wiltrout, N. S. Lewis and R. E. Schaak, J. Am. Chem. Soc., 2013, 135, 9267 CrossRef CAS PubMed.
- G. Kresse and J. Furthmüller, Phys. Rev. B: Condens. Matter Mater. Phys., 1996, 54, 11169 CrossRef CAS.
- G. Kresse and D. Joubert, Phys. Rev. B: Condens. Matter Mater. Phys., 1999, 59, 1758 CrossRef CAS.
- A. Hamidani and B. Bennecer, Comput. Mater. Sci., 2010, 48, 115 CrossRef CAS.
- (a) T. Matkovic and K. Schubert, J. Less-Common Met., 1978, 59, 57 CrossRef; (b) F. Gronvold and E. Rost, Acta Crystallogr., 1962, 15, 11 CrossRef.
Footnote |
| † Electronic supplementary information (ESI) available: Detailed experimental procedures for the preparation of different palladium selenides, NMR, UV-vis and XPS quantification, SEM images, and XRD patterns before and after stability. See DOI: 10.1039/c5cc06730h |
| This journal is © The Royal Society of Chemistry 2016 |