DOI:
10.1039/C5AY02313K
(Paper)
Anal. Methods, 2016,
8, 189-196
Separation and quantitation of isomeric caffeoylquinic acids in honeysuckle products by low-pH microemulsion electrokinetic chromatography using tartrate as a chiral selector
Received
31st August 2015
, Accepted 13th November 2015
First published on 16th November 2015
Abstract
An improved microemulsion electrokinetic chromatography (MEEKC) method for the simultaneous determination of seven caffeoylquinic acids (CQAs) in honeysuckle-related products was reported. Multiple additives significantly affected the separation of CQA isomers, but adding 20 mmol L−1 chiral potassium sodium tartrate most significantly improved the separation and enabled short analysis time (within 22 min). The results indicated that tartrate could be an alternative additive for the rapid separation and quantification of CQA isomers. A low-pH phosphate buffer (pH 2.25) was also used to maintain the stability of CQA and suppress electroosmotic flow. Three monoCQA and four diCQA achieved good baseline separation under the optimal conditions. The limits of detection (S/N = 3) and limits of quantitation (S/N = 10) ranged within 2.0–4.6 and 6.8–15.4 μg mL−1, respectively. Validation showed that this simple MEEKC had feasible accuracy and precision. The developed method also successfully quantified seven CQA isomers in 13 solid (tablet, capsule, and granula) and liquid (injection and oral liquid) pharmaceutical preparations of honeysuckle.
1. Introduction
Honeysuckle, the flower of Lonicera japonica Thunb., is widely applied in traditional Chinese medicine for the treatment of arthritis, diabetes mellitus, enteritis, and fever.1,2 As the main active ingredients in honeysuckle, caffeoylquinic acids (CQAs) show numerous pharmacological activities, such as antioxidant, antiviral, antibacterial, and anti-inflammatory capacity, as well as the ability to reduce the risk of cardiovascular disease, type-2 diabetes, and Alzheimer's disease.3,4 For most honeysuckle products, the content of chlorogenic acid (5-O-caffeoylquinic acid) is usually used as the standard for quality control and evaluation. Other CQAs are often neglected because of the difficulty in separation. With the development of modern separation and identification techniques, the widely accepted belief is that quality cannot be measured by the mono-content. These isomers may have different pharmacological effects, and thus it is necessary to quantify each component in relative products separately.
Most reported methods for determining CQAs mainly use HPLC with DAD/MS/UV-vis detectors. However, quantifying CQAs is a challenging task even with access to modern techniques because of problems of great similarity among spectra and the common co-elution of these compounds. Multi-CQA isomers in honeysuckle or its products have been quantified but with long analysis times (e.g., within 80 min).5,6 Some improved methods have separated and quantified CQA isomers within 30 min. However, they fail to obtain satisfactory resolution, and only a few isomers are simultaneously measured.7,8 Given these examples, we attempt to establish a rapid and effective method for accurately determining CQAs. Compared with normal HPLC, CE is a rapid and powerful analytical tool that can separate microvolume samples with high performance and avoid excessive solvent consumption, especially for some difficult-to-separate compounds, such as positional, structural isomers and enantiomers.9,10 Many additives including organic modifiers, cyclodextrins, ionic liquids, and carbon nanotubes are added to CE media to improve separation.11 As selectors, tartrate derivatives are often used in chiral CE separation.12–15 A few studies on microemulsion electrokinetic chromatography (MEEKC) with tartrate addition have also been reported.16–18 Thus, tartrate facilitating CQA separation is worth considering. MEEKC is a relatively new mode of CE and provides a wide range of applications.19 MEEKC separation is a combination of the electrophoretic mechanism and chromatographic partitioning with the microemulsion droplets, like MEKC.20 It is effective in analyzing both charged and neutral substances. MEEKC has been found to be superior to MEKC in separation efficiency, probably due to the improvement in mass transfer between the microemulsion droplet and the aqueous phase, mediated by the co-surfactant. Moreover, MEEKC potentially offers greater separation capability because of the larger controllable separation window.21 In MEEKC, electroosmotic flow (EOF) is usually encouraged as an important driving force, but some studies report that separation is significantly improved under suppressed EOF obtained by low pH or adding divalent cations.22,23 Considering the stability of CQAs, a pH-suppressed MEEKC is more favored.
To our knowledge, CE has been widely applied to the chlorogenic acid analysis,24,25 but no publications related to the determination of CQA isomers by MEEKC exist. In the current work, three monoCQA and four diCQA isomers (their structures are shown in Fig. 1) were first determined by MEEKC. The additive type and concentration were investigated to obtain complete separation. The optimization of pH was also performed to suppress EOF and maintain analyte stability. Some other influencing factors on separation characteristics were further examined to determine the optimal conditions. Finally, thirteen honeysuckle pharmaceutical products (five dosage forms) were analyzed by this developed MEEKC method and the results were validated by HPLC. The present study introduced, for the first time, CE technology to simultaneously separate and quantify multiple CQA isomers. It is very significant for the quality control and evaluation of CQA-related products.
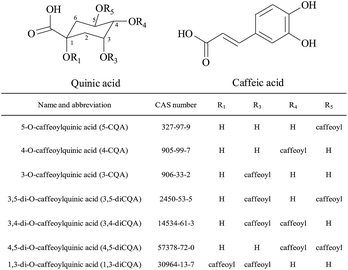 |
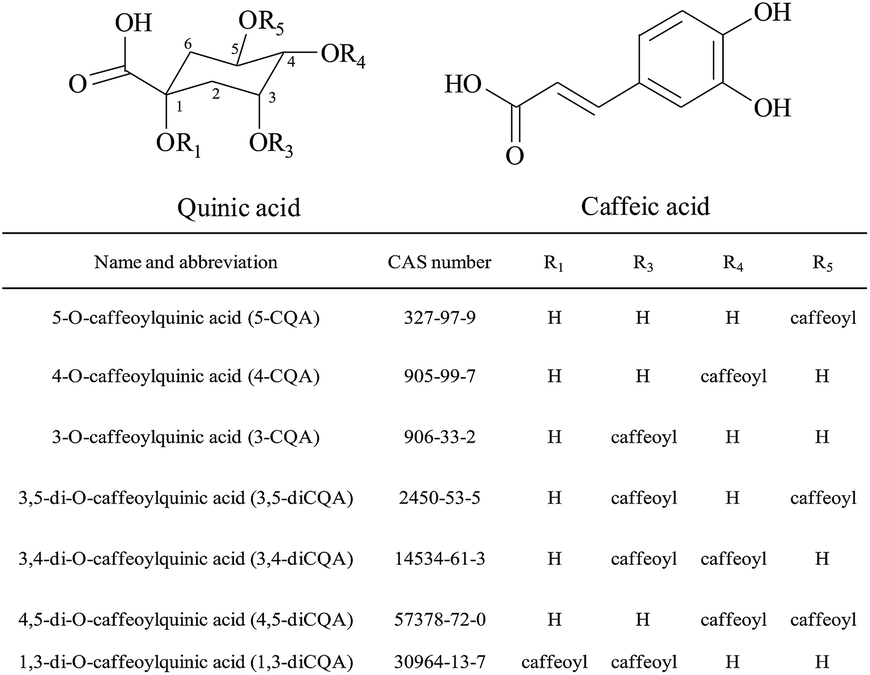
| | Fig. 1 Molecular structures of seven CQAs in this study. | |
2. Experimental
2.1. Chemicals and reagents
The standards of 5-CQA (99.4%), 4-CQA (98.6%), 3-CQA (99.5%), 3,5-diCQA (99.2%), 3,4-diCQA (98.5%), 4,5-diCQA (98.4%), and 1,3-diCQA (99.0%) were purchased from Must Biological Technology (Chengdu, China). Sodium borate, potassium sodium tartrate (PST), and SDS were provided by Sigma (MO, USA). β-Cyclodextrin (β-CD) and sodium deoxycholate (SDC) were purchased from J&K Chemicals (Beijing, China). Other reagents and chemicals were of analytical grade and obtained from Changzheng Chemicals (Chengdu, China). All commercial samples of medicinal honeysuckle preparations were purchased from local chemist shops.
2.2. Apparatus and procedures
The stability of CQAs was investigated using a TU-1901 UV-vis spectrophotometer (Persee, Beijing, China), recording from 190 to 400 nm at 25 °C.
HPLC validations were carried out on an Agilent 1200 Series LC system (Agilent, California, USA) equipped with a quaternary pump and a DAD detector. A Kromasil C18 column (5 μm, 250 mm × 4.6 mm i.d.) maintained at 30 °C was used for chromatographic separation. The mobile phases consisted of 0.1% phosphoric acid aqueous solution and acetonitrile. The flow rate was 1.0 mL min−1 and DAD detection was performed at 327 nm. The injection volume was kept at constant 10 μL. The gradient program was used as follows: 0–25 min from 5 to 10% of acetonitrile, 25–45 min 10–30% of acetonitrile, and 45–50 min 30–5% of acetonitrile.
MEEKC separations were conducted on a Beckman Coulter P/ACE MDQ CE system (Beckman Coulter Instrument, Fullerton, USA) equipped with a PDA detector. A computer with 32 Karat software was used for instrumental control and data analysis. Electrophoresis was performed using a 75 μm i.d. × 50.2 cm total length (40 cm effective length) uncoated fused-silica capillary (Yongnian Factory, Hebei, China). The wavelength was set at 328 nm. A new capillary was sequentially conditioned by flushing with methanol for 10 min, 0.5 mol L−1 HCl for 10 min, 0.5 mol L−1 NaOH for 10 min, water for 15 min, and then the microemulsion for 15 min. The capillary was rinsed with 0.5 mol L−1 NaOH for 1 min, water for 3 min, and running buffer for 5 min between consecutive injections. After analysis each day, the capillary was rinsed with 0.5 mol L−1 NaOH for 5 min and water for 8 min and then air was blown at 20 psi for 5 min.
2.3. Preparation of running buffer and sample solution
Microemulsion buffer for MEEKC was prepared with 150 mmol L−1 SDS, 1.0% (v/v) n-heptane, 6.0% (v/v) 1-butanol, 20 mmol L−1 PST, and 50 mmol L−1 phosphate in a 25 mL volumetric flask. The mixture was then sonicated for 30 min until it became homogeneous. The pH of running buffer was adjusted to the desired value using 1.0 mmol L−1 HCl or 1.0 mmol L−1 NaOH solutions. The running buffer was filtered through a 0.45 μm filter before analysis. Other microemulsion buffers were prepared based on the abovementioned procedure.
Standard stock solutions of 1.0 mg mL−1 CQAs were prepared using 50% methanol as the solvent. All standard solutions were stored at 4 °C. Liquid preparations were diluted with purified water and analyzed through a 0.45 μm filter. Solid preparations were ground to powder and prepared approximately 80.0 mg mL−1 solution with 50% methanol. The sample solutions were sonicated for 30 min, filtered using a 0.45 μm filter, and then analyzed.
3. Results and discussion
3.1. Stability of CQAs in acidic and basic microemulsion
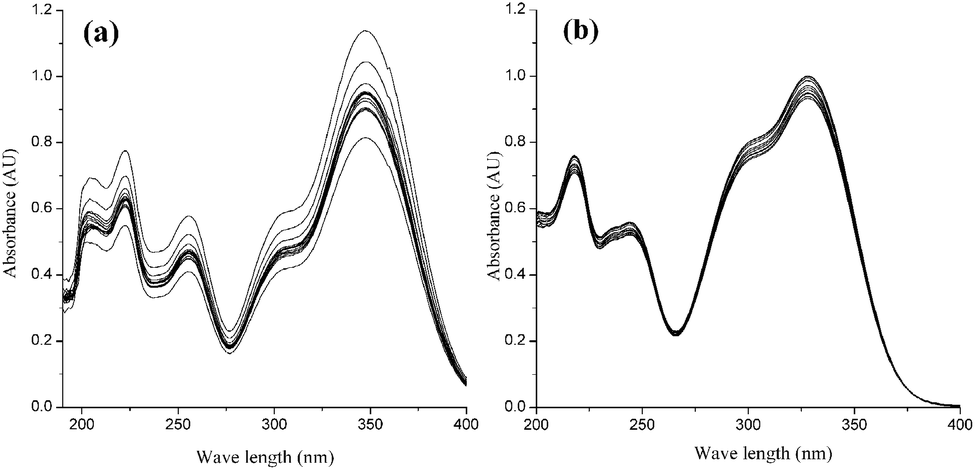
The coexistence of the ester bond, double bond, and polyphenol structure in CQA molecules leads to the instability of these compounds. The stability of CQA isomers is remarkably influenced by pH, and 5-CQA usually has a higher stability when it is analyzed under acidic conditions.26 The stability of the standard CQA mixture in acidic and basic buffer was investigated by measuring UV-visible absorption for an hour. The absorbance of CQAs in basic buffer (Fig. 2a) decreased from 1.14 to 0.82 (ca. 28.1% change), however, the absorbance of CQAs in acidic buffer (Fig. 2b) decreased from 1.02 to 0.93 (only ca. 8.8% change). This result indicates that CQA isomers in basic buffer are more unstable, consistent with easier hydrolysis at higher pH,27 leading to a change in UV-visible absorption. An obvious bathochromic shift also occurs in basic buffer (λmax = 347 nm). The maximum wavelength in acidic buffer (λmax = 327 nm) is consistent with that in a previous study.6 Therefore, the MEEKC analysis of CQAs was performed in an acidic buffer in this study.
 |
| | Fig. 2 UV spectra of the CQA mixture in basic (a) and acidic (b) buffers. The microemulsion buffer contained 80 mmol L−1 SDS, 1.0% v/v n-heptane, 7.5% v/v 1-butanol, and 10 mmol L−1 borate at pH 9.25 for (a) and 50 mmol L−1 phosphate at pH 2.25 for (b). | |
3.2. Effect of chiral selectors on resolution and migration time
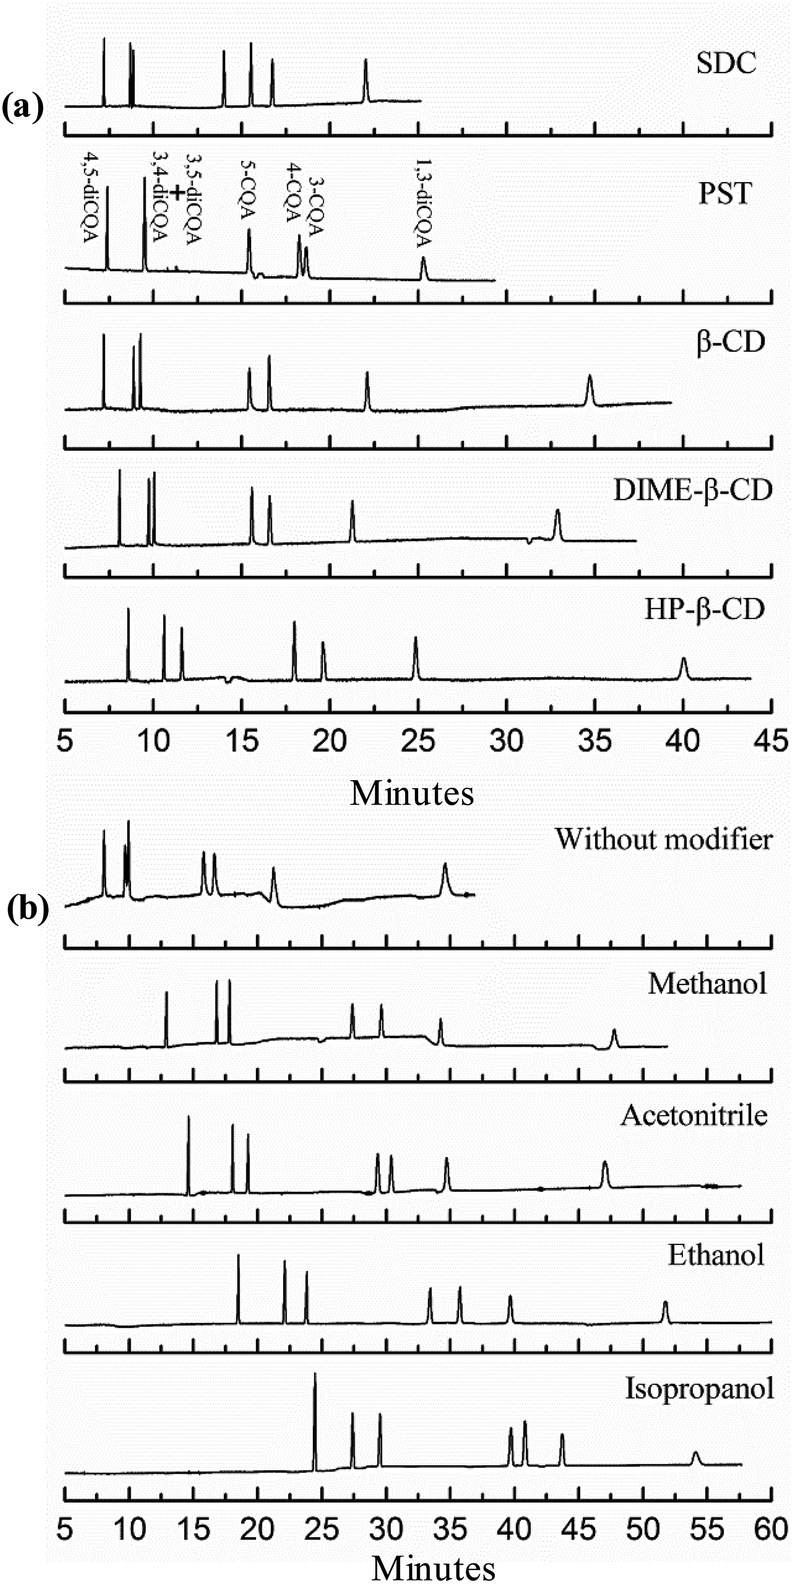
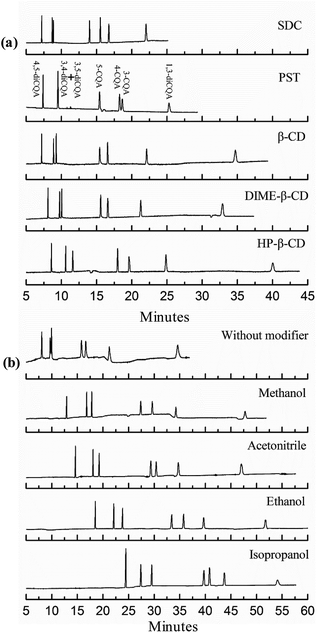
The highly similar chemical structures of CQA isomers render difficult complete separation in a short time without any extra additive. MEEKC is also widely used in chiral separation as an effective analytical technology.11 With a view of multiple chiral carbon atoms in the CQA molecule, investigating the effects of chiral reagents on separation is worthwhile. In our work, each of 10 mmol L−1 PST, SDC, β-CD, HP-β-CD, and DIME-β-CD were respectively added to the microemulsion to improve separation. Resolution (R) is a critical parameter in evaluating the separation performance of any chromatographic process. R can be calculated using the obtained electropherograms: R = 2(t2 − t1)/(w1 + w2), where t is the migration time of the analyte and w is the peak width at the baseline. R is usually required to be >1.5 for complete baseline separation.
The buffer of tartaric acid–sodium tartrate in previous reports was successfully used to separate and quantify three nitroaniline positional isomers.28 Significantly shorter migration times are observed in the present study when PST was added to the microemulsion, as shown in Fig. 3a. This finding may be due to the charge-to-mass ratio. The small-molecule chiral compound of tartrate fully ionizes in the microemulsion, and the negatively charged tartrate anions increase the charge-to-mass ratio of microemulsion droplets combined with PST, thereby enabling the analyte to migrate faster.
 |
| | Fig. 3 Effects of types of chiral reagents (a) and organic solvents (b) on the separation of CQA isomers. The microemulsions contained 150 mmol L−1 SDS, 1.0% v/v n-heptane, 8.0% v/v 1-butanol, and 10 mmol L−1 chiral reagent for (a) and 15% v/v organic solvent for (b), and 50 mmol L−1 phosphate buffer at pH 2.25. | |
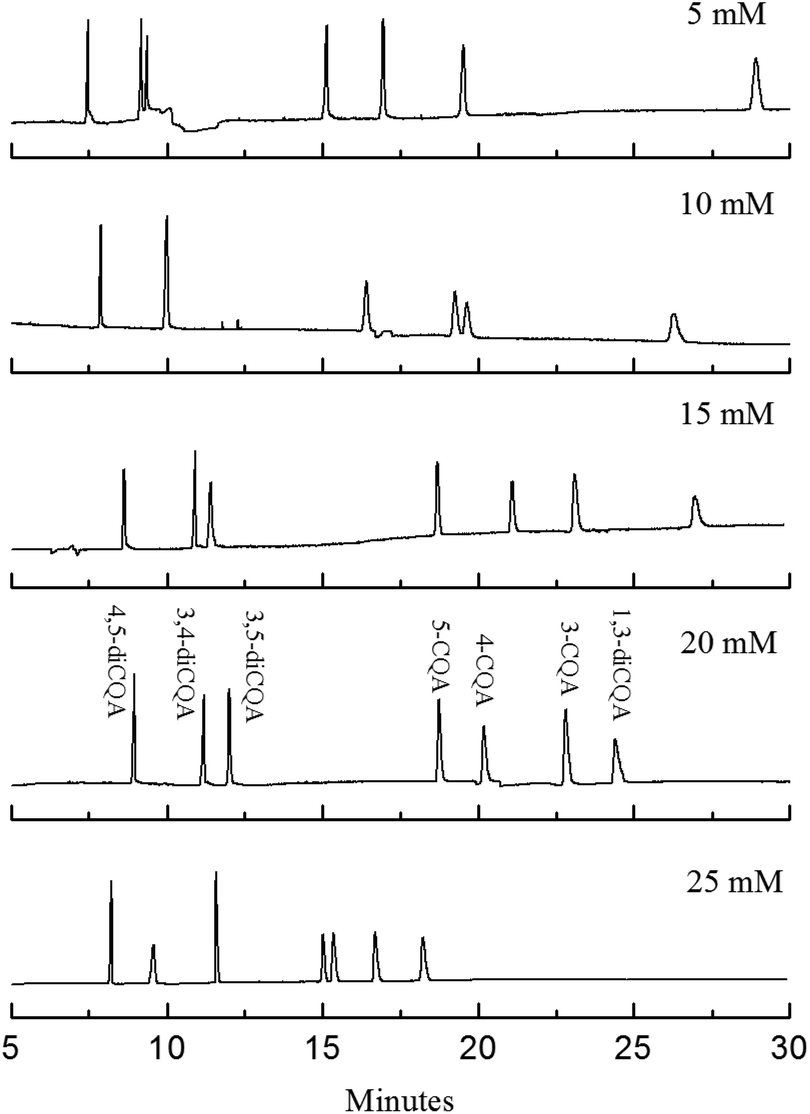
Although the analysis time was controlled to be within 25 min, the analyte resolution is unsatisfactory. The resolution of 4-CQA and 3-CQA is 0.92, and no isolation of the isomers of 3,4-diCQA and 3,5-diCQA is found when 10 mmol L−1 PST was added (shown in Fig. 3a and 4). Therefore, further investigations are necessary. Effects of PST concentrations (5 mmol L−1 to 25 mmol L−1) on separation were detected in this study. Fig. 4 shows that PST concentrations noticeably influence the seven CQA isomers. The analysis time shortens with increasing PST concentration. The shortest time (within 20 min) is obtained at high PST content (25 mmol L−1). However, the resolution of 5-CQA and 4-CQA is 1.25, which may lead to inaccurate quantification. R values significantly change when PST with different concentrations was added. R3,5-diCQA/3,4-diCQA increases from zero to 3.72, R5-CQA/4-CQA decreases from 3.84 to 1.25, R4-CQA/3-CQA varies from 0.92 to 4.03, and R3-CQA/1,3-diCQA decreases from 13.05 to 3.11 (data not shown). This result indicates that PST has varied effects on different types of compounds. The resolution of diCQA isomers 3,4-diCQA and 3,5-diCQA is improved, but the separation of monoCQA 5-CQA and 4-CQA is gradually inhibited. Effects of PST on separation are related to the structural characteristics of analytes. Based on the configuration of the chiral carbon atom, 3,5-diCQA, 3,4-diCQA, 4,5-diCQA, 5-CQA, 4-CQA, 3-CQA, and 1,3-diCQA are (3R,5R)-, (1S,3R,4R,5R)-, (1R,3R,4S,5R)-, (1S,3R,4R,5R)-, (3R,5R)-, (1R,3R,4S,5R)-, and (1R,3R,4S,5R)-, respectively. Previous reports have indicated that tartrate has superior recognition performance as the chiral selector in MEEKC.16,17 Thus, the difference in R type of chiral carbon probably influences separation when PST is added. The mechanism of effects of chiral carbon type on separation should be further studied.
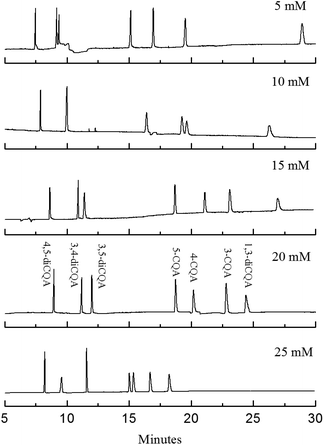 |
| | Fig. 4 Electropherograms of the standard solutions in microemulsions with different PST concentrations. The microemulsion buffer contained 150 mmol L−1 SDS, 1.0% v/v n-heptane, 8.0% v/v 1-butanol, 5 mmol L−1 to 25 mmol L−1 PST, and 50 mmol L−1 phosphate buffer at pH 2.25. | |
As commonly used chiral reagents, three β-CDs were also investigated (see Fig. 3a). Resolution could be acceptable, but the migration time increases accordingly because neutral and large cyclodextrin molecules result in a decreased charge-to-mass ratio. The use of another chiral surfactant, SDC (5 mmol L−1 to 25 mmol L−1), was attempted in the separation. Although separation could be finished in a short time, peak loss occurs when the SDC concentration reaches 15 mmol L−1. Peak loss is more likely to happen with increasing the SDC content. The addition of bile surfactant increases the hydrophobicity of a microemulsion droplet and decreases its binding with CQA molecules; thus, analytes are more distributed into the aqueous phase and migrate slowly with EOF. In our experiment, only three peaks were observed in 60 min when the added SDC was maintained at 15 mmol L−1 and there was no peak when the SDC concentration exceeded 15 mmol L−1. So the SDC was eliminated finally. Four types of organic solvents were also investigated in this study (Fig. 3b). The best result is obtained when 15% ethanol was added. However, as shown in Fig. 3b, the analysis time is long (almost an hour). Organic solvents increase the viscosity and decrease the zeta potential, thereby decreasing the velocity of microemulsion droplet migration.29 Based on the resolution and migration time, the 20 mmol L−1 PST, as a chiral additive, is chosen to improve the separation of CQA isomers.
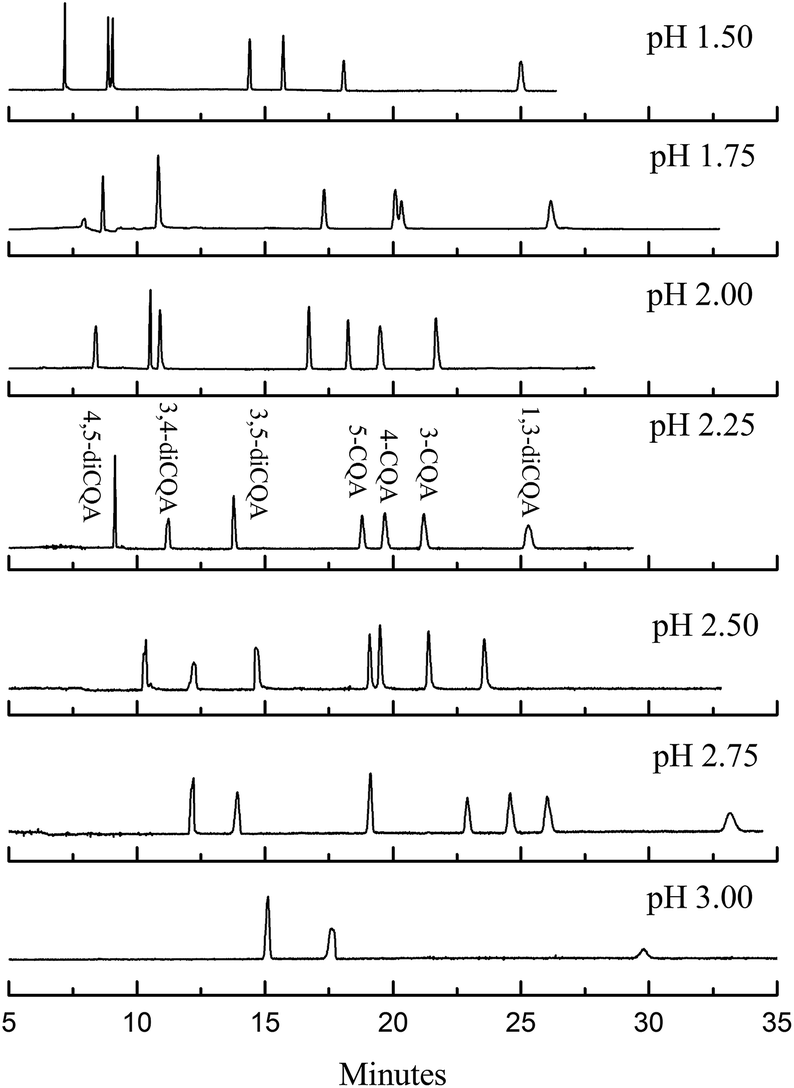
3.3. Effect of buffer pH on EOF and resolution
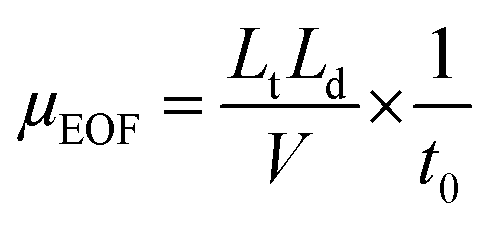
As an important driving force, EOF is generally encouraged in most CE analyses. Many previous MEEKC separations have been conducted using high EOF, whereas the present work involved MEEKC using suppressed EOF. As previously mentioned, the use of divalent cations and low pH are two common methods to suppress EOF. Given the stability of CQA isomers, pH-suppressed EOF was applied in the MEEKC in this study. The mobility of EOF (μEOF) is calculated as follows:11| |  | (1) |
where Lt is the total length of the capillary, Ld is the effective length of the capillary to the detection window, and V is the applied voltage. Dimethyl sulfoxide can be chosen as the EOF marker to obtain the migration time of EOF (t0).30,31 The μEOF values at different organic solvents and chiral reagents are listed in Table 1. Only the μEOF values of microemulsion with 15% methanol and 10 mM PST addition are obtained in 160 min. Compared with the microemulsion without modifier, the decreased EOF may be caused by the suppression effect of alkali metal ions from PST;32 and it improves the isomer separation according to Hu's study.18 It is noted that the EOF level in our study is far below than that of many conventional electrophoresis techniques, in which μEOF is usually at 10−4 cm2 V−1 s−1 (t0 within 10 min). The reason is that the EOF level highly depends on electrolyte pH because the zeta potential is largely governed by the ionization of acidic silanols (Si–OH) on the capillary wall.29 Below pH 3, the ionization is small, and the EOF rate is therefore not significant. Fully ionized Si–OH groups appear above pH 7 and EOF is strong. Table 1 also lists the μEOF of microemulsions with different buffer pHs. The EOF decreased notably below pH 3.0. In addition, buffer pH also affects the ionization efficiency of analytes and the added tartrate. An inverse voltage should be favoured throughout the entire separating procedure because of EOF suppression. Fig. 5 shows that separation could be improved by changing buffer pH from 1.50 to 3.00. The increase in pH improves resolution, especially for 3,4-diCQA and 3,5-diCQA (R3,5-diCQA/3,4-diCQA from 0.54 to 10.22) but correspondingly extends the migration time. In fact, the EOF is an obstacle for analyte migration in our study because of the opposite migration direction. Suppressed EOF improves analyte velocities and thus shortens the analysis time. This is consistent with the μEOF data in Table 1. The shortest analysis time (within 22 min) is obtained when pH is controlled at 2.00, but R3,5-diCQA/3,4-diCQA (1.18) is undesirable. Only three peaks could be observed within 35 min at pH 3.00. Apparently, pH 2.25 should be chosen as EOF modification in considering resolution and analytical time.
Table 1 Mobilities of EOF under different conditions
| Impact factors |
t
0 (min) |
μ
EOF (×10−5 cm2 V−1 s−1) |
|
Organic solvents
|
| Without modifier |
35.12 |
4.77 |
| Methanol |
144.08 |
1.16 |
| Acetonitrile |
>160 |
<1.05 |
| Ethanol |
>160 |
<1.05 |
| Isopropanol |
>160 |
<1.05 |
![[thin space (1/6-em)]](https://www.rsc.org/images/entities/char_2009.gif) |
|
Chiral reagents
|
| SDC |
>160 |
<1.05 |
| PST |
91.25 |
1.83 |
| β-CD |
>160 |
<1.05 |
| DIME-β-CD |
>160 |
<1.05 |
| HP-β-CD |
>160 |
<1.05 |
|
|
Buffer pH
|
| pH 1.5 |
>180 |
<0.93 |
| pH 2.0 |
134.11 |
1.25 |
| pH 2.5 |
81.54 |
2.05 |
| pH 3.0 |
25.30 |
6.61 |
| pH 3.5 |
19.68 |
8.50 |
| pH 4.0 |
13.46 |
12.43 |
| pH 5.0 |
11.54 |
14.50 |
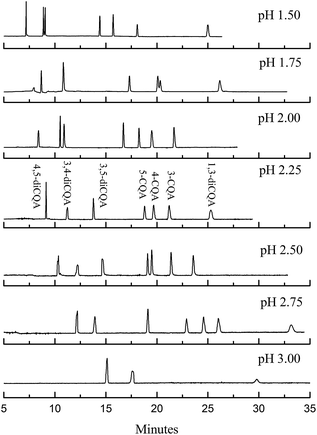 |
| | Fig. 5 Electropherograms of the standard solution in microemulsions with different pH values. The microemulsion buffer contained 150 mmol L−1 SDS, 1.0% v/v n-heptane, 8.0% v/v 1-butanol, 20 mmol L−1 PST, and 50 mmol L−1 phosphate buffer at pH 1.75 to 3.00. | |
3.4. Investigation of other MEEKC conditions
Effects of microemulsion compositions (SDS, n-heptane, and 1-butanol concentration) on the CQA separation were also investigated. Other MEEKC conditions such as injection time, cartridge temperature, and separation voltage were also optimized. The results show that the optimal MEEKC conditions are as follows: 150 mmol L−1 SDS as the surfactant, 1.0% v/v n-heptane as the oil phase, 6.0% v/v 1-butanol as the co-surfactant, 20 mmol L−1 PST as the chiral additive, and 50 mmol L−1 phosphate buffer with pH 2.25; 0.5 psi injection for 10 s; cartridge temperature of 20 °C; and voltage of −20 kV.
3.5. Method validation
Analytical characteristics including linearity, LOD, LOQ, precision, and accuracy were calculated under the optimum conditions to further examine the performance of the developed method. Approximately 5 μg mL−1 to 800 μg mL−1 of CQA isomers with each of seven different concentrations were analyzed in triplicate runs. LOD and LOQ were calculated by using S/N = 3 and S/N = 10, respectively. Calibration curves were established using the ratio of peak area of standard to its concentration (Table 2). The correlation coefficient (r2) values indicate a highly linear relationship between the peak area and individual analyte concentration. A standard solution was used to determine the precision (intraday and interday) of the migration time and the peak area under the optimal conditions. As observed in the intraday experiment, the relative standard deviation (RSD) of the migration time and peak area ranges from 0.65% to 1.01% and from 0.64% to 0.92%, respectively. Interday RSD values range from 1.05% to 1.77% and 1.07% to 2.58% (Table 3). The migration time and peak area vary from run to run, but results are still acceptable. Recovery experiments were conducted by spiking accurate amounts of the seven analytes onto the real samples. Each MEEKC analysis was repeated five times. Average recoveries of seven CQA isomers range from 92.85% to 103.42% (data not shown). The abovementioned results indicate that the developed method is accurate and reliable for separating and quantifying CQAs in real samples.
Table 2 Calibration curves, LODs, and LOQsa
| Analyte |
Concentration (μg mL−1) |
Linear equation |
r
2
|
LOD (μg mL−1) |
LOQ (μg mL−1) |
|
Average values were obtained from triplicate runs.
|
| 5-CQA |
5–800 |
y = 0.9381x − 3.0786 |
0.9998 |
3.1 |
10.4 |
| 4-CQA |
10–550 |
y = 0.9214x − 13.982 |
0.9994 |
4.5 |
14.8 |
| 3-CQA |
5–600 |
y = 1.1624x − 13.098 |
0.9995 |
3.8 |
12.6 |
| 3,5-DiCQA |
10–750 |
y = 0.7102x + 10.968 |
0.9992 |
3.0 |
9.9 |
| 3,4-DiCQA |
10–800 |
y = 0.8100x − 11.694 |
0.9989 |
2.7 |
8.9 |
| 4,5-DiCQA |
10–800 |
y = 0.9727x − 9.6061 |
0.9993 |
2.0 |
6.8 |
| 1,3-DiCQA |
5–400 |
y = 1.2385x − 17.886 |
0.9994 |
4.6 |
15.4 |
Table 3 Intraday and interday precision valuesa
| Analyte |
Concentration (μg mL−1) |
Migration time (min) |
Peak area (AU min) |
| Intraday |
Interday |
Intraday |
Interday |
|
Values of % RSD are in parentheses. The intraday and interday experiment was conducted in five runs and three consecutive days, respectively.
|
| 4,5-DiCQA |
50 |
7.38 (0.65) |
7.54 (1.17) |
42.082 (0.82) |
42.031 (1.58) |
| 3,4-DiCQA |
50 |
8.53 (0.83) |
8.61 (1.24) |
25.207 (0.68) |
26.735 (1.90) |
| 3,5-DiCQA |
50 |
12.06 (0.79) |
12.09 (1.32) |
42.894 (0.64) |
42.990 (2.11) |
| 5-CQA |
100 |
15.96 (0.87) |
16.10 (1.05) |
89.763 (0.92) |
88.905 (2.58) |
| 4-CQA |
100 |
17.11 (0.96) |
18.07 (1.28) |
69.884 (0.74) |
69.753 (1.53) |
| 3-CQA |
200 |
19.24 (1.01) |
19.58 (1.77) |
209.61 (0.84) |
209.52 (1.93) |
| 1,3-DiCQA |
200 |
21.10 (0.94) |
22.06 (1.68) |
229.04 (0.79) |
228.95 (1.07) |
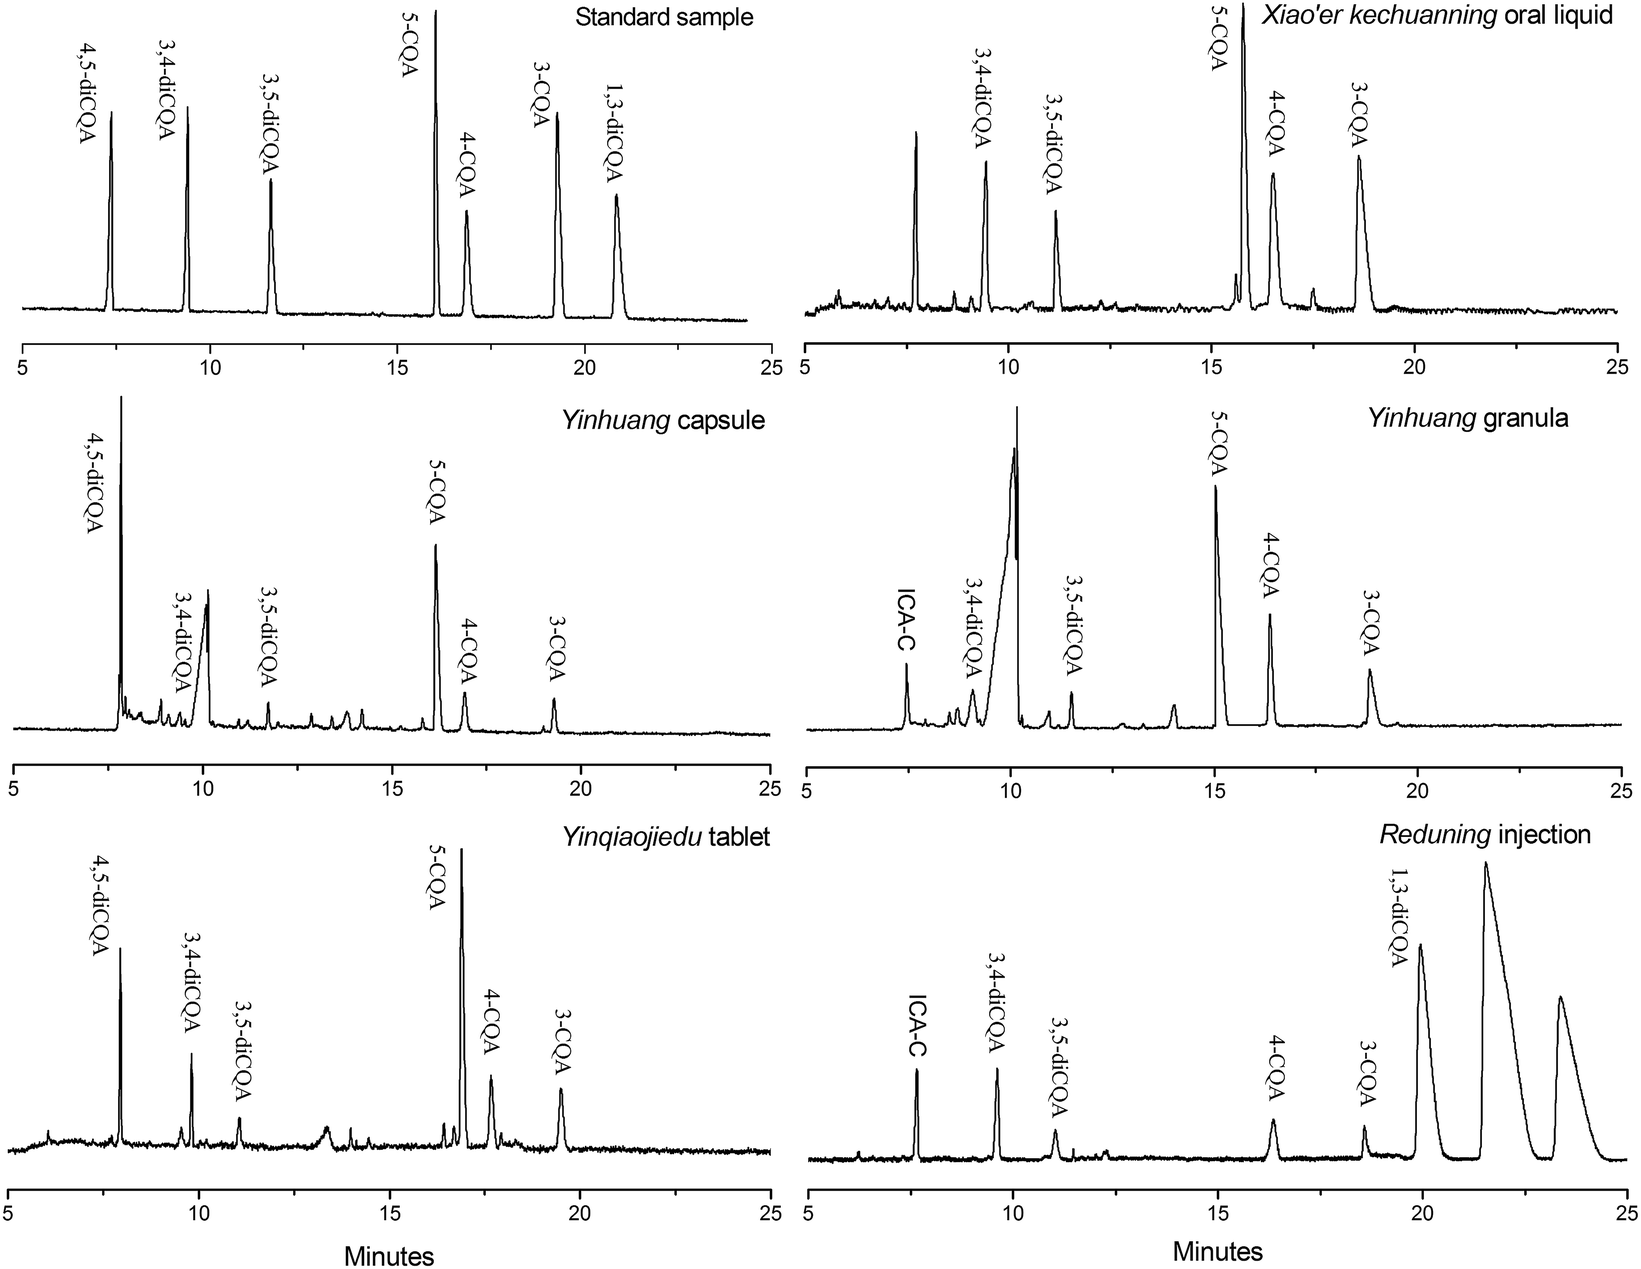
3.6. Application to honeysuckle preparations
Individual analytes in each sample were identified by standard addition and comparing electropherograms. The percentage of each CQA compound was determined from the peak area and the established calibration curves in Table 2. The electropherograms of samples of five different dosage forms are shown in Fig. 6, and they exhibit some differences at 328 nm for each sample (some samples are not shown in the figure). CQA contents of each sample are listed in Table 4. A considerable difference in CQA isomer contents among different pharmaceutical dosage forms can be observed. The CQA content is also different for the same dosage form, such as among the four oral liquids. 1,3-DiCQA is detected only in a few preparations, and Reduning injection has the highest content. These results are validated by the HPLC method and corresponding data are listed in parentheses. It can be seen that certain differences of the CQA content indeed exist between the MEEKC and HPLC method, but results are still acceptable. In addition, the 1,3-diCQA in some preparations is not quantified by MEEKC but is detected by the HPLC method. This is due to the poor detection sensitivity of CE separation resulting from a short optical pathlength equal to the capillary diameter.11 Overall, these results show that the developed low-pH MEEKC using tartrate as the chiral selector is effective and can be used as an alternative method to simultaneously separate and quantify individual CQA isomers in honeysuckle medicinal materials and related products.
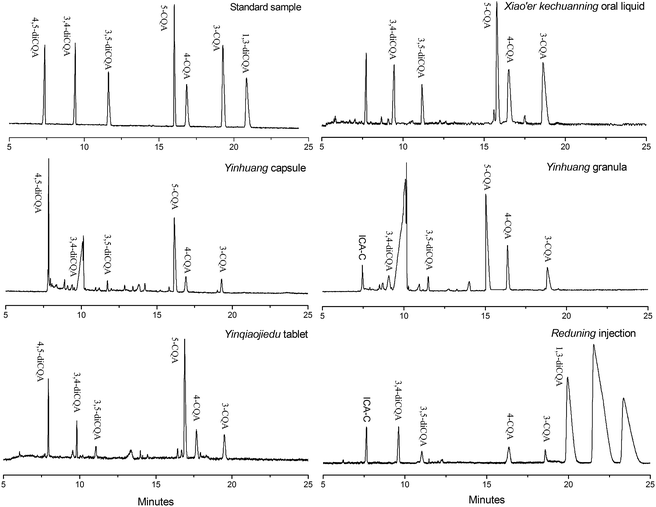 |
| | Fig. 6 Electropherograms of five different dosage forms of honeysuckle preparation samples. The microemulsion buffer contained 150 mmol L−1 SDS, 1.0% v/v n-heptane, 6.0% v/v 1-butanol, 20 mmol L−1 PST, and 50 mmol L−1 phosphate buffer at pH 2.25; injection, 0.5 psi for 10 s; voltage, −20 kV; and temperature, 20 °C. | |
Table 4 CQA contents in the honeysuckle relative preparations
| Sample |
Compound contenta |
| 4,5-DiCQA |
3,4-DiCQA |
3,5-DiCQA |
5-CQA |
4-CQA |
3-CQA |
1,3-DiCQA |
Total |
|
The values in parentheses are determined by HPLC. ND means not detected.
|
|
Injection (μg mL
−1
)
|
| Qingkailing |
24.08 (22.37) |
82.20 (80.70) |
35.35 (35.54) |
12.92 (16.72) |
23.92 (17.59) |
20.56 (14.55) |
<LOQ (3.54) |
199.03 (191.01) |
| Reduning |
85.12 (82.71) |
125.37 (123.94) |
150.21 (161.05) |
ND (3.02) |
294.33 (291.07) |
243.95 (261.60) |
375.51 (347.70) |
1274.49 (1271.09) |
|
|
Oral liquid (μg mL
−1
)
|
| Qingkailing |
31.48 (36.23) |
53.86 (42.12) |
63.85 (56.63) |
66.70 (62.08) |
87.12 (90.17) |
87.75 (78.13) |
<LOQ (8.57) |
390.76 (373.93) |
| Shuanghuanglian |
219.96 (222.11) |
344.37 (317.56) |
147.88 (143.21) |
589.72 (604.61) |
218.65 (246.94) |
321.54 (276.02) |
<LOQ (12.49) |
1842.12 (1822.94) |
| Chaiyin |
213.21 (211.16) |
326.46 (305.32) |
202.84 (195.15) |
340.74 (320.88) |
201.62 (206.82) |
260.22 (202.29) |
34.28 (38.15) |
1579.37 (1479.77) |
| Xiao'er kechuanling |
435.87 (442.60) |
214.19 (219.53) |
194.49 (178.77) |
491.31 (473.66) |
312.67 (292.85) |
325.80 (301.42) |
ND (ND) |
1974.33 (1908.83) |
|
|
Granula (μg mg
−1
)
|
| Jinyinhua |
0.36 (0.33) |
0.37 (0.30) |
<LOQ (0.06) |
1.67 (1.25) |
0.71 (0.63) |
0.53 (0.43) |
0.43 (0.39) |
4.07 (3.39) |
| Yinchai |
0.23 (0.25) |
0.17 (0.14) |
ND (ND) |
0.19 (0.16) |
0.20 (0.18) |
0.16 (0.15) |
0.19 (0.14) |
1.14 (1.02) |
| Yinhuang |
0.58 (0.61) |
0.97 (1.01) |
0.25 (0.31) |
4.76 (4.42) |
1.53 (1.31) |
0.96 (0.96) |
ND (ND) |
9.05 (8.62) |
|
|
Tablet (μg mg
−1
)
|
| Yinqiaojiedu |
1.87 (1.76) |
0.50 (0.45) |
<LOQ (0.08) |
0.77 (0.86) |
0.54 (0.34) |
0.40 (0.35) |
ND (ND) |
4.08 (3.84) |
| Vc Yinqiao |
3.69 (3.71) |
3.47 (4.02) |
1.25 (1.44) |
4.95 (4.87) |
3.00 (3.16) |
2.15 (3.26) |
<LOQ (0.16) |
18.51 (20.62) |
|
|
Capsule (μg mg
−1
)
|
| Yinhuang 1 |
28.78 (28.29) |
1.45 (1.37) |
0.39 (0.87) |
7.16 (5.14) |
2.51 (2.27) |
1.31 (1.27) |
ND (ND) |
41.60 (39.21) |
| Yinhuang 2 |
27.59 (29.48) |
1.96 (1.59) |
<LOQ (0.31) |
11.34 (10.25) |
2.18 (2.04) |
1.25 (1.14) |
ND (ND) |
44.32 (44.81) |
4. Conclusions
A rapid MEEKC method for the simultaneous separation and quantification of three monoCQA and four diCQA isomers in 13 honeysuckle preparations was developed in this study. The addition of appropriate tartrate significantly improves separation efficiency, and the seven CQA isomers could be separated and quantified within 22 min. The promoted migration velocity is probably due to the increased charge-to-mass ratio of microemulsion droplets because of the negatively charged tartrate anions. The difference in resolution variation may be related to the structural characteristics of analytes. The low buffer pH effectively suppresses the formation of EOF and prevents hydrolyzation in the separation process. The proposed method can be extensively used to determine individual CQA isomers in honeysuckle or its preparations and can provide more references for the quality evaluation and control of CQA-related products.
Acknowledgements
This work was supported by the Applied Basic Research Project of Sichuan Province (Grant No. 2014JY0042) and the Testing Platform Construction of Technology Achievement Transform of Sichuan Province (Grant No. 13CGPT0049).
References
- B. Zhang, R. Y. Yang, Y. Zhao and C. Z. Liu, J. Chromatogr. B: Anal. Technol. Biomed. Life Sci., 2008, 867, 253–258 CrossRef CAS PubMed.
- X. Shang, H. Pan, M. Li, X. Miao and H. Ding, J. Ethnopharmacol., 2011, 138, 1–21 CrossRef CAS PubMed.
- A. Tolonen, T. Joutsamo, S. Mattlla, T. Kämäräinen and J. Jalonen, Phytochem. Anal., 2002, 13, 316–328 CrossRef CAS PubMed.
- A. Farah, M. Monteiro, C. M. Donangelo and S. Lafay, J. Nutr., 2008, 138, 2309–2315 CrossRef CAS PubMed.
- S.-c. Ma, P. P. But and E. V. Ooi, Chin. J. Pharm. Anal., 2005, 25, 751 CAS.
- Q. ZHANG, J.-y. ZHANG, F.-y. GAO, X.-y. GAO, Y.-j. QIAO and J.-q. LU, Chin. J. Pharm. Anal., 2013, 1, 016 Search PubMed.
- S. C. Gouveia and P. C. Castilho, Food Res. Int., 2012, 45, 362–368 CrossRef CAS.
- J. Li, S. Jin, Y.-G. Zu, M. Luo, W. Wang, C.-J. Zhao and Y.-J. Fu, J. Food Compos. Anal., 2014, 33, 139–145 CrossRef CAS.
- M.-H. Chen and W.-H. Ding, J. Chromatogr. A, 2004, 1033, 167–172 CrossRef CAS PubMed.
- S. Vshivkov, E. Pshenichnov, Z. Golubenko, A. Akhunov, S. Namazov and R. D. Stipanovic, J. Chromatogr. B: Anal. Technol. Biomed. Life Sci., 2012, 908, 94–97 CrossRef CAS PubMed.
- H. Yang, Y. Ding, J. Cao and P. Li, Electrophoresis, 2013, 34, 1273–1294 CrossRef CAS PubMed.
- M.-Y. Tong, T. Payagala, S. Perera, F. M. MacDonnell and D. W. Armstrong, J. Chromatogr. A, 2010, 1217, 1139–1148 CrossRef CAS PubMed.
- L.-J. Wang, S.-Q. Hu, Q.-L. Guo, G.-L. Yang and X.-G. Chen, J. Chromatogr. A, 2011, 1218, 1300–1309 CrossRef CAS PubMed.
- L.-J. Wang, J. Yang, G.-L. Yang and X.-G. Chen, J. Chromatogr. A, 2012, 1248, 182–187 CrossRef CAS PubMed.
- L.-J. Wang, X.-F. Liu, Q.-N. Lu, G.-L. Yang and X.-G. Chen, J. Chromatogr. A, 2013, 1284, 188–193 CrossRef CAS PubMed.
- S. Hu, Y. Chen, H. Zhu, J. Zhu, N. Yan and X. Chen, J. Chromatogr. A, 2009, 1216, 7932–7940 CrossRef CAS PubMed.
- S.-Q. Hu, Y.-L. Chen, H.-D. Zhu, H.-J. Shi, N. Yan and X.-G. Chen, J. Chromatogr. A, 2010, 1217, 5529–5535 CrossRef CAS PubMed.
- S. Q. Hu, W. J. Lü, Y. H. Ma, Q. Hu, L. J. Dong and X. G. Chen, Electrophoresis, 2013, 34, 260–268 CrossRef CAS PubMed.
- X. Lin, Y. Wang, J. Sun, D. Xiao, W. Luo and H. Li, Anal. Methods, 2013, 5, 5201–5207 RSC.
- P. W. Stege, L. L. Sombra, R. C. Davicino and R. A. Olsina, Phytochem. Anal., 2011, 22, 74–79 CrossRef CAS PubMed.
- L. Yu, K. Chu, H. Ye, X. Liu, X. Xu and G. Chen, Trends Anal. Chem., 2012, 34, 140–151 CrossRef CAS.
- J. Zhu, S. Qi, H. Zhang, X. Chen and Z. Hu, J. Chromatogr. A, 2008, 1192, 319–322 CrossRef CAS PubMed.
- L. Yu, X. Xu, L. Huang, J. Lin and G. Chen, J. Chromatogr. A, 2008, 1198, 220–225 CrossRef PubMed.
- P. Tong, L. Zhang, Y. He, Y. Chi and G. Chen, Talanta, 2009, 77, 1790–1794 CrossRef CAS PubMed.
- Z. Li, D. Huang, Z. Tang, C. Deng and X. Zhang, Talanta, 2010, 82, 1181–1185 CrossRef CAS PubMed.
- M. Friedman and H. S. Jürgens, J. Agric. Food Chem., 2000, 48, 2101–2110 CrossRef CAS PubMed.
- Y. Narita and K. Inouye, J. Agric. Food Chem., 2013, 61, 966–972 CrossRef CAS PubMed.
- X. Guo, J. Lv, W. Zhang, Q. Wang, P. He and Y. Fang, Talanta, 2006, 69, 121–125 CrossRef CAS PubMed.
-
K. D. Altria, in Capillary Electrophoresis Guidebook, Springer, 1996, pp. 3–13 Search PubMed.
- C. Rappel, M. Galanski, A. Yasemi, L. Habala and B. K. Keppler, Electrophoresis, 2005, 26, 878–884 CrossRef CAS PubMed.
- Z. Xia, X. Jiang, X. Mu and H. Chen, Electrophoresis, 2008, 29, 835–842 CrossRef CAS PubMed.
- J. S. Green and J. W. Jorgenson, J. Chromatogr. A, 1989, 478, 63–70 CAS.
|
| This journal is © The Royal Society of Chemistry 2016 |
Click here to see how this site uses Cookies. View our privacy policy here.