 Open Access Article
Creative Commons Attribution 3.0 Unported Licence
The importance of lag time extension in determining bacterial resistance to antibiotics†
Bing
Li
ab,
Yong
Qiu
*a,
Hanchang
Shi
a and
Huabing
Yin
*b
aEnvironmental Simulation and Pollution Control State-key Joint Laboratory, School of Environment, Tsinghua University, Beijing 100084, China. E-mail: qiuyong@tsinghua.edu.cn
bDivision of Biomedical Engineering, School of Engineering, University of Glasgow, Glasgow G12 8LT, UK. E-mail: huabing.yin@glasgow.ac.uk
First published on 7th April 2016
Abstract
It is widely appreciated that widespread antibiotic resistance has significantly reduced the utility of today's antibiotics. Many antibiotics now fail to cure infectious diseases, although they are classified as effective bactericidal agents based on antibiotic susceptibility tests. Here, via kinetic growth assays, we evaluated the effects of 12 commonly used antibiotics on the lag phase of a range of pure environmental isolates and of sludge bacterial communities with a high diversity. We show that an extended lag phase offers bacteria survival advantages and promotes regrowth upon the removal of antibiotics. By utilizing both lag phase extension and IC50, the killing efficiency of an antibiotic on a strain or a community can be easily revealed. Interestingly, for several strains of relevance to endemic nosocomial infections (e.g. Acinetobacter sp. and Pseudomonas aeruginosa) and the diverse sludge communities, tetracycline and quinolone antibiotics are most likely to be resisted via extended lag phase. This discovery is significant from a clinical point view since underestimation of bacteria resistance can lead to the recurrence of diseases.
Introduction
In recent decades, the widespread antibiotic resistance in both clinical settings and the natural environments has significantly reduced the utility of today's antibiotics.1–3 New mechanisms of resistance constantly emerge, imposing significant challenges not only for the development of new antibiotics but also in the evaluation of antibiotic effectiveness in practice.4 Currently, minimum inhibition concentrations (MICs, i.e. the lowest concentration of an antimicrobial that inhibits visible growth of a microorganism) are the gold standards in determining the susceptibilities of bacteria to drugs.5–7 Although MICs indicate the inhibition of bacterial growth, they provide limited information about resistant mechanisms.In growth studies, the lag phase is the delay in growth when bacteria adapt to new environments.8 It represents the earliest stage of the bacterial growth cycle and is inherent to bacterial kinetics. The lag phase is believed to be involved in fighting pathogens,9,10 and can be influenced by many factors.11 However, it is poorly understood due to the low metabolic rate of cells10,12 and the small amounts of material available for analyses. Consequently the understanding of antibiotic effects on the lag phase is limited.6,7 Recently, the work from Balaban's group shed new light on the roles of the lag phase in the bacteria's fight against antibiotics. It was found that changes in the lag-time in order to develop tolerance was the first change made by bacteria in response to antibiotic stresses.13 This ‘tolerance by lag’ allows bacteria to survive under high antibiotic concentrations, and may facilitate the subsequent evolution of antibiotic resistance.13 Using kinetic growth assays, Theophel et al. also showed that the duration of lag phases could be a more meaningful indicator of dose-dependent antibiotic inhibition.14 These phenomena suggest that the lag phase is a key stage in developing strategies to resist killing by antibiotics, therefore an in-depth understanding of how antimicrobial agents affect the lag phase is essential for reliable evaluation of bacterial resistance.
Here, we developed a new approach, employing both lag time (λ) and the maximum specific growth rate (μ) to evaluate bacterial response from the onset of antibiotic stresses. Using this method, we evaluated the effects of 12 commonly used antibiotics on isolates of several key environmental strains and on bacterial communities extracted from activated sludge from different wastewater treatment plants (WWTPs). The sludge bacterial communities represent elegant real-world systems with high diversity.15 These bacterial communities are consistently under various antibiotic stresses16,17 and their composition varies with their geographical origin.18–23
To allow quantitative evaluation of the effects of antibiotics on lag phase, we introduce a term – “lag time extension” (LE) (LE = λc/λ0, where λc and λ0 are the lag times at the antibiotic concentration C and 0 respectively). Kinetic growth assays were employed to evaluate both λ and μ in a dose-dependent manner. Both parameters can be derived from growth curves using well-established mathematical models.24–26 By screening the dynamic responses of 8 individual strains and 2 bacterial communities from different municipal WWTPs to the chosen antibiotics, the roles of extended lag phase in against antibiotic stress are demonstrated. The combination of both LE and μ not only enables reliable evaluation of the efficacies of antibiotics but also provides insights into possible mechanisms for a microorganism in developing tolerance and resistance to a drug.
Experimental section
Bacterial strains
| Bacterial strains | Class name | Sourcea | Function |
|---|---|---|---|
| a Abbreviations: ATCC – American Type Culture Collection; ACCC – Agricultural Culture Collection of China; CICC – China Center of Industrial Culture Collection. | |||
| Escherichia coli | γ-Proteobacteria | ATCC 25922 | Control strain |
| Pseudomonas aeruginosa | γ-Proteobacteria | CICC 20546 | Carbon oxidation |
| Pseudomonas putida | γ-Proteobacteria | CICC 20541 | Carbon oxidation |
| Acinetobacter sp. | γ-Proteobacteria | ACCC 11850 | Carbon oxidation |
| Alcaligenes faecalis | β-Proteobacteria | ATCC 31529 | Carbon oxidation |
| Corynebacterium glutamicum | Actinobacteria | ACCC 10202 | Carbon oxidation |
| Comamonas denitifier | β-Proteobacteria | ATCC 700936 | Denitrification |
| Microlunatus phosphovorus | Actinobacteria | ATCC 700054 | Phosphorous removal |
Antibiotics
12 commonly used antibiotics were selected for this study (Table 2). They belong to 5 classes of antibiotics, namely β-lactam, tetracycline, aminocyclitol, quinolones and macrolide. All the antibiotics were of >98% purity. The stock solutions of each antibiotic were prepared in either deionized water to a concentration of 1 g L−1 or in methanol to a concentration of 10 g L−1,28 filtered thought a porous membrane with 0.2 μm pore size, and then stored at −20 °C. A series of concentrations (in the range of 0 to 100 mg L−1) were prepared by diluting the stock solutions in broth.| Name | Abbrev | CAS | Formula | Sourcea | Class | Mode of action38 |
|---|---|---|---|---|---|---|
| a a: Sigma Aldrich Chemie GmbH, b: Inalco spa milano Italy, c: Enzo life sciences, d: 3B scientific corporation. | ||||||
| Amoxicillin | AMO | 26787-78-0 | C16H19N3O5S·3H2O | a | β-Lactam | Inhibit the development of bacterial cell wall by interfering with transpeptidase enzymes responsible for the formation of the cross linkage between peptidoglycan strands. |
| Ampicillin sodium salt | AMP | 69-52-3 | C16H19N3O4SNa | b | ||
| Tetracycline hydrochloride | TET | 64-75-5 | C22H24N2O8 | a | Tetracycline | Bind reversibly to bacterial 30 S ribosomes and inhibit protein synthesis. |
| Chlorotetracycline | CHL | 64-72-2 | C22H23ClN2O8 | a | ||
| Kanamycin sulfate | KAN | 25398-94-0 | C18H38N4O11H2SO4 | b | Aminoglucoside | Inhibits by binding irreversibly to receptors on both the 30 S and 50 S subunits of bacterial ribosomes, resulting in mal-reading of the mRNA code |
| Norfloxacin | NOR | 70458-96-7 | C16H18FN3O3 | a | Quinolones | Inhibit the bacterial enzyme DNA gyrase that is responsible for the supercoiling of DNA, so that the DNA can twist in a number of chromosomal domains and seal around an RNA core. |
| Enrofloxacin | ENR | 93106-60-6 | C19H22FN3O3 | a | ||
| Ofloxacin | OFL | 82419-36-1 | C18H20FN3O4 | a | ||
| Ciprofloxacin | CIP | 85721-33-1 | C17H18FN3O3 | a | ||
| Erythromycin | ERY | 114-0-8 | C37H67NO13 | b | Macrolide | Interfering with protein synthesis by reversibly binding to the 50 S subunit of the ribosome. |
| Lincomycin | LIN | 154-21-2 | C18H34N2O6S HCl | c | ||
| Clarithromycin | CLA | 81103-11-9 | C38H69NO13 | d | ||
Kinetic growth assays
A computerized incubator (Bioscreen C; Lab Systems, Helsinki, Finland) was used to obtain the growth curves over a time course.29–31 To enhance the screening throughput, plates that contain 200 wells were used, allowing 200 assays to be carried out simultaneously in a single experiment. Optical density (OD600) was measured for evaluating bacterial density in suspension. Prior to each experiment, bacteria were cultured in flasks to the exponential phase (OD600 = 0.6–0.8) in appropriate culture broths (ESI, Table S1†). 5 μl of bacterial suspension and 295 μl of the culture broth either with or without antibiotics were added into each well. A medium shaking speed was used for all the experiments, but temperature was adjusted to suit different strains (ESI, Table S1†). The optical densities of samples were recorded on-line every 15 minutes for a period of 24 hours. For each condition, an average value from three replicas was given. Unless denoted, error bars are standard deviations.Models for growth and inhibition
Identification of a suitable model for fitting the growth curves was carried out at first (ESI, Fig. S-1†). An excellent agreement was found between a curve described by eqn (1)32 (the Gompertz model) and the experimental data. | (1) |
In eqn (1), N is the cell number at time t, and N0 is that at the beginning (i.e. t = 0). OD600 values indirectly reflect cell number5 and were used instead of absolute cell number N. μ is the maximum specific growth rate (i.e. the specific growth rate at the exponential phase). A is the maximum cell number (or maximum OD600 value) of a cell suspension during the experiment, and λ is the duration of the lag phase. All model parameter estimates were obtained using the gRofit package in the R software package.33
The inhibition rate (IR) is defined by eqn (2):
| IR = (μ0 − μC)/μ0 = 1 − μC/μ0 | (2) |
Lag time extension
In order to quantitatively evaluate the effects of antibiotics on lag phase, we introduced a parameter, termed “lag time extension” (LE) that is defined in eqn (3),| LE = λc/λ0 | (3) |
Results and discussion
Effects of antibiotics on the lag phase of pure strains
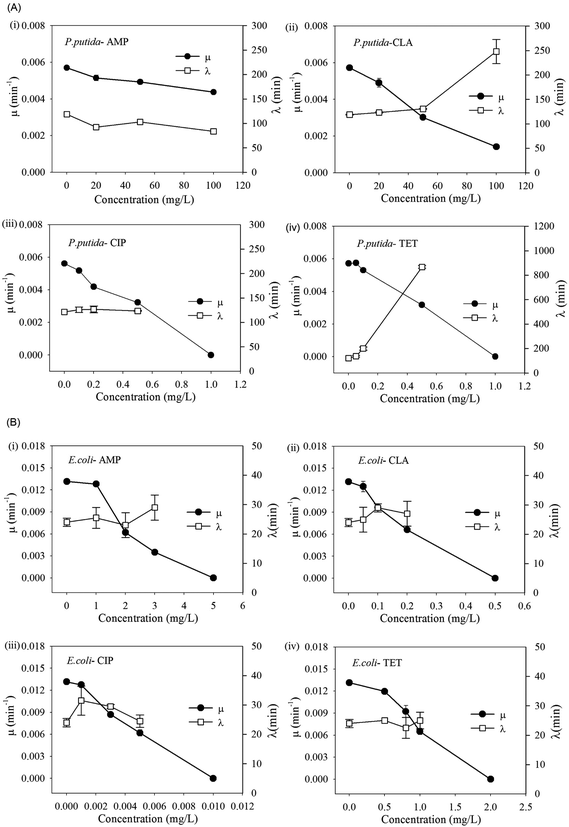
Eight pure strains as listed in Table 1 were tested under various concentrations of the selected antibiotics. More than 1500 growth curves were obtained and all fitted using Gompertz model to derive the maximum specific growth rates (μ) and lag time (λ) (ESI, Table S2†). It was found that changes of growth rate and lag time were not only dependent on antibiotic doses but also on the combination of antibiotics and the bacterial strains. Several trends were observed and four representative trends can be illustrated using Pseudomonas putida as an example (Fig. 1A). These include:(1) No substantial variations in μ and λ at high antibiotic concentrations (e.g. >100 mg L−1). This is seen, for example, in Fig. 1A-i, where Pseudomonas putida was treated with ampicillin.
(2) A substantial reduction in μ and increase in λ at high antibiotic concentrations. For example, exposure to clarithromycin at 100 mg L−1 led to >75% reduction in its maximum specific growth rate and 1.9 times extension in its lag time (Fig. 1A-ii).
(3) Strong inhibition (low values of μ) at a low antibiotic concentration (e.g. <1 mg L−1), and prior to reaching the lethal dose, an increase in antibiotic concentration resulting in a rapid decrease in μ but no obvious changes in λ. This is the case where the bacteria were treated with ciprofloxacin (Fig. 1A-iii).
(4) Similar to (3); however here, an increasing antibiotic concentration results in a rapid decrease in μ but substantial lengthening of λ. This is the case where the bacteria were treated with tetracycline (Fig. 1A-iv).
According to the measured MIC values, Pseudomonas putida is resistant to both β-lactam and macrolide antibiotics, but sensitive to both tetracycline and quinolones antibiotics when used according to the general guidelines.34 In contrast, the control strain Escherichia coli showed only trend (c) (Fig. 1B) and low MIC values (<5 mg L−1) for all the chosen antibiotics, indicating that it is susceptible to them all. It is generally believed that the lag phase protects bacteria from antibiotics via reduced cell growth. The results from Pseudomonas putida and the other pure strains (Table S2†) show that extension of lag phase was frequently employed by strains to overcome elevated antibiotic stress.
This latter phenomenon highlights the potential pitfalls when either IC50 or MIC values are used as a sole indicator in conventional antibiotic susceptibility tests. In the scenario that the lag phase is extended beyond the defined assay period (e.g. 20 hours), the absence of visible growth could be considered as complete inhibition. This scenario may account for the discrepancies observed in the previously reported MIC values of a drug for the same microorganism.14,35 Similarly, in the case that several microorganisms have comparable MIC values to a drug, those with substantially extended lag time would be classified as the same resistant as those without. Both scenarios can lead to underestimation of the bacterial resistance. From a clinical point view, this can result in insufficient treatment and a subsequent recurrence of the disease.
Effects of antibiotics on the lag phase of bacterial communities
Activated sludge contains abundant bacterial species. To understand how the bacterial communities in activated sludge respond to different classes of antibiotics, and whether the composition of a community affects the response, two bacterial communities of drastically different origins (i.e. from BJ-WWTPs and WX-WWTPs) were evaluated in the same manner as the pure strains.As shown in Table S3 (ESI†), no significant difference was observed between the bacterial communities. In contrast to pure strains, both bacterial communities showed strong resistance to all antibiotics and could still grow at 100 mg L−1 concentration of each antibiotic. In addition, the changes in μ and λ of the bacterial communities seem to fall into two dominant trends. These are illustrated using the bacterial community from a BJ-WWTP as an example (Fig. 2). One trend, as in the case of ampicillin (Fig. 2a), shows that μ and λ remain constant throughout the whole range (i.e. 0 to 100 mg L−1). This suggests that the communities can effectively eliminate β-lactam antibiotics, possibly by a well-known hydrolysis route.36,37
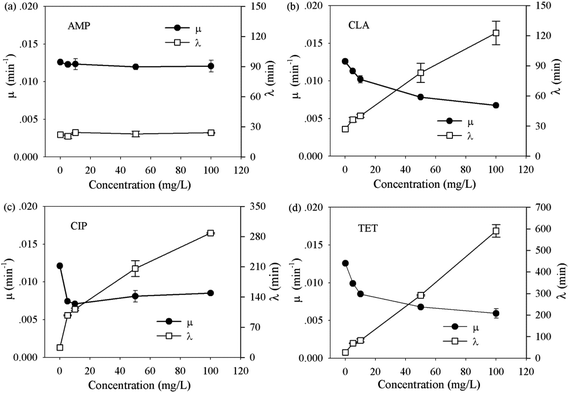 | ||
| Fig. 2 The growth dynamics of extracted bacterial community from activated sludge under the effect of selected antibiotics, AMP, CLA, CIP and TET. | ||
Another trend is shown in the case of clarithromycin, ciprofloxacin and tetracycline hydrochloride (Fig. 2b–d): with the increase in the antibiotic concentration, μ reduced rapidly (denoted as the reduction-phase) and then leveled-off (denoted as the steady-growth phase) beyond ∼20 mg L−1. This suggests that even high doses of potent antibiotics have limited inhibitory effects on the bacterial communities. However, the lag time consistently extended with increased antibiotic concentrations (Fig. 2b–d). In particular, a proportional extension of lag time was observed during the steady-growth phase, for example, from 115 min at 10 mg L−1 to 566 min at 100 mg L−1 for tetracycline hydrochloride (Fig. 2d). To confirm that the observed extension did not solely result from the death of some stains in the community, additional single cell tracking analyses were carried out using the WX-WWTP community and tetracycline hydrochloride, as an example (see protocol in the ESI†). In the absence of tetracycline hydrochloride, almost all the cells developed obvious colonies after 4 hours in culture (ESI, Fig. S-3†). In contrast, hardly any cell growth was observed when exposed to 100 mg L−1 tetracycline hydrochloride. After 10 hours in culture, obvious growth of some cells was observed. This phenomenon agrees well with the extension of lag time as measured by OD methods (i.e. 566 min). Taken together, these clearly show that the extension of lag phase is an important route to tolerate severe antibiotic stress by a bacterial community.
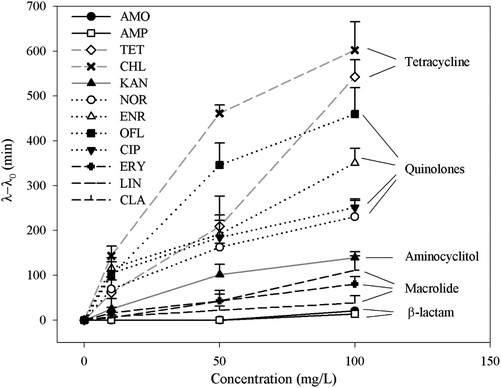
To further understand whether there is a correlation between the extension of lag time and the classes of antibiotics, average extension values of the bacterial communities were plotted as a function of antibiotic concentrations (Fig. 3). Apart from β-lactam antibiotics, the lag time extended with the increase in antibiotic concentrations. Although different classes of antibiotics function via different inhibition mechanisms,38 at the same antibiotic doses, the magnitude of the extension is in the following order: tetracyclines (TET and CHL) > quinolones (NOR, ENR, OFL and CIP) > aminocyclitol (KAN) > macrolides (ERY, LIN and CLA) > β-lactam antibiotics (AMP, AMO). It should be noted that both bacterial community comes from completely different origins and therefore consists of substantially different but broad spectrum of bacterial species. Thus the order may be applied more generically to a wide range of bacteria communities in the environment. Since substantially extended lag phase offers great survival advantages, the order indicates that the tetracyclines and quinolones antibiotics are mostly likely to lose their efficiency on many of environmental bacteria.
Predict bacteria resistance via the combination of MIC and extended lag time
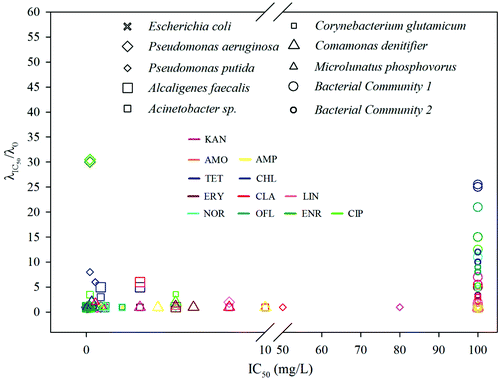
The phenomena observed so far clearly show that an extended lag phase is closely associated with the potential of a strain or a community to develop tolerance and persistence against an antibiotic. Therefore, the combination of both MIC (or IC50) and the lag time extension would provide invaluable information not only on bacterial resistance but also on the killing efficiency of a drug. Since the extension of lag time is dose dependent, we selected extension rate of lag time at IC50 (i.e. LEIC50 = λIC50/λ0) as a measure for a given bacterial–antibiotic combination.The IC50 and LEIC50 of the combinations between eight pure strains and two bacterial communities and twelve antibiotics are shown in Fig. 4 and Table S4 (ESI†). Within this IC50 – LEIC50 co-ordinate system (Fig. 4), four distinct clusters were identified based on two boundary conditions, namely LEIC50 = 2 and IC50 = 10 mg L−1, both of which are sufficient to indicate the occurrence of lag time extension and the resistance of a strain to an antibiotic. These four clusters are detailed below:
(1) Cluster 1 – where LEIC50 < 2 and IC50 < 10 mg L−1; suggesting an efficient inhibition and killing of an antibiotic on a strain.
(2) Cluster 2 – where LEIC50 > 2 and IC50 < 10 mg L−1; suggesting an inhibitory effect of a drug on a strain; however the strain has high possibility to survive the antibiotic treatment.
(3) Cluster 3 – where 10 mg L−1 ≤ IC50 < 100 mg L−1; indicating that a drug has negligible inhibition on a strain.
(4) Cluster 4 – where IC50 ≥ 100 mg L−1; indicating strong resistance of a strain to an antibiotic.
It is apparent that the majority of pure strains fall within cluster 1, indicating their susceptibility to most antibiotics. This was further confirmed by the MIC values (i.e. <1 mg L−1 for all chosen antibiotics) (ESI, Table S4†). In contrast, all the bacterial communities from the WWTPs fall within cluster 4, showing their strong resistance to all antibiotics – the phenomenon frequently observed in sludge bacterial communities where antibiotic resistant genes are often present.39,40Via this two-dimensional mapping, bacterial strains that have high potential to develop tolerance and persistence to certain antibiotics are easily singled out, as those shown in cluster 2 (e.g.Fig. 2, Pseudomonas aeruginosa to ciprofloxacin, Pseudomonas putida to chlorotetracycline). In particular, Pseudomonas aeruginosa, showed substantially high LEIC50 to enrofloxacin and ciprofloxacin, indicating that the two antibiotics can't kill Pseudomonas aeruginosa effectively. However, evaluated by MICs alone, ciprofloxacin was classified as a highly efficient bactericidal agent against Pseudomonas aeruginosa.41
Taken together, it is clear that both the concentration of antibiotics and exposure time should be taken into account when evaluating bacterial resistance to an antimicrobial agent. Quantification of the duration of lag phase facilitates the understanding of interactions between bacteria with antibiotics, allowing prediction of bacterial response at a certain level of antibiotic exposure.
Extended lag time promotes bacteria regrowth after removal of antibiotics
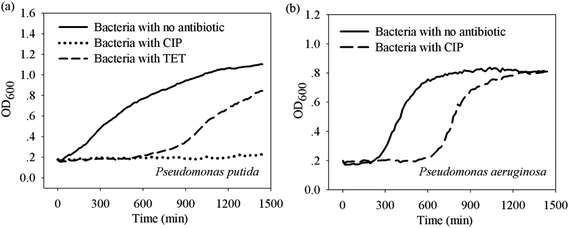
To understand to what extent an extended lag time can protect bacteria from antibiotics, some bacteria–antibiotic combinations in cluster 1 and 2 in Fig. 4 were selected for regrowth tests. Three pairs that have similar IC50 but different extension periods were chosen, namely Pseudomonas aeruginosa – ciprofloxacin (i.e. LEIC50 = 30), and Pseudomonas putida – ciprofloxacin (i.e. LEIC50 = 1), and Pseudomonas putida – tetracycline (i.e. LEIC50 = 6).As shown in Fig. 5, in comparison to the growth in broth prior to antibiotic treatments (i.e. under 10 × MIC for 24 hours), all the bacteria treated by antibiotics showed delayed regrowth in fresh broth, a phenomenon known as the post-antibiotic effect.35 Interestingly, bacteria that endured a longer lag time showed a shorter lag phase for their regrowth in broth. In particular, Pseudomonas aeruginosa after ciprofloxacin treatment reached the same maximum cell mass as those prior to the treatment within 24 hours. In contrast, regrowth was not observed during 24 hours for Pseudomonas putida after ciprofloxacin treatment. However, for Pseudomonas putida after tetracycline treatment regrowth occurred after 10 hours. These results confirm that the extension of lag time is an effective means to protect bacteria from antibiotic stress. Furthermore, it also shows that the longer the lag time the more bacteria can survive and regrow when suitable conditions arise.
Conclusion
Minimum inhibitory concentrations have been used as gold standards to indicate the resistance of a microorganism to antimicrobial agents. However, their predicative values have been challenged by the wide spread of antibiotic resistance in the environment.In this study, we have illustrated a new approach to monitor the response of bacteria from the onset of antibiotic stress, allowing both quantitative and mechanistic evaluation of the resistance of bacteria. By screening the time-course growth rates of 8 key environmental strains and 2 different sludge bacterial communities in response to 12 common antibiotics, we show that an extension of the lag time provides effective protection for the bacteria and promotes the regrowth of bacteria upon the removal of antibiotics.
With this approach, it is found that two classes of antibiotics, namely tetracycline and quinolone antibiotics, tended to be resisted by the majority of environmental strains via the extension of lag time. Furthermore, several strains of close relevance to endemic nosocomial infections,42 including Acinetobacter sp. and Pseudomonas aeruginosa, have shown substantially extended lag times to various antibiotics that are normally considered to be highly potent. This discovery is significant from a clinical point view. Evaluation of bacterial resistance without consideration of extension of lag time can lead to biased clinic decisions resulting in failed treatments.
Acknowledgements
We thank financial support from Doctoral Program Foundation of Institutions of Higher Education (20130002120005), National Natural Science Foundation of China (21337001), China Postdoctoral Science Foundation (2015M570115) and from EPSRC (EP/H04986X/1). The authors thank Mr Zhang Jinshan, Ms. Nie Zhihua and Ms. LiYunxia for their laboratory assistance.References
- K. Kümmerer, Chemosphere, 2009, 75, 417–434 CrossRef PubMed.
- K. Lewis, Nat. Rev. Microbiol., 2007, 5, 48–56 CrossRef CAS PubMed.
- M. A. Fischbach and C. T. Walsh, Science, 2009, 325, 1089–1093 CrossRef CAS PubMed.
- Y.-Y. Lu, Y. Wang, T. R. Walsh, L. X. Yi, R. Zhang, J. Spencer, Y. Doi, G. Tian, B. Dong, X. Huang, L. Yu, D. Gu, H. Ren, X. Chen, L. Lv, D. He, H. Zhou, Z. Liang, J. H. Liu and J. Z. Shen, Lancet Infect. Dis., 2016, 16, 161–168 CrossRef.
- C. Begot, I. Desnier, J. D. Daudin, J. C. Labadie and A. Lebert, J. Microbiol. Methods, 1996, 25, 225–232 CrossRef.
- B. Halling-Sorensen, G. Sengelov and J. Tjornelund, Arch. Environ. Contam. Toxicol., 2002, 42, 263–271 CrossRef CAS PubMed.
- U. J. Strotmann, H. Eglsaer and U. Pagga, Chemosphere, 1994, 28, 755–766 CrossRef CAS.
- M. D. Rolfe, C. J. Rice, S. Lucchini, C. Pin, A. Thompson, A. D. S. Cameron, M. Alston, M. F. Stringer, R. P. Betts, J. Baranyi, M. W. Peck and J. C. D. Hinton, J. Bacteriol., 2012, 194, 686–701 CrossRef CAS PubMed.
- P. Battig, L. J. Hathaway, S. Hofer and K. Muhlemann, Microbes Infect., 2006, 8, 2612–2617 CrossRef PubMed.
- D. Madar, E. Dekel, A. Bren, A. Zimmer, Z. Porat and U. Alon, BMC Syst. Biol., 2013, 7, 13 CrossRef PubMed.
- I. A. M. Swinnen, K. Bernaerts, E. J. J. Dens, A. H. Geeraerd and J. F. Van Impe, Int. J. Food Microbiol., 2004, 94, 137–159 CrossRef CAS PubMed.
- D. Schultz and R. Kishony, BMC Biol., 2013, 11, 3 CrossRef PubMed.
- O. Fridman, A. Goldberg, I. Ronin, N. Shoresh and N. Q. Balaban, Nature, 2014, 513, 418–421 CrossRef CAS PubMed.
- K. Theophel, V. J. Schacht, M. Schluter, S. Schnell, C.-S. Stingu, R. Schaumann and M. Bunge, Front. Microb., 2014, 5, 1–10 Search PubMed.
- M. Wagner and A. Loy, Curr. Opin. Biotechnol., 2002, 13, 218–227 CrossRef CAS PubMed.
- K. G. Karthikeyan and M. T. Meyer, Sci. Total Environ., 2006, 361, 196–207 CrossRef CAS PubMed.
- L. Gao, Y. Shi, W. Li, H. Niu, J. Liu and Y. Cai, Chemosphere, 2012, 86, 665–671 CrossRef CAS PubMed.
- T. Stalder, M. Alrhmoun, J.-N. l. Louvet, M. Casellas, C. Maftah, C. Carrion, M.-N. l. Pons, O. Pahl, M.-C. Ploy and C. Dagot, Environ. Sci. Technol., 2013, 47, 7909–7917 CrossRef CAS PubMed.
- J. N. Louvet, C. Giammarino, O. Potier and M. N. Pons, Environ. Pollut., 2010, 158, 688–693 CrossRef CAS PubMed.
- J.-N. l. Louvet, Y. Heluin, G. Attik, D. Dumas, O. Potier and M.-N. l. Pons, Process Biochem., 2010, 45, 1787–1794 CrossRef CAS.
- N. Collado, G. Buttiglieri, E. Marti, L. Ferrando-Climent, S. Rodriguez-Mozaz, D. Barceló, J. Comas and I. Rodriguez-Roda, Chemosphere, 2013, 93, 99–106 CrossRef CAS PubMed.
- M.-T. Guo, Q.-B. Yuan and J. Yang, Chemosphere, 2015, 136, 79–85 CrossRef CAS PubMed.
- C. L. Amorim, A. S. Maia, R. B. R. Mesquita, A. O. S. S. Rangel, M. C. M. van Loosdrecht, M. E. Tiritan and P. M. L. Castro, Water Res., 2014, 50, 101–113 CrossRef CAS PubMed.
- P. Dalgaard and K. Koutsoumanis, J. Microbiol. Methods, 2001, 43, 183–196 CrossRef CAS PubMed.
- F. Baty and M.-L. Delignette-Muller, Int. J. Food Microbiol., 2004, 91, 261–277 CrossRef PubMed.
- S. Perni, P. W. Andrew and G. Shama, Food Microbiol., 2005, 22, 491–495 CrossRef.
- M. Gutierrez, J. Etxebarria and F. L. de Las, Water Res., 2002, 36, 919–924 CrossRef CAS PubMed.
- Clinical & Laboratory Standards Institute, http://www.clsi.org.
- E. Lowdin, I. Odenholt-Tornqvist, S. Bengtsson and O. Cars, Antimicrob. Agents Chemother., 1993, 37, 2200–2205 CrossRef CAS PubMed.
- R. C. McKellar and A. Hawke, Int. J. Food Microbiol., 2006, 106, 169–175 CrossRef PubMed.
- Y. Li, J. A. Odumeru, M. Griffiths and R. C. McKellar, Int. J. Food Microbiol., 2006, 110, 278–285 CrossRef CAS PubMed.
- M. H. Zwietering, I. Jongenburger, F. M. Rombouts, K. Van and T. Riet, Appl. Environ. Microbiol., 1990, 56, 1875–1881 CAS.
- M. Kahm, G. Hasenbrink, H. Lichtenberg-Fraté, J. Ludwig and M. Kschischo, J. Stat. Softw., 2010, 33, 1–21 Search PubMed.
- NCCSL, NCCLS document M7-A4, National Committee of Clinical Laboratory Standards, Wayne, PA, 2006 Search PubMed.
- B. Halling-Sorensen, Arch. Environ. Contam. Toxicol., 2001, 40, 451–460 CrossRef CAS PubMed.
- R. Andreozzi, V. Caprio, C. Ciniglia, M. De Champdore, R. Lo Giudice, R. Marotta and E. Zuccato, Environ. Sci. Technol., 2004, 38, 6832–6838 CrossRef CAS PubMed.
- A. Langin, R. Alexy, A. Konig and K. Kummerer, Chemosphere, 2009, 75, 347–354 CrossRef PubMed.
- Merck, in Merch veterinary manual,Merck & Co., 8th edn, 1998 Search PubMed.
- K. Kummerer, Chemosphere, 2009, 75, 435–441 CrossRef PubMed.
- J. Q. Su, B. Wei, W. Y. Ou-Yang, F. Y. Huang, Y. Zhao, H. J. Xu and Y. G. Zhu, Environ. Sci. Technol., 2015, 49, 7356–7363 CrossRef CAS PubMed.
- L. J. Chalkley and H. J. Koornhof, Antimicrob. Agents Chemother., 1985, 28, 331–342 CrossRef CAS PubMed.
- E. BergogneBerezin and K. J. Towner, Clin. Microbiol. Rev., 1996, 9, 148–165 CAS.
Footnote |
| † Electronic supplementary information (ESI) available: Fig. S-1: curve fitting of experimental data with different models; Fig. S-2: obtaining IC50 and MIC from the inhibition curve; Table S1: bacterial culture conditions; Table S2: the specific growth rates and lag times of pure strains under different antibiotics; Table S3: the specific growth rate and lag time of bacterial communities under different antibiotics; protocols for additional tests on sludge bacteria cells under tetracycline inhibition; Table S4: IC50, MIC and LEλ at IC50 of all bacteria strains under different antibiotics. See DOI: 10.1039/c5an02649k |
| This journal is © The Royal Society of Chemistry 2016 |

