Robust NMR water signal suppression for demanding analytical applications†
Juan A.
Aguilar
 * and
Simon. J.
Kenwright‡
Department of Chemistry. Durham University, South Road, Durham, DH1 3LE, UK. E-mail: J.a.aguilar@durham.ac.uk
First published on 18th November 2015
Abstract
We describe the design and application of robust, general-purpose water signal suppression pulse sequences well suited to chemometric work. Such pulse sequences need to deal well with pulse mis-calibrations, radiation damping, chemical exchange, and the presence of sample inhomogeneities, as well as with significant variations in sample characteristics such as pH, ionic strength, relaxation characteristics and molecular weight. Of course, such pulse sequences should produce un-distorted lineshapes and baselines and work well both under automation and in the hands of non-experts. As an example, one such pulse sequences, Robust-5, will be presented. This new pulse sequence meets those criteria and is able to reduce a 50 M proteo water signal down to a 0.9 mM level, without fine tuning, and under automation, and it is therefore well suited to the most demanding of analytical applications.
1 Introduction
Suppression of strong solvent signals in NMR, is a necessity for the analysis of samples with a high proteo water content. There are a number of pulse sequences that achieve this.1,2 Many will produce good results in the hands of specialists, particularly when there is sufficient time to optimize conditions on individual samples. However, the scenario where specialists work optimizing experiments on a sample-by-sample basis is increasingly rare. Samples are often run under automation and, at times, manually by researchers. Unfortunately, the multidisciplinary character of many projects means that the time allocated to learn NMR is often insufficient to allow every researcher to become an expert. For these reasons, it is important to design robust, easy to set up, and efficient pulse sequences that are tolerant of the problems that challenge even the experts. An ideal general-purpose pulse sequence should deal well with pulse mis-calibrations, radiation damping, chemical exchange, the presence of sample inhomogeneities, and significant variations in sample characteristics such as pH, ionic strength, relaxation characteristics, and molecular weight. Of course, such pulse sequences should produce undistorted line shapes and baselines, and work well under automation. The present paper deals with the design of one such pulse sequence, the Robust-5, but the principles discussed here could be used to design other pulse sequences. As such, these principles are as important as the pulse sequence itself. Particular attention has been paid to addressing problems important for chemometric work.2 Experimental section
The Robust-5 pulse sequence is presented in Fig. 1. Its performance was tested using 400, 600 and 700 MHz spectrometers, with statistical analysis being carried out using the 600 MHz and the 700 MHz spectrometers equipped with Agilent OneNMR Probes able to deliver a maximum pulsed field gradient of 62 G cm−1. Thirty two scans were collected each comprising 65![[thin space (1/6-em)]](https://www.rsc.org/images/entities/char_2009.gif) 536 complex data points and a spectral width of 10 kHz. The repetition time was 6.3 s, of which 3.3 comprised the acquisition time. The W5 inter-pulse delay was set to 240 μs when using the 600 MHz spectrometer, and to 287 μs when using the 700 MHz one. In all cases rectangular 1 ms pulsed field gradients were used with a strength of G1 = 28.3 G cm−1 (first pair) and G2 = 4.9 G cm−1 (second pair). The gradient stabilization delay was 0.5 ms. The first pair of lock pre-focusing field gradients were separated by 1.5 ms delay from the first radio-frequency pulse. In all cases the timing of the W5 element was time corrected as prescribed by Wang et al.3 To test the performance of the pulse sequence and the degree of suppression that can be achieved under automation, 26 samples were produced covering different sample compositions, concentrations, dynamic ranges, pH, and salinity. The samples were of commercial origin apart from the saliva and the urine ones, which were obtained from a healthy volunteer and used without alteration apart from adding D2O to a level of 10% v/v. These samples comprised egg white, river water, fermented soybean paste, dried tuna flakes, tuna-based flavouring, tomatoes, kelp, hand-wash, cayenne pepper, tooth paste (brand 1), tooth paste (brand 2), melt water from a commercial batch of frozen boiled prawns, boiled prawns (meat), yogurt, grapes, balsamic vinegar, fresh mint leaves, fresh parsley, fresh sage, tomato juice (commercial), garlic cloves, garden peas, and garden pea pods. Those samples that already had a high water content were used without modification other than adding D2O (10% v/v) and 3-(trimethylsilyl)-2,2′,3,3′-tetraadeuteropropionic acid (TSP-d4) at 10 mM concentration. In the case of vegetable-based solid samples, 100 mg of material was frozen in liquid nitrogen and crushed using a mortar and pestle, then allowed to thaw. The resultant paste was extracted using 2 mL of H2O/D2O (90%, 10%) containing TSP-d4 at 10 mM concentration. The sample used in Fig. 2 was produced by dissolving 10 mg of γ-aminobutyric acid (GABA) in 90% H2O–10% D2O. The NMR datasets can be found at: doi:10.15128/1831cj937.
536 complex data points and a spectral width of 10 kHz. The repetition time was 6.3 s, of which 3.3 comprised the acquisition time. The W5 inter-pulse delay was set to 240 μs when using the 600 MHz spectrometer, and to 287 μs when using the 700 MHz one. In all cases rectangular 1 ms pulsed field gradients were used with a strength of G1 = 28.3 G cm−1 (first pair) and G2 = 4.9 G cm−1 (second pair). The gradient stabilization delay was 0.5 ms. The first pair of lock pre-focusing field gradients were separated by 1.5 ms delay from the first radio-frequency pulse. In all cases the timing of the W5 element was time corrected as prescribed by Wang et al.3 To test the performance of the pulse sequence and the degree of suppression that can be achieved under automation, 26 samples were produced covering different sample compositions, concentrations, dynamic ranges, pH, and salinity. The samples were of commercial origin apart from the saliva and the urine ones, which were obtained from a healthy volunteer and used without alteration apart from adding D2O to a level of 10% v/v. These samples comprised egg white, river water, fermented soybean paste, dried tuna flakes, tuna-based flavouring, tomatoes, kelp, hand-wash, cayenne pepper, tooth paste (brand 1), tooth paste (brand 2), melt water from a commercial batch of frozen boiled prawns, boiled prawns (meat), yogurt, grapes, balsamic vinegar, fresh mint leaves, fresh parsley, fresh sage, tomato juice (commercial), garlic cloves, garden peas, and garden pea pods. Those samples that already had a high water content were used without modification other than adding D2O (10% v/v) and 3-(trimethylsilyl)-2,2′,3,3′-tetraadeuteropropionic acid (TSP-d4) at 10 mM concentration. In the case of vegetable-based solid samples, 100 mg of material was frozen in liquid nitrogen and crushed using a mortar and pestle, then allowed to thaw. The resultant paste was extracted using 2 mL of H2O/D2O (90%, 10%) containing TSP-d4 at 10 mM concentration. The sample used in Fig. 2 was produced by dissolving 10 mg of γ-aminobutyric acid (GABA) in 90% H2O–10% D2O. The NMR datasets can be found at: doi:10.15128/1831cj937.
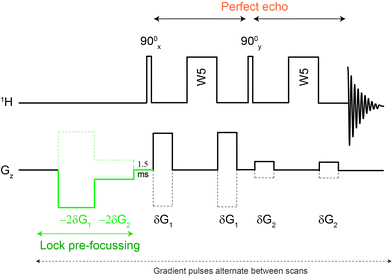 | ||
| Fig. 1 The Robust-5 pulse sequence. Eddy current distortions as well as lock signal destruction are minimised using lock pre-focussing pulsed field gradients. J-Evolution distortions are minimised using a “perfect echo” approach. Signals from parts of the sample where B1 is quite inhomogeneous are eliminated by the phase-cycle. The pulse sequence and its phase cycle can be found in the ESI.† The polarity of the gradients alternates between scans. Optimum results can be obtained using G1/G2 = 5.8, G1 = 28.3 G cm−1 and δ = 1.0 ms. Gradient stabilization delays of 0.5 to 1.0 ms were used. | ||
3 Results and discussion
3.1 The basis of the new pulse sequence
One of the most efficient and widespread solvent signal suppression approaches, and the one used in the present publication, combines selective refocusing pulses with pulsed field gradients. Pulse sequences of this type have the advantage that they do not cause sample heating, attenuate protein signals, cause metabolite protein-mediated saturations or suppress signals from exchangeable protons, all of which are common problems with otherwise robust saturation-based approaches. These pulse sequences are very popular and have been used in fields such as food analysis,4 metabo(l/n)omics,5,6 drug discovery,7 and environmental studies.8 Within this class, sequences that use the excitation sculpting principle9 are particularly efficient. Some excitation sculpting pulse sequences use a combination of hard pulses and delays, such as W5,10 or PM,11 others a combination of hard and soft pulses.9,12,13 In the present work, a W5-based approach has been used as a starting point because it can be readily set-up by non-experts and because it lends itself well to the purposes of the present investigation. Starting with the basic W5-based pulse sequence, several elements will be progressively incorporated, although it has to be noted that improving the W5 sequence itself is not the purpose of the present publication, and that the principles discussed here can be equally well applied to the design of other pulse sequences. Although the sequences described here were primarily acquired on Varian equipment, the principles discussed can be readily implemented on any modern spectrometer, and could equally be applied to improve pulse sequences intended to supress multiple resonances.14,153.2 The J-modulation problem
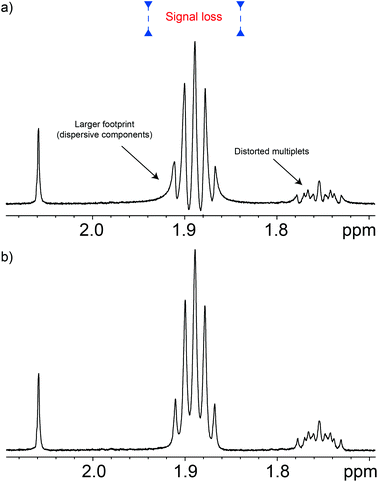
Apart from the excitation sculpting principle itself, a particular feature that makes this class of pulse sequences efficient is that the suppression block is located just before the acquisition period, so there is little opportunity for the water signal to recover. This feature is particularly useful when adding such schemes to other pulse sequences but, unfortunately, it comes at a price since signals evolve according to their J-couplings during the excitation sculpting period. This distorts and weakens signals, and even increases signal overlap,16 causing problems for chemometric work. For example, distorted signals impair the use of pattern recognition programs. Often these distortions feature negative components that interfere with non-negativity constraints used in procedures such as automated baseline corrections, and multivariate analysis. These distortions can be seen in Fig. 2. Note that this problem is not exclusive to the W5-based pulse sequences, but is common among the Watergate family. The problem is always present although it is usually overlooked. Such is the case when signals overlap, as in metabo(l/n)omic samples, or when signals are broadened either by the use of apodisation or simply by their relaxation processes. The use of bucketing, typical of multivariate statistics such as principal component analysis (PCA), might conceal the problem in early stages of the analysis, but it will reappear while trying to identify the species that form the principal components.As described, J-evolution increases signal overlap because it converts in-phase signals into anti-phase ones which having a dispersive character, occupy more than four times the spectral width of the corresponding in-phase signal. Fortunately the in-phase signal usually dominates. Furthermore, the presence of anti-phase components causes quantitation errors since typical anti-phase signals have zero net integral.
Another undesirable consequence of the modulation problem is that it prevents users from realizing the full potential of these sequences because the length of the pulsed gradients and the associated gradient recovery delays have to be kept short in order to avoid large distortions. The consequence of short pulsed field gradients is a larger unsuppressed water signal, while reduced gradient recovery delays cause field disturbances that result in further distortions, (see Fig. 5 and 6, and the accompanying text).
In principle, some anti-phase components can be removed using a purging spin-lock, but while this eliminates the dispersive component of the signal, it sometimes does so at the cost of degrading the quality of the suppression. Fortunately, there are better solutions. The anti-phase terms can be mostly reconverted into in-phase terms using the so called “perfect echo”.17,18 This can be achieved by adding a 90° pulse with a phase orthogonal to that of the excitation pulse in between the two refocusing elements, so as to form two echoes, as in Fig. 1. The refocusing element can be the W5 composite pulse, as in Fig. 1, or any other suitable refocusing element provided that it does not produce major phase shifts. The improvements in the quality of the data can be appreciated comparing the results of the classic W5, itself a good pulse sequence, with those produced by the new Robust-5 sequence that incorporates the “perfect echo”, see Fig. 2. Multiplets in the former show dispersive character, larger footprints, and, overall, reduced intensities when compared with the latter. A further benefit of the latter, is that both gradient duration and recovery times can be lengthened to produce better suppression factors, and to reduce field disturbances. These two factors are described in detail below.
3.3 Tolerance to mis-calibrations and radiation damping
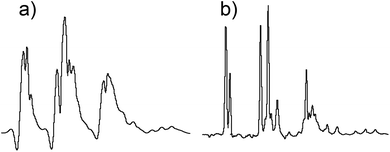
A necessary quality of any robust pulse sequence is its tolerance to pulse mis-calibrations, which are more common on real samples than we might wish, particularly under automation. Both the Robust-5 and the classic W5-based excitation sculpting pulse sequences were the subject of several tests in which all the radiofrequency pulses were mis-calibrated. Radiation damping was always present in these tests, as expected at high fields when dealing with samples dissolved in 90% H2O. The results are seen in Fig. 3 and 4. While the classic version fails to attenuate the water signal when pulses are longer than they should be, see Fig. 3, Robust-5 remains always reliable. While, in the first case mis-calibration results in unusable spectra (Fig. 4a) in the second one the results are still fine (Fig. 4b). It was also found (results not shown) that the excitation sculpting pulse sequence that uses shaped pulses instead of the W5 element also fails when pulses are longer that they should be.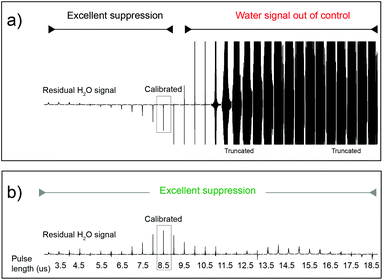 | ||
| Fig. 3 Plots of the residual water signal as a function of pulse length for the classic W5 pulse sequence (a) and for the new Robust-5 (b). The value plotted represents the value of first pulse in the pulse sequence, ideally a hard π/2 pulse. All pulses in the pulse sequence are calculated with respect to this value so that all pulses are proportionally mis-set when this one is. The performance of both versions is excellent when pulses of the correct length, or lower, are used. However, longer pulses (b) cause the classic version to lose control of the water signal. The result is an unusable spectrum, as can be seen in Fig. 4a. The same result was obtained when shaped pulses were used instead of the W5 composite. In stark contrast, the performance of Robust-5, Fig. 3b and 4b, is always excellent. The sample is an aqueous extract of a dried tuna food supplement. Details of its preparation are reported in the Experimental section. | ||
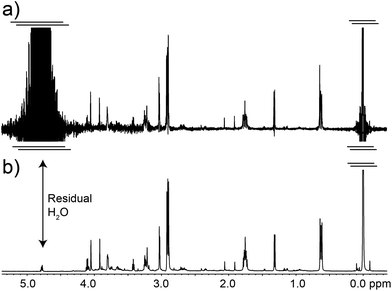 | ||
| Fig. 4 The classic excitation sculpting-W5 pulse sequence fails when pulses longer that the correct ones are used (a). In stark contrast, the descendant of the W5 pulse sequence, Robust-5 does not fail even when pulses are 50% longer that they should be (b). This tolerance to pulse mis-calibration makes the new pulse sequence ideal for automation as well as for manual NMR experiments carried out by non-experts. The sample is the same presented in Fig. 3 and both spectra correspond to the case where a 12.5 μs pulse was used instead of the correct 8.5 μs one. As in Fig. 3, all pulses in the pulse sequence were calculated with respect to this one as if it were a π/2 pulse. All other experimental details have been specified in the Experimental section. | ||
3.4 Signal distortions due to field disturbances
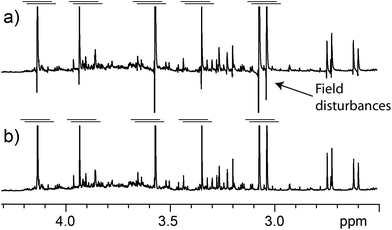
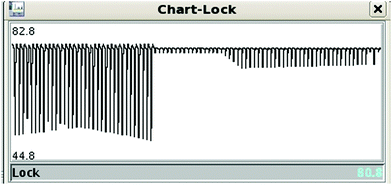
A typical problem of pulse sequences that use pulsed field gradients is that the gradients can cause signal and baseline distortions.19 Field gradients destroy the deuterium signal used by the field-frequency feedback mechanism that keeps signals from drifting when the main magnetic field drifts (“the lock”). An additional problem derived from the use of pulsed field gradients is that the switching of the gradient coil generates eddy currents. These introduce field disturbances that cause further distortions that often make signals look tilted towards one side, giving the false impression that there is a phasing problem (see Fig. 5 and 6). Notice, however, that the problem cannot be removed by phase corrections. The severity of the eddy current problem depends on a number of factors. In our NMR service, two probe-heads running on 400 and 600 MHz spectrometers show moderate effects; another one, operating on the same 600 MHz instrument, is mostly problem-free, while the probe-head of our 700 MHz instrument shows intrusive distortions intermittently.While problems with eddy currents can be minimized by increasing gradient stabilization delays, there is a conflicting demand to keep gradient stabilization delays short to minimize the J-evolution problem. With the “perfect echo” approach, however, they can be lengthened appropriately. At the same time, the destruction (defocusing) of the deuterium signal can be mostly reversed by using lock pre-focusing pulsed field gradients with the same area but the opposite polarity as those already present in the pulse sequence.20 These pre-focusing elements should be located before the first excitation pulse to avoid destroying signals of interest, as shown in Fig. 1. This only works when pairs of positive and negative gradients are close to one another relative to T2, otherwise lock signals decay before they can be refocused. Using this approach, the loss in lock signal is as low as 10%. This should enable spectrometers to maintain better control of the feed-back mechanism, and to prevent an irreversible loss of the lock when dealing with samples, such as the present ones, that have a low deuterium content (see Fig. 7).
Another benefit of the pre-focusing approach is that it reduces the severity of the eddy current problem because every gradient pulse has an equivalent one with the opposite polarity.21 Finally, a judicious arrangement of the pulsed field gradients can be used to further minimize the problem. The closer the gradient pulses are to the beginning of the FID, the larger the distortion they cause; the stronger they are, the worse. It makes sense then to make the pair closer to the beginning of the FID the weaker pair, and those further from the FID the stronger, as in Fig. 1. This also makes sense because the last pair has to deal with a water signal that has been reduced to a fraction of its original size by the first pair. The efficiency of the approach in reducing distortions caused by eddy currents can be appreciated in Fig. 5.
Another approach that can be used to correct signal distortions due to field disturbances is reference deconvolution.22 This approach uses a signal of known characteristics, typically a singlet such as TSP, to eliminate experimental infelicities such as imperfect shimming, spinning sidebands and, of course, signal distortions due to field disturbances. Its application is very simple and it can be used to produce good results out of otherwise unusable spectra. Worth noting is the potential of reference deconvolution in improving the quality of data in metabo(l/n)omic studies, a field that often requires the suppression of strong water signals.23 In Fig. 6, for example, reference deconvolution was used to correct signal distortions due to field disturbances as well as to maximize the resolution of the spectrum (resolution enhancement). It has to be kept in mind though, that while reference deconvolution can correct problems caused by eddy currents, it cannot avoid the destruction of the deuterium signal, so the use of the pre-focusing gradients is still recommended, although both techniques can be profitably used together.
Again it should be noted that problems caused by the use of pulsed field gradients are not exclusive to the type of pulse sequence used here.
3.5 Suppression of signals from very inhomogeneous parts of the sample
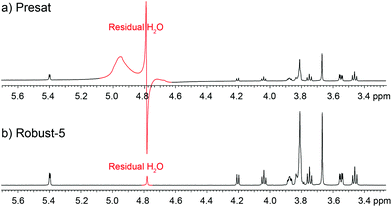
A remarkable feature of Robust-5, and possibly of all the excitation sculpting family, is that it eliminates signals from regions where B1 is inhomogeneous such as regions close to the top and bottom of the coil.24 Such signals are problematic and often limit otherwise good pulse sequences such as pre-saturation. An example of the problem while using pre-saturation can be seen in Fig. 8. Notice the broad components of the residual water signal. These remain un-suppressed even when using such a powerful saturation pulse that many real sample signals are also attenuated. The lower the concentration of the sample, the more intrusive these signals are. These signals can be eliminated by adding “depth pulses”,25 but even this is unnecessary in the case of Robust-5, as the phase cycle of the W5 elements will have the same effect, i.e, it will eliminate magnetisation arising from parts of the sample with poor B1 homogeneity, as show in Fig. 8 and 9. Clean results can be produced provided that at least eight transients are used, although thirty two are preferred to complete the pulse sequence phase cycle. In any case, the number of transients should be always a multiple of two, as shown in Fig. 9.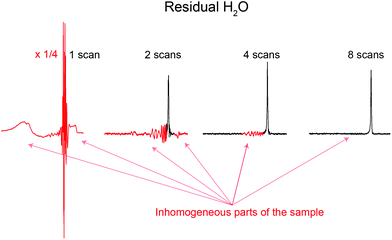 | ||
| Fig. 9 Water signals from inhomogeneous parts of the sample located at the edges of the sample, corresponding here to the red lobes around the sharp water peak, are suppressed by the phase cycle of Robust-5. This phase cycle, see the ESI,† acts as a “depth-pulse”, see text for details. The figure plots the residual water signal as a function of the number of scans. It can be seen that eight scans give clean results although the full phase cycle requires thirty two. In any case, the number of scans used must be a multiple of two. The sample used is the same as in Fig. 8. The first spectrum has been reduced vertically by a factor of four to fit it in the figure. | ||
3.6 Robustness of the pulse sequence under automation
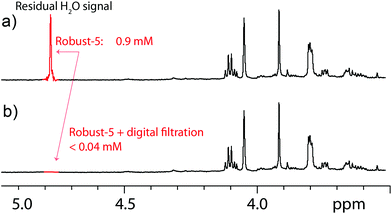
Finally, the performance of the new pulse sequence was tested under automation using 26 samples and several spectrometers. These samples were also used to determine whether the new pulse sequence tolerates the presence of radiation damping, a hurdle at high fields,26 pulse mis-calibrations, and sample inhomogeneities, among other factors. Samples included plant extracts, products from the food and cosmetic industry, several biofluids, river water, and samples from synthetic chemistry. Factors such as pH, and ionic strength varied markedly among the samples. Concentrations ranged over more than an order of magnitude. Pulses were not calibrated on individual samples and radiation damping was always present. Furthermore, some samples developed precipitates, floculates and even bubbles while waiting to be measured. In spite of all of these problems, the pulse sequence performed to a high standard. On average, the residual water signal was reduced to a mere 0.9 mM. Near total suppression (< 0.04 mM) can be achieved using simple processing digital filters in conjunction with Robust-5 (see Fig. 10). As a reference, the concentration of the twelve most abundant human serum metabolites detectable by NMR range from 5 mM (cholesterol) to 0.35 mM ((R)-3-hydroxybutyric acid).27 Digital filtration may be impractical when residual signals are large, broad, and distorted, as in Fig. 8a, but this is not the case here. Such filters can be easily automated to help with the normalisation of data destined for statistical analysis, especially when very low metabolite concentrations are expected. However, the performance of the sequence is such that this is rarely necessary.It is important, if very high levels of suppression are sought, to optimize the duration and strength of the pulsed field gradients, as well as their ratios. We have found that a ratio of 5.8 between the first and the second gradient pairs produces excellent results when 1 ms long gradient pulses of 28.3 G cm−1 (first pair) are used. The optimum gradient stabilization delay varies among probes but 0.5 to 1 ms delays are often adequate. It was found that in order to minimize signal distortions the pre-focusing gradient pules and the first radio-frequency pulse should be separated by at least 1.5 ms, although this may vary among probes. The number of scans should be a multiple of two, and a minimum of 8 scans should be acquired. Finally, alternating the polarity of the gradient pulses every other scan seems to slightly improve results. Again, the latter is probably probe dependent.
4 Conclusions
The present publication presents an efficient and robust, yet easy to set-up, pulse sequence. The pulse sequence deals well with pulse mis-calibrations, radiation damping, chemical exchange, the presence of sample inhomogeneities and significant variations in sample characteristics such as pH, ionic strength, relaxation characteristics and molecular weight. The pulse sequence produces undistorted line shapes and baselines and works well both under automation and in the hands of non-experts. In addition, the new pulse sequence reduces a typical 50 M water signal down to less than 1 mM, a signal attenuation factor suited for the most demanding applications. Other pulse sequences of equal or even better quality can be derived using the principles discussed.Acknowledgements
The authors are indebted to the Durham University (UK) solution-state NMR service.Notes and references
- R. T. McKay, Annu. Rep. NMR Spectrosc., 2009, 66, 33 CrossRef CAS.
- G. Zheng and W. S. Price, Prog. Nucl. Magn. Reson. Spectrosc., 2010, 56, 267 CrossRef CAS PubMed.
- J. Wang, X. Zhang, P. Sun, X. Jiang, B. Jiang, C. Cao and M. Liu, J. Magn. Reson., 2010, 206, 205 CrossRef CAS PubMed.
- I. Berregi, J. I. Santos, G. del Campo, J. I. Miranda and J. M. Aizpurua, Anal. Chim. Acta, 2003, 486, 269 CrossRef CAS.
- C. A. Daykin, R. Bro and F. Wulfert, Metabolomics, 2012, 8, S52 CrossRef.
- Y. Du, W. Lan, Z. Ji, X. Zhang, B. Jiang, X. Zhou, C. Li and M. Liu, Anal. Chem., 2013, 85, 8601 CrossRef CAS PubMed.
- C. A. Lepre, J. M. Moore and J. W. Peng, Chem. Rev., 2004, 104, 3641 CrossRef CAS PubMed.
- B. Lam and A. J. Simpson, Analyst, 2008, 133, 263 RSC.
- T. L. Hwang and A. J. Shaka, J. Magn. Reson., Ser. A, 1995, 2, 275 CrossRef.
- M. Liu, X. Mao, C. Ye, H. Huang, J. K. Nicholson and J. C. Lindon, J. Magn. Reson., 1998, 132, 125 CrossRef CAS.
- G. Zheng, A. M. Torres and W. S. Price, J. Magn. Reson., 2008, 194, 108 CrossRef CAS PubMed.
- B. D. Nguyen, X. Meng, K. J. Donovan and A. J. Shaka, J. Magn. Reson., 2007, 184, 263 CrossRef CAS PubMed.
- R. W. Adams, C. M. Holroyd, J. A. Aguilar, M. Nilsson and G. A. Morris, Chem. Commun., 2013, 49, 358 RSC.
- T. Parella, P. Adell, F. Sánchez-Ferrando and A. Virgili, Magn. Reson. Chem., 1998, 36, 245 CrossRef CAS.
- Y. B. Monakhova, H. Schäfer, E. Humpfer, M. Spraul, T. Kuballa and D. W. Lachenmeier, Magn. Reson. Chem., 2011, 49, 734 CrossRef CAS PubMed.
- A. Botana, J. A. Aguilar, M. Nilsson and G. A. Morris, J. Magn. Reson., 2011, 208, 270 CrossRef CAS PubMed.
- K. Takegoshi, K. Ogura and K. Hikichi, J. Magn. Reson., 1989, 84, 611 Search PubMed.
- P. C. M. Van Zijl, C. T. W. Mooned and M. Von Kienlin, J. Magn. Reson., 1990, 89, 28 CAS.
- R. J. Ordidge and I. D. Cresshull, J. Magn. Reson., 1986, 69, 151 CAS.
- M. D. Pelta, G. A. Morris, M. J. Stchedroff and S. J. Hammond, Magn. Reson. Chem., 2002, 40, S147 CrossRef CAS.
- G. Wider, V. Dötsch and K. Wüthrich, J. Magn. Reson., Ser. A, 1994, 108, 255 CrossRef CAS.
- G. A. Morris, H. Barjat and T. J. Home, J. Prog. Nucl. Magn. Reson. Spectrosc., 1997, 31, 197 CrossRef CAS.
- P. Ebrahimi, M. Nilson, G. A. Morris, H. M. Jensen and S. B. Engelsen, J. Chemom., 2014, 28, 656 CrossRef CAS.
- R. W. Dykstra, J. Magn. Reson., 1987, 72, 162 CAS.
- M. R. Bendall and D. T. Pegg, J. Magn. Reson., 1985, 63, 494 CAS.
- Y. Lin, N. Lisitza, S. Ahn and W. S. Warren, Science, 2000, 290, 118 CrossRef CAS PubMed.
- N. Psychogios, D. D. Hau, J. Peng, A. C. Guo, R. Mandal, S. Bouatra, I. Sinelnikov, R. Krishnamurthy, R. Eisner, B. Gautam, N. Young, J. Xia, C. Knox, E. Dong, P. Huang, Z. Hollander, T. L. Pedersen, S. R. Smith, F. Bamforth, R. Greiner, B. McManus, J. W. Newman, T. Goodfriend and D. S. Wishart, PLoS One, 2011, 6, e16957 CAS.
Footnotes |
| † Electronic supplementary information (ESI) available. See DOI: 10.1039/c5an02121a |
| ‡ Current address: The Queen's College, University of Oxford, OX1 4AW, UK. |
| This journal is © The Royal Society of Chemistry 2016 |

