 Open Access Article
All-in-one: a versatile gas sensor based on fiber enhanced Raman spectroscopy for monitoring postharvest fruit conservation and ripening†
Tobias
Jochum
a,
Leila
Rahal
a,
Renè J.
Suckert
a,
Jürgen
Popp
ab and
Torsten
Frosch
*ab
aLeibniz Institute of Photonic Technology, Jena, Germany
bInstitute of Physical Chemistry and Abbe Center of Photonics, Friedrich Schiller University, Jena, Germany. E-mail: torsten.frosch@uni-jena.de; torsten.frosch@gmx.de
First published on 17th February 2016
Abstract
In today's fruit conservation rooms the ripening of harvested fruit is delayed by precise management of the interior oxygen (O2) and carbon dioxide (CO2) levels. Ethylene (C2H4), a natural plant hormone, is commonly used to trigger fruit ripening shortly before entering the market. Monitoring of these critical process gases, also of the increasingly favored cooling agent ammonia (NH3), is a crucial task in modern postharvest fruit management. The goal of this work was to develop and characterize a gas sensor setup based on fiber enhanced Raman spectroscopy for fast (time resolution of a few minutes) and non-destructive process gas monitoring throughout the complete postharvest production chain encompassing storage and transport in fruit conservation chambers as well as commercial fruit ripening in industrial ripening rooms. Exploiting a micro-structured hollow-core photonic crystal fiber for analyte gas confinement and sensitivity enhancement, the sensor features simultaneous quantification of O2, CO2, NH3 and C2H4 without cross-sensitivity in just one single measurement. Laboratory measurements of typical fruit conservation gas mixtures showed that the sensor is capable of quantifying O2 and CO2 concentration levels with accuracy of 3% or less with respect to reference concentrations. The sensor detected ammonia concentrations, relevant for chemical alarm purposes. Due to the high spectral resolution of the gas sensor, ethylene could be quantified simultaneously with O2 and CO2 in a multi-component mixture. These results indicate that fiber enhanced Raman sensors have a potential to become universally usable on-site gas sensors for controlled atmosphere applications in postharvest fruit management.
Introduction
Postharvest produce management encompassing storage and transport has become an important branch of modern logistics. Nowadays, more than half of the maritime transport of refrigerated products is represented by fruit transports.1 Most of the imported fruit spends several days in transit between the country of production and the final market, where their ripening is typically performed by the wholesaler or retailer. Since consumers judge the quality of fruits by their appearance and sales increase if fresh, ready-to-eat produce are available,2 postharvest technology and handling is a major challenge to successful fruit marketing. For all these reasons, thorough monitoring of fruit ripeness during the complete production chain is essential. To avoid fruit decay during transport and to optimize its quality on the market, most fruits are shipped in conservation chambers, which delay the ripening process.3 In low-oxygen (LO) or ultra-low oxygen chambers (ULO), fruits are exposed to low temperatures around 0 °C, high humidity (90–95%), low oxygen (approx. 2–3% O2 for LO, 1–1.5% O2 for ULO) and high carbon dioxide levels (approx. 2–5% CO2 for LO, 1–1.5% CO2 for ULO).4 The role of ethylene (C2H4) in fruit ripening is twofold: since low C2H4 concentrations are produced by the fruit itself during ripening, ethylene can act as a ripeness indicator; but it is also a natural plant hormone that triggers fruit ripening, as ethylene coordinates the expression of genes responsible for a variety of processes such as rise in respiration, autocatalytic ethylene production and changes in color, texture, flavor and aroma.5,6 Depending on the fruit type, ethylene concentrations should thus be kept in low parts per million (ppm) or parts per billion (ppb) levels in conservation chambers to avoid early ripening and fruit losses;7 whereas inside ripening rooms C2H4 concentrations of up to 1000 ppm are possible.8 In food cooling systems such as LO's and ULO's, monitoring of ammonia (NH3) is of particular interest because it becomes more and more the coolant of choice since substances with high ozone layer endangering potential are strictly regulated. In case of leakage, ammonia concentrations can rise easily to several hundred ppm or more, which demands safety actions for human protection.9 Additionally, emergent ammonia could spoil stored fruit, e.g. by causing skin blackening.10Commonly used fruit quality parameters such as firmness,11 starch or sugar content12 are not well suited for automated supervision, because they require unpacking or destructive sampling. Also, fruit color is often only weakly correlated to fruit ripeness.13 Non-destructive methods to determine fruit ripeness by the level of soluble solids, ethylene concentration, chlorophyll or moisture content have been proposed, such as nuclear magnetic resonance14 (NMR), proton magnetic resonance15 (PMR), optical reflectance16 or infrared absorption spectroscopy.17–19 Recently, a variety of electronic nose (e-nose) approaches, widely utilizing chemoresistive gas sensors, attracted a lot of attention.20–22 Here, mainly fruit-emitted aromatic volatiles or ethylene were measured to assess fruit ripening. Although most of these approaches are very sensitive, they rely upon expensive equipment23 and/or are only suited to quantify a limited number of gases. Additionally, electrochemical sensors show gradual decrease in sensitivity which rapidly renders calibration data inapplicable.24 Furthermore, chemoresistive metal oxide sensors for ethylene monitoring exhibit strong cross-interferences and are sensitive to humidity, which requires additional compensation methods.25
In this study, we present a gas sensor based on fiber enhanced Raman spectroscopy for on-site process gas monitoring throughout the complete postharvest production chain encompassing storage and transport in fruit conservation chambers as well as commercial fruit ripening in industrial ripening rooms. The gas sensor's capability was tested by obtaining and assessing a suitable sensor calibration for oxygen and carbon dioxide. Ammonia levels appropriate for chemical alarm purposes were established and successfully detected. Ethylene was measured down to a concentration of 100 ppm within a multi-gas mixture of O2, CO2, NH3 and N2 without any cross-sensitivity. The goal of the work presented here was to develop and demonstrate the use of a single sensor covering simultaneously non-destructive oxygen, carbon dioxide, ethylene and ammonia monitoring over a wide concentration range of ppm up to percent levels while maintaining short measurement times.
Materials and methods
Experimental setup – optical part
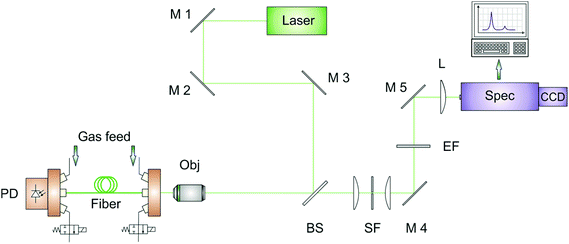
Raman gas spectroscopy offers simultaneous detection and quantification of multi-gas mixtures in a wide concentration range from ppm levels up to pure compounds.26–33 Due to the gas molecule's small Raman cross-sections, typically in the order of 10−23 cm2 sr−1,34 Raman signals are intrinsically low and need to be enhanced. A novel approach is to use hollow-core photonic crystal fibers35 (HC-PCF), which act as optical light guide as well as analyte container for the investigated processes gases.36,37 The optical design of the Raman sensor is schematically depicted in Fig. 1. The laser beam from a frequency-doubled Nd:YAG laser (Laser Quantum, laser excitation wavelength λexc. = 532 nm) is reflected by a dichroic beamsplitter (Semrock) into an objective (Olympus LUCPLFLN 20X), where it is focused in a 30 cm HC-PCF (NKT) with a bandgap suitable for low-attenuation guiding of Raman signals up to 3500 cm−1. This length is a good compromise between low analyte–laser interaction times within shorter fibers resulting in a lower overall Raman intensity38 and the increasing attenuation of guided light within longer fibers. The central transmission wavelength of the HC-PCF is 532 nm and the hollow core has a diameter of approx. 5 μm. Gases enter the HC-PCF via custom-made fiber adapters.39 Adapters are installed at each end of the HC-PCF and provide reproducible laser coupling and scattered Raman light collection through optical windows as well as filling of the fiber with the analyte gases. The adapters can bear pressures up to 20 bar and have an internal dead volume of approx. 0.1 microliter. During measurements, the adapter's gas outlets were closed by magnetic valves. After laser-molecule scattering, the redshifted Raman Stokes signal is coupled out of the fiber in a backscattering geometry, passing again the objective and the beamsplitter. Pinholes of 10 or 15 μm diameter (Thorlabs) were used for spatial filtering of the silica Raman signal originating from the fiber cladding and thus for reducing the spectral background.40 After passing an edge filter to suppress the Rayleigh signal, the scattered light is focused on the slit of the spectrometer (Acton SP2500, Princeton Instruments). A grating with 1800 lines per mm was chosen for high resolution. The setup magnifies light from the hollow core at the fiber exit to an approximately 60 μm diameter spot with numerical aperture (NA) of 0.05 on the spectrometer entrance slit to achieve optimal etendue.Gas feed and measurement
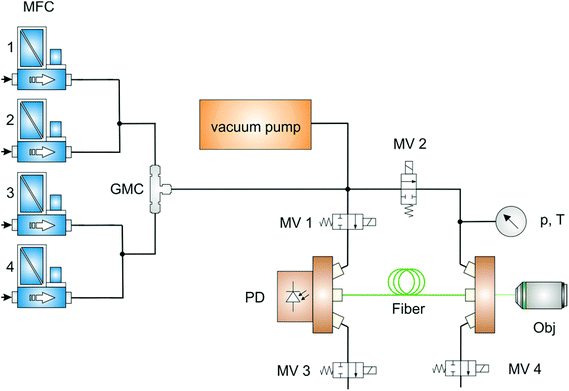
The gas feed line is schematically shown in Fig. 2. To simulate typical process gas compositions within the fruit ripening product chain, pure gases (purchased from Linde) were precisely mixed by mass flow controllers (Brooks Instrument) and subsequently injected. A gas mixing chamber provided homogeneous gas mixing and a stable gas flow, controlled by custom-made software based on LabView (National Instruments). Before each individual measurement, the fiber was automatically evacuated (inner pressure below 0.05 mbar) with a vacuum pump (Vacuubrand) to avoid cross-contamination. The gas mixture entered the HC-PCF from both ends with a pressure of approx. 2.0 bar by opening the magnetic valves 1 and 2 at the fiber adapters. During filling and measurement, magnetic valves 3 and 4 were shut. Given this pressure-driven filling procedure and the setup parameters, sub minute filling times for all gases were expected according to the model of Wynne et al.41 In separate test measurements beforehand, we observed stable Raman intensities for several applied gas concentrations after a filling time of one minute. Thus, all reported gas measurements were initiated one minute after opening the fiber adapter's magnetic valves 1 and 2. During measurements, all magnetic valves were shut. After each individual measurement, all gas-containing components were evacuated again to avoid cross-contamination with subsequent measurements. Alternatively, measured gases originating from fruit conservation or ripening chambers could also be redirected into the chamber via the magnetic valves 3 and 4 without any manipulation of the gas composition, which facilitates process monitoring in situ. Due to the compact and airtight design of the gas feed line, contamination of the analyte gases with ambient air was not observed in the Raman spectra.Obtained spectra were normalized by absolute pressure and temperature (both measured with a pressure sensor, Keller), as well as by transmitted power (power sensor, Thorlabs). A beforehand acquired spectrum of pure Argon was used for background correction. For each gas, the respective Raman band in the background corrected spectrum was integrated, yielding a peak area A, and normalized with the average pressure p (in bar), temperature T (in Kelvin) and transmitted power P (in Watt) during the spectrum acquisition according to
 | (1) |
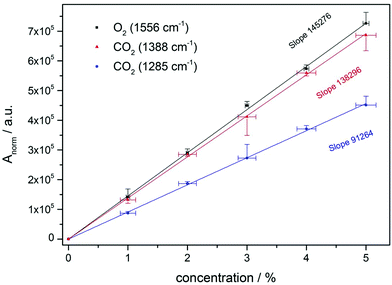
As not only macroscopic thermodynamic systems are temperature dependent, but also populations of molecular energy levels and thus the Raman Stokes intensity, the used normalization formula applies only for moderate changes in temperature. The normalized peak area Anorm was referred to the applied gas concentrations in the sensor calibration (Fig. 3) and used in the subsequent measurements to quantify simulated process gas compositions.
Results and discussion
Monitoring of fruit conservation chamber gases
Sensor calibration to oxygen and carbon dioxide was performed with precisely mixed test gases of varying concentrations. A concentration range of 1 to 5 percent was chosen, since this reflects O2 and CO2 levels in fruit conservation chambers. After evacuation of the fiber, test gases containing equal levels of oxygen and carbon dioxide (remainder nitrogen) were filled in the fiber up to a pressure of approx. 2.0 bar. The temperature of gases entering the fiber was approx. 22 degree Celsius. Measurement time for one spectrum was 60 seconds (30 seconds exposure time and 2 accumulations). Thus, monitoring of O2 and CO2 concentration levels with suitable time resolution is feasible. Gas mixtures were measured in triplicate and averaged. After each single measurement, the HC-PCF and other gas-containing parts were evacuated. The vibrational band ν0 at 1556 cm−1 of oxygen and the Fermi dyad of carbon dioxide (vibrational bands ν1 at 1285 and 2ν2 at 1388 cm−1) were selected for concentration analysis. As sensor calibration for O2 and CO2 was done simultaneously in multi-gas mixtures containing O2, CO2 and N2, the time needed to set the sensor up had been minimized.The results (Fig. 3) show the linearity of the normalized Raman peak area versus the compound concentration, which can be used to quantify unknown gas compositions. Mean normalized peak areas along with the respective standard deviation were calculated based on triplicate measurements for every concentration value. In general, small standard deviations of the mean normalized Raman peak area of about 5 percent or lower were achieved for all established gas concentrations during the sensor calibration, only the mean peak area of the 3 percent CO2 measurement shows standard deviations of approx. 13 percent. Most likely, this was caused by small deteriorations of the gas feed line and will be quantified and corrected by using inert gaseous tracers in future experiments. However, coefficients of determination (R2) of more than 0.999 for all linear calibration functions indicate a stable sensor calibration. The standard deviation of the concentration was calculated according to the product specifications of the used mass flow controllers. Because of its higher Raman cross section, the calibration function of the CO2 band at 1388 cm−1 provides a larger slope than the one from the band at 1285 cm−1. Highest sensitivity was reached for oxygen.
Several gas mixtures common for fruit conservation chambers were established and quantified with the Raman sensor (Table 1). Since CO2 concentrations of the applied gases were overdetermined by using both Raman bands of the Fermi dyad, the accuracy of the total carbon dioxide level in the gas samples can be further enhanced by combining their concentration values originating from individual calibration data. For all test gas concentrations, calculated concentration values are in good agreement with established ones, the average deviation is smaller than 1 percent with respect to the individual reference concentration.
| Gas mixture | O2 conc. reference | O2 conc. measured | CO2 conc. reference | CO2 conc. measured | Conservation chamber type |
|---|---|---|---|---|---|
| 1 | 1.50 | 1.53 | 1.50 | 1.52 | ULO |
| 2 | 2.00 | 2.00 | 3.00 | 2.91 | LO |
| 3 | 3.00 | 3.02 | 5.00 | 5.01 | LO |
Ammonia leakage in fruit conservation chambers can cause serious damage to humans and fruit. By evaluating the vibrational band of ammonia at 3334 cm−1,42 the Raman sensor could be used to monitor ammonia levels continuously and to detect potential leakages, such that immediate response is possible. Ammonia concentrations of 750 ppm (remainder N2) could be clearly detected (Fig. S2†). This concentration is suited for chemical alarm purposes,43 since ammonia levels rise rapidly in case of leakage, and also higher concentrations up to percentage levels can be monitored without sensor re-calibration. Thus, all relevant process gases within standard ULO and LO fruit conservation chambers, namely O2, CO2 and NH3, could be simultaneously monitored by the presented Raman sensor.
Fruit ripening monitoring
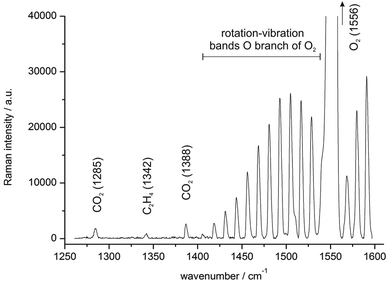
Oxygen and carbon dioxide are important gaseous indicators also beyond conservation chambers. Since many fruits such as peaches, bananas, apples etc. are climacteric, their ripening is accompanied by a dramatic increase in respiration.44 Thus, monitoring O2 and CO2 levels (fruit respiration) with the Raman gas sensor (see Fig. 3 and Table 1) could assess fruit ripening performance in ripening chambers.45 Here, measuring the respiratory quotient (RQ) could yield auxiliary information about the ripening process, indicating pre-climacteric, climacteric or post-climacteric stages.46 For instance, CO2 levels could rise approx. threefold during strawberry ripening under climacteric conditions.47 Additionally, low carbon dioxide levels could indicate potential freeze damage, e.g. in oranges.48However, ethylene plays the main role in fruit ripening as ripeness indicator and plant hormone as well. Thus, it is beneficial to monitor O2, CO2 and C2H4 concentrations simultaneously during forced fruit ripening. Fig. 4 displays a derived Raman spectrum of 20% O2, 500 ppm CO2 and 250 ppm C2H4, simulating a possible fruit chamber atmosphere. The gas composition was precisely mixed by mass flow controllers and the complete measurement time was 10 minutes. Most prominent are the vibrational band ν0 of oxygen (Q branch at 1556 cm−1) and its rotation–vibration bands in the O branch (with rotational quantum number J = 25 at approx. 1405 cm−1 up to 1540 cm−1 for J = 1);49 but due to the high spectral resolution of the Raman sensor, the carbon dioxide (Fermi dyad at 1285 and 1388 cm−1) and ethylene signals (CH2 scissoring vibration ν3 at 1342 cm−1) could be clearly distinguished from the stronger oxygen peaks within just a single measurement. For quantification of oxygen levels, only the mean normalized Raman peak area of the vibrational band (Q branch) is needed. The results additionally demonstrate the Raman sensor's high dynamic range of about 4 orders of magnitude.
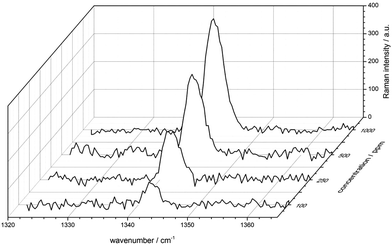
To demonstrate the Raman sensor's sensitivity, several ethylene concentrations were established and measured. Fig. 5 displays the evolution of the vibrational band of ethylene at 1342 cm−1 from 100 ppm up to 1000 ppm (mixed with 20% O2, 500 ppm CO2 and remainder N2). Plotted are the background corrected mean Raman spectra, exposure time was 10 minutes for each measurement. The signal-to-noise ratio for 100 ppm ethylene yielded 7.2. Thus, fiber enhanced Raman spectroscopy is a capable technique for simultaneously quantifying ethylene in a mixture together with the major atmospheric gases N2, O2 and CO2.
Conclusion and outlook
A versatile gas sensor setup for on-site process gas monitoring throughout the complete postharvest fruit production chain was developed. Utilizing a hollow-core photonic crystal fiber for analyte gas confinement and sensitivity enhancement, simultaneous quantification of O2, CO2, NH3 and C2H4 without cross-sensitivity was feasible in just one single measurement. Laboratory test measurements showed the reliability of the sensor calibration and were in good agreement with expected reference gas concentrations. Suitable ethylene concentrations to assess fruit ripening were detected, preventing fruit to decline into senescence (typically over 100 ppm). Using one single sensor for all relevant process gases has many benefits; it reduces costs and facilitates user training, improves comparability of measured values and eliminates most systematic errors involved in the analysis or makes these errors constant. It is shown that fiber enhanced Raman spectroscopic sensors have a potential to become versatile applicable on-site gas sensors for controlled atmosphere applications in postharvest fruit management.Acknowledgements
Funding of the research project by the Free State of Thuringia (Germany) and the European Union (EFRE) is highly acknowledged (FKZ: 2012 FGR 0013). We thank Di Yan for valuable support and advice during sensor build-up.References
- Y. Wild, R. Scharnow and M. Rühmann, Container Handbook, Gesamtverband der Deutschen Versicherungswirtschaft e.V. (GDV), Berlin, 2005 Search PubMed.
- A. A. Kader, Acta Hortic., 1999, 485, 203–208 CrossRef.
- A. Kader, Food Technol., 1980, 34, 51–54 Search PubMed.
- J. Fonollosa, B. Halford, L. Fonseca, J. Santander, S. Udina, M. Moreno, J. Hildenbrand, J. Wollenstein and S. Marco, Sens. Actuators, B, 2009, 136, 546–554 CrossRef CAS.
- S. Yang and J. Oetiker, Postharvest Physiology of Fruits 398, 1994, pp. 167–178 Search PubMed.
- M. Rhodes, Biochemistry of fruits and their products, Academic Press Inc., London, 1970 Search PubMed.
- A. Vergara, E. Llobet, J. L. Ramirez, P. Ivanov, L. Fonseca, S. Zampolli, A. Scorzoni, T. Becker, S. Marco and J. Woellenstein, Sens. Actuators, B, 2007, 127, 143–149 CrossRef CAS.
- R. Jedermann, C. Behrens, D. Westphal and W. Lang, Sens. Actuators, A, 2006, 132, 370–375 CrossRef CAS.
- A. Jerger, H. Kohler, F. Becker, H. B. Keller and R. Seifert, Sens. Actuators, B, 2002, 81, 301–307 CrossRef CAS.
- G. B. Ramsey and L. Butler, J. Agric. Res., 1928, 37, 339–348 CAS.
- B. D. Horton, J. Am. Soc. Hortic. Sci., 1992, 117, 784–787 Search PubMed.
- E. Vangdal, Acta Agric. Scand., 1980, 30, 445–448 CrossRef.
- J. Brezmes, M. L. L. Fructuoso, E. Llobet, X. Vilanova, I. Recasens, J. Orts, G. Saiz and X. Correig, IEEE Sens. J., 2005, 5, 97–108 CrossRef.
- M. Musse, S. Quellec, M. Cambert, M. F. Devaux, M. Lahaye and F. Mariette, Postharvest Biol. Technol., 2009, 53, 22–35 CrossRef CAS.
- W.-K. Wai, R. Stroshine and G. Krutz, Trans. ASAE, 1995, 38, 849–855 CrossRef.
- M. Li, D. C. Slaughter and J. F. Thompson, Postharvest Biol. Technol., 1997, 12, 273–283 CrossRef.
- C. A. T. dos Santos, M. Lopo, R. N. M. J. Pascoa and J. A. Lopes, Appl. Spectrosc., 2013, 67, 1215–1233 CrossRef PubMed.
- E. H. Wahl, S. M. Tan, S. Koulikov, B. Kharlamov, C. R. Rella, E. R. Crosson and D. Biswell, Opt. Express, 2006, 14, 1673–1684 CrossRef CAS PubMed.
- R. Centeno, J. Mandon, S. M. Cristescu and F. J. M. Harren, Sens. Actuators, B, 2014, 203, 311–319 CrossRef CAS.
- M. Peris and L. Escuder-Gilabert, Anal. Chim. Acta, 2009, 638, 1–15 CrossRef CAS PubMed.
- E. Llobet, E. L. Hines, J. W. Gardner and S. Franco, Meas Sci. Technol., 1999, 10, 538–548 CrossRef CAS.
- B. Esser, J. M. Schnorr and T. M. Swager, Angew. Chem., Int. Ed., 2012, 51, 5752–5756 CrossRef CAS PubMed.
- M. Zude, M. Linke, B. Herold, R. Reisch and H. Ahlers, Landtechnik, 2002, 57, 218–219 Search PubMed.
- SiraTechnology, Gas Detector Selection and Calibration Guide, Witherby, 2005 Search PubMed.
- A. Giberti, M. C. Carotta, V. Guidi, C. Malagu, G. Martinelli, M. Piga and B. Vendemiati, Sens. Actuators, B, 2004, 103, 272–276 CrossRef CAS.
- T. Jochum, B. Michalzik, A. Bachmann, J. Popp and T. Frosch, Analyst, 2015, 140, 3143–3149 RSC.
- R. Keiner, T. Frosch, S. Hanf, A. Rusznyak, D. M. Akob, K. Kusel and J. Popp, Anal. Chem., 2013, 85, 8708–8714 CrossRef CAS PubMed.
- T. Frosch, R. Keiner, B. Michalzik, B. Fischer and J. Popp, Anal. Chem., 2013, 85, 1295–1299 CrossRef CAS PubMed.
- T. Jochum, J. C. von Fischer, S. Trumbore, J. Popp and T. Frosch, Anal. Chem., 2015, 87, 11137–11142 CrossRef CAS PubMed.
- R. Keiner, T. Frosch, T. Massad, S. Trumbore and J. Popp, Analyst, 2014, 139, 3879–3884 RSC.
- T. M. James, S. Rupp and H. H. Telle, Anal. Methods, 2015, 7, 2568–2576 RSC.
- J. Kiefer, T. Seeger, S. Steuer, S. Schorsch, M. C. Weikl and A. Leipertz, Meas. Sci. Technol., 2008, 19, 085408 CrossRef.
- R. Salter, J. Chu and M. Hippler, Analyst, 2012, 137, 4669–4676 RSC.
- H. W. Schrötter and H. W. Klöckner, in Raman Spectroscopy of Gases and Liquids, ed. A. Weber, Springer, Berlin Heidelberg, 1979, vol. 11, ch. 4, pp. 123–166 Search PubMed.
- P. Russell, Science, 2003, 299, 358–362 CrossRef CAS PubMed.
- S. Hanf, R. Keiner, D. Yan, J. Popp and T. Frosch, Anal. Chem., 2014, 86, 5278–5285 CrossRef CAS PubMed.
- M. P. Buric, K. P. Chen, J. Falk and S. D. Woodruff, Appl. Opt., 2008, 47, 4255–4261 CrossRef CAS PubMed.
- X. Yang, A. S. P. Chang, B. Chen, C. Gu and T. C. Bond, Sens. Actuators, B, 2013, 176, 64–68 CrossRef CAS.
- T. Frosch, D. Yan and J. Popp, Anal. Chem., 2013, 85, 6264–6271 CrossRef CAS PubMed.
- S. Hanf, T. Bogozi, R. Keiner, T. Frosch and J. Popp, Anal. Chem., 2015, 87, 982–988 CrossRef CAS PubMed.
- R. M. Wynne, B. Barabadi, K. J. Creedon and A. Ortega, J. Lightwave Technol., 2009, 27, 1590–1596 CrossRef CAS.
- R. Dickinson, R. Dillon and F. Rasetti, Phys. Rev., 1929, 34, 582 CrossRef CAS.
- B. Timmer, W. Olthuis and A. van den Berg, Sens. Actuators, B, 2005, 107, 666–677 CrossRef CAS.
- H. K. Pratt and J. Goeschl, Annu. Rev. Plant Physiol., 1969, 20, 541–584 CrossRef CAS.
- R. Jedermann, U. Praeger, M. Geyer and W. Lang, Philos. Trans. R. Soc. London, Ser. A, 2014, 372 Search PubMed.
- S. A. Sampaio, P. S. Bora, H. J. Holschuh and S. d. M. Silva, Food Sci. Technol., 2007, 27, 511–515 CAS.
- P. P. M. Iannetta, L. J. Laarhoven, N. Medina-Escobar, E. K. James, M. T. McManus, H. V. Davies and F. J. M. Harren, Physiol. Plant., 2006, 127, 247–259 CrossRef CAS.
- E. S. Tan, D. C. Slaughter and J. F. Thompson, Postharvest Biol. Technol., 2005, 35, 177–182 CrossRef.
- A. Weber and E. A. Mcginnis, J. Mol. Spectrosc., 1960, 4, 195–200 CrossRef CAS.
Footnote |
| † Electronic supplementary information (ESI) available. See DOI: 10.1039/c5an02120k |
| This journal is © The Royal Society of Chemistry 2016 |

